Teladoc Trade [TDOC]A staple of Cathie Wood's ARKK Invest fund, Teladoc looks to be winding up for a big move in the coming days after breaking the resistance of a supply line that has kept TDOC stagnant since the peak of its small rally in June.
Now we find it at a key support level just outside of the trendline and finding support on our 21 MA as well.
I am long on TDOC with a stop loss at $149.99. At this point, if the green horizontal line of support would be broken, the next level we want to look at for a long would be $146.84. However, a break and close of $146 would be a break into my no trade zone.
Bonus points for the asset if it can hold and maintain price action outside of our green, downward sloping line of resistance now hopefully flipped support.
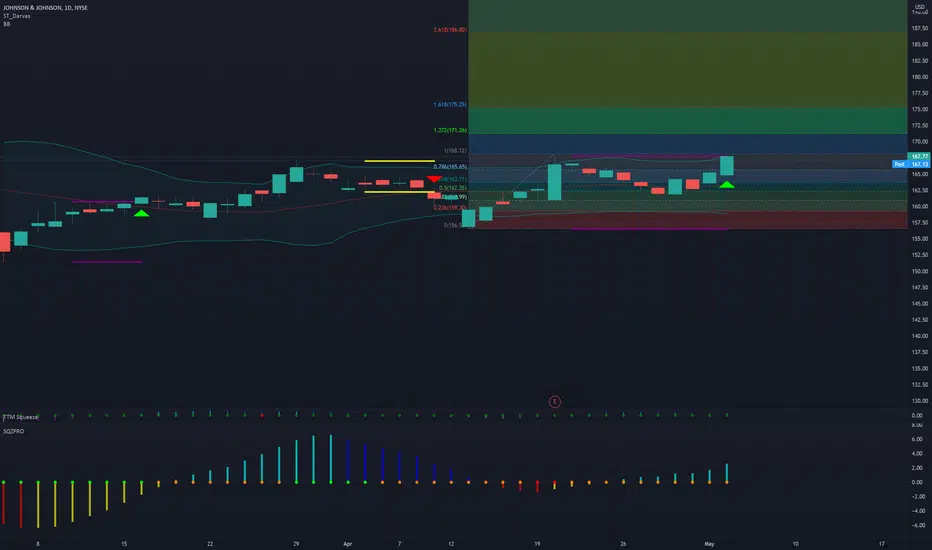
JNJ


Are Covid Stocks Coming Back?If there is any hope for the S&P right now it may very well come from the healthcare sector with mega blue chip Johnson & Johnson.
JNJ has managed to put in consecutive higher highs and higher lows on the weekly, and now also is confirming support on the .618 fibonacci level at $165.40.
However, there appears to still be much selling pressure at just above $168, so don't be surprised if we continue to see consolidation for another a week or two before getting the confirmed breakout above our red resistance line at the aforementioned $168 price level.
If resistance at this level is broken, we will be seeing a possible retest of blue sky all time highs for the healthcare giant JNJ.
In the meantime, I am liking the idea of small longs along the .618 ($165.40) area as long as the upward sloping green trend is not violated.

$JNJ | Model Prints New All Time High'sThe targets on this chart are produced by a proprietary model. Data is fed into the model, the output is the targets you see on the chart. The support zone is also defined by the model.

JNJ Will the $200 stop a protracted and non-corrective rally?Johnson & Johnson is a major manufacturer of cosmetic and sanitary products, as well as medical equipment and medicines. The company was founded in 1886.
In general, the history of the company is mega-successful. The corporation expanded through the purchases of competitors and gained more and more market share in its areas.
The company's progress is confirmed by the capitalization, which exceeds $430bn , as well as the graph of the JNJ share price, which is growing parabolic.
For 10 years, from 2002 to 2012, smart and patient investors recruited long positions in JNJ shares. During this period, the price traded in a broad consolidation of $46-71, growing volumes talked all - patience and everything will be)
From 2012 to the present, the value of JNJ shares has grown practically without correction.
Even during the Covid market plunge in February-March 2020, JNJ shares fell by only -29%. For example, then the S&P500 fell by -35%, the DJI index -38%, and the shares of the hype TSLA by as much as -60%.
The investors in this company knew and believed and they did not lose, because during the COVID-19 pandemic, a subsidiary of Johnson & Johnson, Janssen Pharmaceutica, developed a vaccine against this virus, which is certified for use in the USA and the EU, and the value of JNJ shares has renewed its absolute maximum.
Since the beginning of the year, JNJ's share price has been pushed towards the important $171 level . After the price fixes above this level, another upward impulse will take place.
We assume that it may be final before the start of a prolonged downward correction.
In the region of $195-200, it is better to fix the longs and look around, because the correction can be deep enough, and enough people who want to buy JNJ shares again may be in the $ 84-96 zone.

JNJits just idea... breakout or breakdown 👀 possible rising wedge, ascending triangle or still sideways...

JNJ - Ascending Triangle + Bad NewsI absolutely hate this company.
- Moving averages suggest bullish trend.
- 3rd attempt at major resistance.
- Doji Candle formed = change in trend/momentum.
- "Inside Day" pattern formed = Suggesting a continuation of the current trend. In this situation, it should continue the uptrend for a short period of time until a new pattern/confluence forms.
- However, JNJ can't catch a break regarding its vaccine. Issue after issue...
- Earnings Report - 7/21
This is a patience play. If you like to jump the gun, you could get burned...but with proper risk management, it may be worth the risk.
If you trade options:
Aggressive --> Play the Doji this week. 2 week expiration.
Moderate --> Wait for a few candles to form after today's doji. 1-2 month expiration.
Conservative --> Wait until after earnings. October expiration.

OCGN "variant stew"Alot going on in this chart but bear(or bull) with me.. 100MA being tested, broke above trend line and alot of confluence occuring all at once while the "Variant" is the big talk of the days.
Quite a bit of upside here if good PR comes out on OCGN. Otherwise we could see this get swatted right back down under the trend line and below the 100MA. My calls are in for a solid risk reward play here.
Trade safe and have fun! SMASH that like button and let me know your thoughts in the comments!


Johnson and Johnson Struggling Below a Historic Resistance The share price appears unable to break out above the historic resistance level at 170.00, which represents a very strong bearish signal.
Moreover, the price action has recently established a broad 1-5 impulse wave pattern, as postulated by the Elliott Wave Theory, as well as having developed an Ascending Wedge. Both of these developments confirm the bearish expectations.
Finally, yesterday's trading session resulted in the creation of a Shooting Star candle, which could be a precursor to an imminent reversal.
Overall, there seems to be a very strong confluence of bearish indications at present.
The 23.6 and 38.2 per cent Fibonacci retracement levels represent the most likely targets for such a dropdown.

Long | JNJNYSE:JNJ \
Possible Scenario: LONG
Evidence: Price Action
TP: 175$
Call options, Strike 175$, 06/18/21
* This is my idea and could be wrong 100%.


JNJ 1.272 Fib Ext Target IdentifiedJNJ which is a component of the DOW is scanning on A6 with a short squeeze setup. Using Fib extension 1.272 target, a price target has been identified to be approx $175. This extension was developed using the March 4th and 29th lows and highs, respectively. A6 scanning implies there is news being priced in and perhaps JNJ may announce or report new drug studies that could ignite the price to push toward the 2.618 fib ext which is $186. If this is the case, then JNJ may as well run toward a psych tgt of $200 sometime within the next 14 to 34 trading days.
JNJ - STOCKS - 26. APR. 2021Welcome to our weekly trade setup ( JNJ )!
-
4 HOUR
Bullish price action.
DAILY
Possible turnover and pressure towards previous highs.
WEEKLY
Expecting more bullish price movement.
-
STOCKS SETUP
BUY JNJ
ENTRY LEVEL @ 164.20
SL @ 160.79
TP @ Open
Max Risk: 0.5% - 1%!
(Remember to add a few pips to all levels - different Brokers!)
Leave us a comment or like to keep our content for free and alive.
Have a great week everyone!
ALAN


JOHNSON & JOHNSON (JNJ)In my work, I always try to combine fundamental analysis and technical analysis.
They are both important, especially on a topic as important as the covid vaccine.
Johnson & Johnson is about to be marketed, after the approval of the EMA on 11 March.
Exactly after the announcement, I bought the stock.
The JnJ vaccine has a much lower distribution cost than Pfizer since it can be stored at refrigerator temperatures, like AstraZeneca.
The difference is in the prestige and history that the company has.
Moreover, the share according to the average of analysts, still has ample room for growth, with an average target of $ 185 and a second "high" at $ 200.
Technically speaking, the price bounced off the bullish support trendline on Thursday, March 4th, and then broke the resistance trendline on the 12th, exactly the day after the announcement of the EMA's approval.
The trend is clearly bullish, but, even keeping in mind the analysts' opinion, I believe the first target in area 170 is more likely.
If everything goes well with the vaccine, the analyst targets could be greatly raised.
It is a different trade, to be constantly monitored with a trailing stop, in case there will be any hitches or cases of a block, as happened for AstraZeneca. Such an open market scenario would cause a crash, so you have to be ready to get out quickly.
Lazy Bull
1st target: 170
2nd target: 180
3rd target: 200
DISCLAIMER: I am not a financial advisor nor a CPA. These posts, videos, and any other contents are for educational and entertainment purposes only. Investing of any kind involves risk. While it is possible to minimize risk, your investments are solely your responsibility. It is imperative that you conduct your own research. I am merely sharing my opinion with no guarantee of gains or losses on investments.

Bullish trendPfizer Inc.
Pfizer Inc. - PFE has a BULLISH trend
Argus
Outlook:Bullish
Long Term Target:55.00
Current Price:37.16
Idea Generated at:Apr 13, 2021
As JNJ struggles more will rotate to PFE
Reaffirming BUY with $55 target
Pfizer is scaling up manufacturing to meet its commitment to deliver two billion doses of its coronavirus vaccine by the end of 2021.

Johnson & Johnson should stick to baby wipes.....Vaccine Recall!With the news that the CDC is pausing J&J vaccine distribution due to blood clot issues.
I'm assuming we should see it tank at the open? You're guess is as good as mine.
In my opinion if we see price drop it should be a good time to buy, because everyone else is selling.
The level I'm interested in is $147-$150.
It is an untested point of control where institutions may have some buy orders sitting.
Watch for an ABCD on the line chart (close to close) for entry.
We may not break the 2021 high, but if the March equal highs remain untouched, I would look to enter because there is still possibly liquidity there.
$150 should give a nice reaction if we hit it while those highs are untouched.
Let's Elevate,
Gio


$JNJ will bounce - Dip opportunityI love JNJ long and believe that they are going to be fine with the recent COVID-related dip.
Their vaccine could do more damage than AstraZeneca's and governments will still buy it in order to herd the sheep.
You need to understand that JNJ is so much more than a vaccine company.
Expect this stock to go back up to the $167 level, as well as breaking the $170 level as well.
A great swing trade (buy covid dips), and I also love this long-term.
Lots of money to be made here!
*Not a financial advisor.
**Don't judge me on my winners. Judge me on my losers, because there are so few.

I'M BACK... updates on TSLA, PG, JNJ and SPYI'm back... from my social media ban and from a great vacation! I wanted to follow up on my last few weeks of videos and update everyone on what I think the market is doing!

JNJ BULLISH BREAKOUT With good news out regarding the one-shot vaccine and multiple bullish signals this could be a great play.
Descending wedge and potential inverse head and shoulders could see price rise to £170 and beyond.
Beware of some resistance around £165.

JNJ (NYSE) - Still BullishGreetings
Humbled, we would like to thanks for your support who has already liked, commented and followed us. Your support, strengthens us, to help in analyzing the market. If you have any questions, feel free to send us message (inbox).
Pra Trading :
- Please care for Money Management
- Have a good psychology
- Do not be hurry to open position and do not do nothing if u see opportunity
- Evaluate and upgrade your trading plan
Execution Strategy :
- Know what you want to buy, see the Fundamental
- Decide that you are on investing or speculating
- Consider what your strategy based on Investing/Speculating
- Make Road Map Of Your Trading Plan
- Decide
a. Entry strategy
b. Cut loss
c. Target of Profit
Post Trading :
a. Do not be sad if you loss or do not be very happy if you win
b. Just become a normal without emotion, Do not put emotion into your trading
c. Evaluate your trading
d. Keep on Learning
e. Be Humble
Idea :
JNJ (NYSE) - Still Bullish
