JNJ » Bullish Market Structure + Risk-Defined Swing💊 JOHNSON & JOHNSON (NYSE:JNJ) 🚀
📊 Professional Bullish Swing Trade Analysis | "Thief Strategy" Edition
Status: 🟢 BULLISH | Timeframe: Swing Trade (3-7 Days) | Risk Level: Moderate
🎯 CURRENT MARKET SNAPSHOT 📈
Current Price: $205.42 USD | 52-Week Range: $140.68 - $215.19 | Market Cap: $505.28B
Volume: 3.7M+ | Dividend Yield: 2.55% | PE Ratio (TTM): 19.83
💡 BULLISH THESIS 🔥
Johnson & Johnson is positioned for renewed momentum heading into 2026, backed by multiple catalysts. The healthcare giant reported Q3 2025 revenue of $23.99B (beating estimates of $23.76B) with EPS of $2.80 exceeding the $2.76 forecast. The company declared a $1.30 Q1 2026 dividend and has recently showcased impressive pipeline strength:
✅ FDA Priority Voucher secured for pipeline acceleration
✅ $3.05B Halda Therapeutics acquisition completed — adding prostate cancer therapy HLD-0915
✅ OTTAVA Robotic Surgical System submitted for FDA De Novo classification
✅ Positive Phase 2b JASMINE data for nipocalimab in SLE (systemic lupus erythematosus)
✅ Orthopedics spinoff planned — DePuy Synthes separation within 18-24 months
✅ $55B U.S. investment deal with Trump administration for drug cost accessibility
✅ 2026 revenue guidance: >5% growth expected (exceeding consensus)
📍 TECHNICAL SETUP: "THIEF STRATEGY" (MULTI-LAYER ENTRY) 🎯
The "Thief Strategy" uses layered limit orders to accumulate at multiple support levels, maximizing entry efficiency and risk management. This professional approach reduces slippage and emotional trading.
ENTRY LEVELS (Descending Order - Scale In):
🎯 Layer 1 (Most Aggressive): $208.00 — Initial support near recent pullbacks (33% position)
🎯 Layer 2 (Core Position): $210.00 — Strong consolidation zone (33% position)
🎯 Layer 3 (Last Buy): $215.00 — Previous 52-week high vicinity, 4.75% dip zone (34% position)
PRO TIP: If price rallies immediately, enter on dips to these levels rather than forcing entries.
🎪 RESISTANCE LEVEL - "POLICE BARRICADE" 🚨
TARGET PROFIT ZONE: 📍 $223.00 ⭐
Rationale:
Technical Resistance: Historical resistance cluster + 8.8% upside from $205.42
Fundamental Support: Analyst average price target = $209.27 (with some bullish targets at $230)
RBC Capital Markets raised target to $230 from $209 — Outperform rating active
Overbought Zone: RSI caution indicated above $223 suggests profit-taking likely
Earnings Trigger: January 21, 2026 earnings catalyst could drive volatility near target
⚠️ CRITICAL NOTE: This target represents a professional resistance + overbought zone. It is YOUR responsibility to determine exit timing based on your risk tolerance, technical confirmation, and market conditions. Not all targets will be achieved in every trade.
🛑 STOP LOSS PROTECTION 🔴
HARD STOP: $204.00 (Critical Floor)
Rationale:
-0.6% risk from current price — tight but effective
Recent support level — psychological floor below current consolidation
Protects against gap-down risk on negative news (talc litigation overhang, FDA delays)
Risk/Reward Ratio: 1:15+ if target achieved ($223 - $204 = $19 profit vs $1.42 risk)
⚠️ DISCLAIMER: We do NOT recommend using ONLY this SL. This is a baseline suggestion for swing traders. Adjust based on your portfolio heat, account size, and risk appetite. Consider partial takes at $213, $218, and $223 instead of holding all the way.
📰 FUNDAMENTAL & ECONOMIC CATALYSTS 🌍
IMMEDIATE CATALYSTS (Next 30 Days):
📅 January 21, 2026 — Q4 2025 Earnings Report (Before Market Open)
Consensus EPS Forecast: $2.53
Watch for: FY2026 guidance >5% growth reaffirmation, pipeline updates
🏥 Ongoing FDA Review Pipeline:
OTTAVA robotic system (De Novo pathway = 12-24 month timeline)
Multiple neuroscience drug submissions (CAPLYTA, SPRAVATO data presentations ongoing)
💰 Dividend Strength:
Dividend Aristocrat: 62+ consecutive years of dividend increases
Q1 2026 Dividend: $1.30/share (ex-dividend Feb 24, 2026)
Safe income stream supports stock stability
MACRO FACTORS FAVORING HEALTHCARE:
CMS 5.06% Medicare Advantage rate increase for 2026 — Benefits managed care ecosystem
Low sector valuations — Healthcare ETFs trading at discounts despite 19% 6-month gains
FDA on track for record approvals — Supporting pharma/medtech growth narrative
GLP-1 weight-loss drug market — Expected to grow 18.54% CAGR through 2030 ($13.84B→$48.84B)
Aging population dynamics — Structural tailwind for healthcare spending
RISKS TO MONITOR:
⚠️ Talc litigation overhang — Jan 2026 $40M verdict (appeal ongoing); could impact sentiment
⚠️ Patent expirations — STELARA losing exclusivity
⚠️ Tariff impacts — 39% of healthcare execs cite 2026 tariff strategy concerns
⚠️ Pipeline uncertainty — FDA approvals not guaranteed; clinical trial failures possible
💰 RELATED PAIRS TO WATCH 🔗
NYSE:ABBV (AbbVie) — High correlation 📈 | Dividend King powerhouse | Watch for Skyrizi/Rinvoq momentum
NYSE:LLY (Eli Lilly) — High correlation 📈 | GLP-1 obesity drug leader | 12%+ YoY growth driving sector
NYSE:UNH (UnitedHealth) — Moderate correlation 📈 | Managed care strength | Benefiting from 5.06% MA rate increase
NYSE:PFE (Pfizer) — Moderate correlation 📈 | GLP-1 strategy pivot | Seagen cancer platform driving growth
AMEX:XLV (Healthcare ETF) — Very High correlation 📈 | Sector momentum indicator | Best for diversified exposure
🎯 PRO TIP: If LLY/ABBV/UNH are rallying, JNJ typically follows within 1-3 sessions due to sector rotation!
📊 SWING TRADE EXECUTION CHECKLIST ✅
Pre-Entry: Confirm no major news events same day
Entry Phase: Place limit orders at $208/$210/$215 (allow 24-48 hours to fill)
Position Management: Scale in gradually; don't FOMO all-in at once
Stop Loss: Hard stop at $204.00 (non-negotiable)
Profit Targets: Consider partial exits: 33% at $213 | 33% at $218 | 34% at $223
Time Stop: Exit if still underwater after 7 trading days (time decay for swing trades)
Earnings Guard: Close or reduce position 24 hours before Jan 21 earnings to avoid gap risk
💎 KEY TAKEAWAY 🎯
JNJ presents a textbook bullish swing setup with multiple tailwinds (earnings catalyst, pipeline momentum, healthcare sector rotation, strong dividend). The "Thief Strategy" layered entry approach provides mechanical discipline and risk control for swing traders. Target $223 is realistic based on analyst consensus, but profit-taking is likely near resistance — manage your own exit accordingly.
Healthcare sector momentum is building into 2026. JNJ's defensive moat + growth catalysts = premium risk/reward for patient, disciplined traders. 🏥💪
🚀 ENGAGEMENT BOOST
✨ If you find value in my analysis, a 👍 and 🚀 boost is much appreciated — it helps me share more setups with the community!
🎯 Drop your entries and targets in the comments — let's build this Thief OG community together!
Johnson_and_johnson

Johnson & Johnson (JNJ) Finds Support at Key Level Johnson & Johnson (JNJ) continues to demonstrate strong defensive positioning and renewed momentum as structural shifts in its business and improving sentiment fuel a breakout from a multiyear downtrend. After the successful separation of its consumer health arm, J&J is now more focused on its pharmaceutical and medical technology segments—two higher-margin businesses with long-term growth drivers tied to immunology, oncology, surgical robotics and med-tech innovation.
Fundamentally, J&J’s pharma portfolio remains robust, supported by key drugs such as Darzalex, Stelara and Tremfya, with new pipeline readouts expected to broaden the company’s long-term revenue base. Meanwhile, the med-tech division continues to recover as global elective procedures normalize, giving J&J steady top-line expansion despite macro uncertainty.
Another important shift is the decreasing overhang from litigation issues—particularly talc claims—which has weighed on the stock for years. As settlements progress and legal clarity improves, investor confidence is returning, contributing to the stock’s recent momentum surge. Additionally, J&J maintains one of the strongest balance sheets in the healthcare sector, with consistent cash flow generation supporting dividends and R&D investment.
Technical Outlook
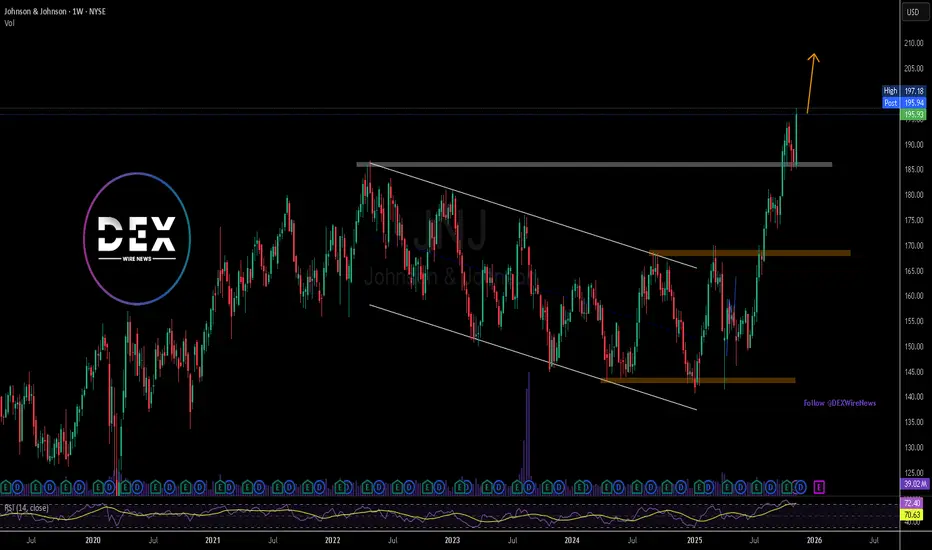
The chart shows JNJ breaking strongly above a long-term descending channel that has contained price action since 2022. This breakout, accompanied by rising volume, signals a major trend reversal from a multiyear downtrend to a new bullish phase.
Price has also reclaimed a key horizontal level around $185, turning previous resistance into new support. The current momentum suggests JNJ may now target the next major resistance zone near $205–210 phychological high.
The RSI remains elevated but healthy, reflecting strong bullish buying without extreme overextension. As long as JNJ holds above the $185 support region, the bullish structure remains intact.
Overall, Johnson & Johnson approaches 2026 with improving fundamentals, fading legal risks and a clean technical breakout, creating a constructive setup for continued upside.
Johnson & Johnson: Extended Wave 3 Nearing Completion, Watching Johnson & Johnson is showing a very nice recovery with clear impulsive price action since breaking out of the downward channel back in July. The structure suggests an ongoing trend with an extended black wave three that now has five waves up as expected, after a nice fourth wave retracement to 186 in last few weeks. So if we are correct then market is now in late stage of an extended wave 3 which could be coming to an end somewhere around 200 level; near the channel resistance. That said, be aware of a new higher degree reversal going into end of this year. However, once we see next retracement, interesting support can once again be at 186-180 region.
Highlights:
Trend: Bullish (fifth wave within ongoing wave three)
Support: 186,180
Resistance: 200–208
Invalidation: 169
Note: Favoring continuation higher after a pullback toward support

Johnson & Johnson Beats Q1 Estimates, Premarket Not Doing WellJohnson & Johnson (NYSE: NYSE:JNJ ) on Tuesday reported better-than-expected Q1 results and lifted its sales forecast for the full year.
Johnson & Johnson (NYSE: NYSE:JNJ ), together with its subsidiaries, engages in the research and development, manufacture, and sale of various products in the healthcare field worldwide, operating in two segments, Innovative Medicine and MedTech. Posted adjusted earnings per share (EPS) of $2.77 on revenue of $21.89 billion.
However, analysts had expected $2.56 and $21.56 billion, respectively, according to estimates compiled by Visible Alpha.
Price Action
Shares of Johnson & Johnson (NYSE: NYSE:JNJ ) were up about 1% immediately following the report, but the uptick was shortlived as the stock is down -0.54% in premarket trading. They entered the day up about 7% since the start of the year.
The company lifted its projected sales range to $91.0 billion to $91.8 billion, up from $89.2 billion to $90.0 billion previously. It also held its adjusted EPS forecast steady at $10.50 to $10.70, "including tariff costs, dilution from the Intra-Cellular Therapies acquisition, and updated foreign exchange."
Since reporting a disappointing 2025 sales outlook in January, the company closed its nearly $15 billion acquisition of Intra-Cellular Therapies and announced plans to lift its U.S. investment to more than $55 billion over the next four years.23
Technical Outlook
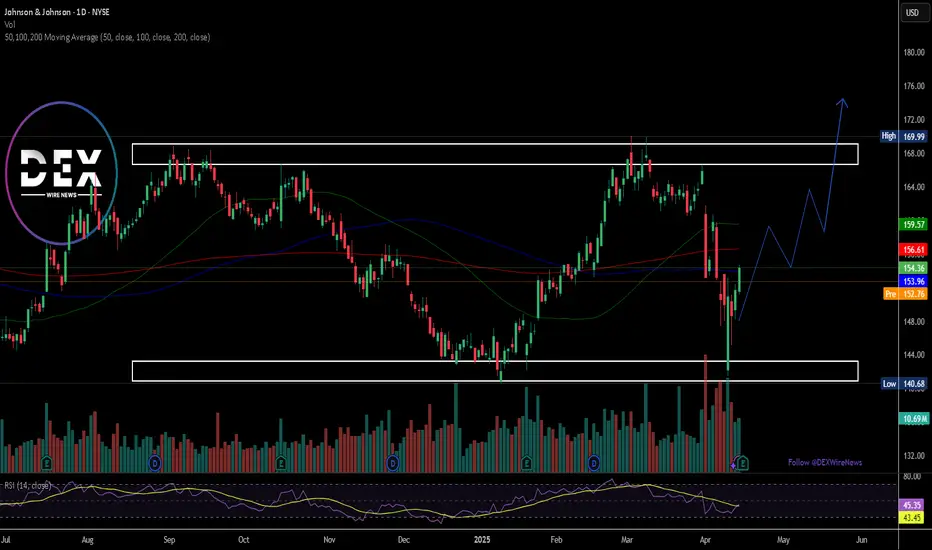
Shares of NYSE:JNJ closed Monday's session up 1.73% and despite the Q1 Earnings beat, the premarket session tells a different story as the asset is down 0.54% in Tuesday's session.
The asset is trading within an enclosed rectangular formation with a perfectly formed support and resistant zones as indicated in the chart. A break above the the key moving averages could cement a bullish breakout that may resort to a break above the $169 resistant point.
With the RSI at 45.35, NYSE:JNJ is well positioned for a bullish campaign once traders digest the earnings news.
Johnson & Johnson (JNJ) Shares Drop Over 7%Johnson & Johnson (JNJ) Shares Drop Over 7%
As the chart shows, Johnson & Johnson (JNJ) shares declined by approximately 7.6%, reaching their lowest level since late February. This marked one of the worst performances in the stock market yesterday.
Why Did JNJ Shares Fall?
Two major bearish factors contributed to the decline:
A Texas judge rejected Johnson & Johnson's third attempt to settle lawsuits related to allegations that its baby powder and other talc-based products harmed consumers.
On Tuesday, Johnson & Johnson announced that its upcoming acquisition of Intra-Cellular Therapies is expected to dilute adjusted earnings per share by approximately $0.25 for the full year 2025. Investors appear to have reacted negatively to this outlook, despite the company’s expectation that the deal will generate around $700 million in additional sales.
Technical Analysis of JNJ Stock Chart
Price movements in 2025 have formed an ascending channel (marked in blue), with indicators highlighting how:
→ The channel’s boundaries have acted as support and resistance levels.
→ The channel’s median line has served as a “magnet” for price action, reflecting the balance between supply and demand.
As JNJ's share price approaches the lower boundary (circled), just above the psychological support level at $150—previously a key level in February—traders have reasons to anticipate that the decline may slow down or even lead to a significant rebound from this support area.
This article represents the opinion of the Companies operating under the FXOpen brand only. It is not to be construed as an offer, solicitation, or recommendation with respect to products and services provided by the Companies operating under the FXOpen brand, nor is it to be considered financial advice.

Cracks Appearing in J&J's Armor?Johnson & Johnson, a long-established leader in the global healthcare sector, confronts substantial challenges that raise significant questions about its future trajectory and stock valuation. Foremost among these is the persistent and massive litigation surrounding its talc-based baby powder. With tens of thousands of lawsuits alleging links to cancer, the company's strategy to manage this liability via bankruptcy has been repeatedly struck down by courts, most recently rejecting a $10 billion settlement proposal. This forces J&J to potentially face over 60,000 individual claims in court, introducing immense financial uncertainty and the prospect of staggering legal costs and damages.
Compounding these concerns is mounting scrutiny over the company's historical and recent marketing practices. A federal judge recently imposed a $1.64 billion penalty against J&J's pharmaceutical arm for misleading marketing of HIV medications, citing a "deliberate and calculated scheme." This follows earlier multi-million dollar settlements related to alleged improper financial inducements paid to surgeons for orthopaedic implants by its DePuy subsidiary, and tax disputes in India over questionable "professional sponsorship" expenses tied to similar activities. These incidents depict recurring legal and ethical entanglements with significant financial penalties and reputational harm.
Taken together, the unresolved talc litigation, substantial financial penalties from marketing violations, and persistent questions regarding ethical conduct create considerable headwinds for Johnson & Johnson. The cumulative impact of ongoing legal battles, potential future liabilities, and damage to its corporate image threatens to drain resources, divert management focus from core operations, and erode investor confidence. These converging factors present tangible risks that could exert significant downward pressure on the company's stock price moving forward.

Johnson&Johnson: Rejected AgainJohnson&Johnson has now been rejected at the $168.75 resistance level for the second time, pulling back more noticeably in response. However, in our primary scenario, we still expect an imminent breakout above this level, which should allow the turquoise wave X to establish its high well above it. Afterward, the turquoise wave Y should drive the stock sharply lower again, as we anticipate the low of the larger green wave in the corresponding long Target Zone between $138.78 and $125.75. That said, reaching this Zone is not a certainty. There remains a 35% chance that the low of the green wave alt. is already settled. Under this alternative scenario, the stock would break through $168.75 without resistance and continue its impulsive move higher.

Johnson & Johnson (JNJ) Posted Q4 Earnings BeatJohnson & Johnson (JNJ) recently reported its fourth-quarter earnings, showcasing a performance that beat analyst expectations with an EPS of $2.04 against a forecast of $1.99 and sales of $22.52 billion, in line with the anticipated $22.45 billion. Despite this positive financial news, J&J's stock took a tumble, closing down 1.9% at $145.27 after issuing guidance for 2025 that fell short of Wall Street's expectations. The company projected sales between $89.2 billion and $90 billion, below the Street's estimate of $91.04 billion, and an adjusted profit per share from $10.50 to $10.70, bracketing the consensus of $10.55.
A Mixed Bag
Innovative Medicines Shine: J&J's innovative medicines segment saw a 4.4% growth, contributing significantly to the quarter's performance. Standout performers included Spravato, which grew by 44% year-over-year, and cancer drugs like Darzalex and Erleada, alongside blood thinners which increased by nearly 30%. However, the looming patent expiration for Stelara, a major immunology drug, casts a shadow over future earnings from this segment.
MedTech Segment Under Pressure: On the downside, medical device sales underperformed, coming in at $8.19 billion against expectations of $8.22 billion. This segment faces challenges, particularly in China, but there's optimism with new investments and product launches like the Ottava surgical robot, which could challenge Intuitive Surgical's market dominance in the future.
External Headwinds: J&J is dealing with several external pressures including foreign exchange issues, which have impacted their sales guidance for 2025. Additionally, potential generic competition and ongoing litigation related to talc products continue to be significant headwinds.
Technical Analysis
Premarket Recovery: Despite the post-earnings drop, NYSE:JNJ shares showed a 0.60% uptick in premarket trading on Thursday, suggesting some investor confidence returning.
RSI and Patterns: The Relative Strength Index (RSI) at 50.48 indicates a moderate condition, neither overbought nor oversold, providing a balanced outlook.
The stock's monthly chart shows a falling wedge pattern, typically a bullish indicator if broken upwards. A breakout above this pattern could signal a bullish campaign for $JNJ. However, there's a risk of further decline if the support at $145 breaks, potentially leading to a dip towards the one-month low of $140.
Moving Averages: NYSE:JNJ currently trades below its 50-day moving average, suggesting short-term bearish sentiment, but a recovery above this average could signal the beginning of a recovery trend.
Forward-Looking Perspective
Despite the immediate challenges, analysts like Edward Jones' John Boylan see J&J's guidance as conservative but achievable, particularly with the company's strategic focus on new product development and pipeline expansion in both pharmaceuticals and medical technology. The emphasis on cancer drugs, robotics, and cardiovascular products is seen as a pathway to long-term growth and margin expansion.
Conclusion
Johnson & Johnson, while grappling with short-term headwinds, holds a portfolio of products with strong growth potential. The technical setup suggests that if JNJ can maintain or surpass current support levels, there's room for optimism. Investors might see this as an opportunity to buy into a dip, given the company's history of innovation and resilience. However, caution is advised due to the external factors and regulatory challenges ahead. The broader narrative for J&J seems to hinge on its ability to innovate and adapt in a rapidly changing healthcare market environment.

Johnson & Johnson Analysis | UpdatedIn this case of Johnson & Johnson (JNJ) stock, it is at a sensitive point where support from a descending channel on the daily chart is being challenged. This level can be a turning point for the stock and if the level holds, then there is a possibility of the stock rising to the $155 – $157 range as shown by the potential target. There are some technical indicators which show that the downtrend is weakening and there is a possibility of the prices turning around in the near future as the MACD depicts a bullish divergence while the RSI shows that the prices are in the oversold region.
Also, volume will be a major tool in determining the validity of the reversal. Thus, if the stock goes up, the volume should increase substantially, which would increase the probability of the stock reaching the channel’s upper edge. From the macroeconomic perspective, the current Fed Funds interest rate and the negative Sharpe Ratio suggest that the market is becoming more cautious, which, however, does not rule out the possibility of the stock movements similar to those of JNJ.
This is a make-or-break time for the asset. If support continues to hold and there are other signs of a reversal such as patterns or higher volumes then JNJ can experience a substantial change in trend.

Johnson & Johnson | Analysis In this case of Johnson & Johnson (JNJ) stock, it is at a sensitive point where support from a descending channel on the daily chart is being challenged. This level can be a turning point for the stock and if the level holds, then there is a possibility of the stock rising to the $155 – $157 range as shown by the potential target. There are some technical indicators which show that the downtrend is weakening and there is a possibility of the prices turning around in the near future as the MACD depicts a bullish divergence while the RSI shows that the prices are in the oversold region.
Also, volume will be a major tool in determining the validity of the reversal. Thus, if the stock goes up, the volume should increase substantially, which would increase the probability of the stock reaching the channel’s upper edge. From the macroeconomic perspective, the current Fed Funds interest rate and the negative Sharpe Ratio suggest that the market is becoming more cautious, which, however, does not rule out the possibility of the stock movements similar to those of JNJ.
This is a make-or-break time for the asset. If support continues to hold and there are other signs of a reversal such as patterns or higher volumes then JNJ can experience a substantial change in trend.

Johnson & Johnson (JNJ) - Approaching the Reversal ZoneIn April, we anticipated a pullback for JNJ, and since then, the stock has dropped approximately 7%, aligning with our expectations. The current trend suggests further downward movement, reinforcing our previous analysis.
We are focusing on the support zone ranging from $134 to $116, with a potential lower bound at $109, the Corona-Low. The ongoing pullback could represent the completion of Wave (4) within this target zone, aligning with multiple levels.
We are going to be monitoring this for signs of a reversal within this zone. This zone will be crucial to confirm the next possible upward movement.

JNJ Johnson & Johnson Options Ahead of EarningsIf you haven`t bought JNJ before the previous earnings:
Then analyzing the options chain and the chart patterns of JNJ Johnson & Johnson prior to the earnings report this week,
I would consider purchasing the 145usd strike price Puts with
an expiration date of 2025-1-17,
for a premium of approximately $7.55.
If these options prove to be profitable prior to the earnings release, I would sell at least half of them.

Johnson & Johnson's Q1 Triumph: Surpassing ExpectationsJohnson & Johnson (NYSE: NYSE:JNJ ) has kicked off 2024 with a resounding victory, showcasing robust first-quarter earnings that outpaced Wall Street estimates and signaling a promising trajectory for the rest of the year.
The pharmaceutical giant reported an impressive adjusted EPS of $2.71, marking a remarkable 12.4% surge compared to the previous year. This stellar performance surpassed analysts' projections of $2.64, underscoring the company's resilience and strategic prowess.
In terms of revenue, Johnson & Johnson ( NYSE:JNJ ) posted sales of $21.38 billion, reflecting a steady 2.3% increase year over year. While this figure nearly mirrored market expectations, the operational growth of 3.9% and adjusted operational growth of 4.0% underscored the company's underlying strength and adaptability in navigating market dynamics.
One of the standout performers in Johnson & Johnson's portfolio was its Innovative Medicine segment, which witnessed robust operational sales growth of 8.3% to reach $13.6 billion. Notably, sales of key drugs such as Stelara and Darzalex demonstrated resilience, with the latter experiencing a notable 19% surge in revenue.
Moreover, the company's medical devices business proved to be a significant driver of growth, generating sales of $7.82 billion during the quarter, marking a commendable 4.5% year-over-year increase. This uptick was fueled by strong performances in electrophysiology products and cardiovascular solutions, showcasing Johnson & Johnson's ( NYSE:JNJ ) diverse revenue streams and market leadership in healthcare innovation.
In a move sure to delight investors, Johnson & Johnson ( NYSE:JNJ ) announced a 4.2% increase in its quarterly dividend, a testament to its commitment to delivering value to shareholders amidst a challenging economic landscape.
Looking ahead, Johnson & Johnson ( NYSE:JNJ ) raised its fiscal year 2024 guidance, projecting operational sales in the range of $88.7 billion to $89.1 billion and adjusted EPS between $10.57 and $10.72. This optimistic outlook, coupled with the company's track record of delivering on its promises, instills confidence in its ability to navigate future opportunities and challenges.
Despite a slight dip in premarket trading following the earnings release, Johnson & Johnson's ( NYSE:JNJ ) strong performance in Q1 sets a solid foundation for continued success, reaffirming its position as a leader in the healthcare industry and a reliable investment choice for shareholders worldwide.

Rallybio's Breakthrough Collaboration Drives $RLYB Stock SurgeRallybio Corporation (Nasdaq: NASDAQ:RLYB ) is hitting the accelerator pedal after announcing a groundbreaking collaboration with Johnson & Johnson to combat fetal and neonatal alloimmune thrombocytopenia (FNAIT).
In a strategic move aimed at advancing therapeutic solutions for pregnant individuals at risk of FNAIT, Rallybio revealed plans for RLYB212, a revolutionary human monoclonal antibody designed to prevent alloimmunization and eliminate the risk of FNAIT in fetuses and newborns.
The partnership with Johnson & Johnson not only includes a significant equity investment but also underscores a joint commitment to tackle this severe and rare disease. Rallybio's CEO, Stephen Uden, expressed enthusiasm about the collaboration, emphasizing its potential to drive awareness, accelerate research, and ultimately, eradicate FNAIT.
RLYB212 stands out as the only investigational therapy targeting pregnant individuals at risk of FNAIT who have not yet alloimmunized. This innovative approach complements Johnson & Johnson's ongoing Phase 3 study of nipocalimab, targeting FcRn, in pregnant individuals already alloimmunized.
Rallybio's natural history study is a crucial step in gathering data to support future registration of RLYB212. The study's focus on a diverse population underscores the company's commitment to inclusivity and comprehensive research.
The collaboration between Rallybio and Johnson & Johnson represents a significant leap forward in addressing FNAIT, offering hope to pregnant individuals and their newborns. As Rallybio continues to drive innovation in therapeutic solutions, investors are optimistic about the company's potential to transform the landscape of rare disease treatment.

J&JOHNSON, Ascending-Triangle-Formation, Completion Incoming!Hello,
Welcome to this analysis about the stock JOHNSON&JOHNSON, looking at the 4-hour timeframe perspectives. In my analysis recently I detected an interesting formational structure with J&J which has the ability to show up a determined breakout. As the corona pandemic moved on there emerged several pharmacy companies wanted to invent the covid-19 vaccines, one of them is J&J, now as these vaccines finally emerged there have been sharp rallies in the other companies already especially when the demand at the beginning of the vaccine launches has risen. Now as the demand keeps increasing and the companies distribute to new markets these demand-runs come in waves, as traders we can catch such opportunities in the market when the fundamental signs also give a positive indication for a rise or a fall in a stock like it is the case with these pharmacy companies in the last months.
From the technical point of view, J&J is building this massive ascending-triangle-formation with the waves A to C already completed. Now J&J is about to form the wave D and this wave D so far has shown up with increased volatility to the upside which is a good sign. Furthermore, J&J managed to bounce in the 200-EMA and the next time we can expect the stock to rightly test the upper-boundary as it is marked in my chart from where the wave E will have its origins, when then the wave E manages to stay in the channel and possibly also bounce in the blue confirmational-bounce-cluster this can lead to the final breakout and completion of the ascending-triangle-formation. In this case it is highly necessary that there do not come any bad news for the vaccine distribution such as a break in the supply chain or something else that can lead to a decline in the stock, when this not happens the breakout is likely to show up after the wave-count completed.
In this manner, thank you for watching my analysis about JOHNSON&JOHNSON with the current fundamental aspect as well as the major triangle-formation forming, will be great when you support it with a like and follow or comment, great contentment for everybody supporting, all the best!
"There are many roads to prosperity, but one must be taken."
Information provided is only educational and should not be used to take action in the markets.

J&JOHNSON, Stronger Than The Rest Market, Possible Bull-Flag!Hello, Traders Investors And Community, welcome to this analysis about the recent events, the current price-structure and what we can expect the next hours and days within J&JOHNSON. As I already mentioned in previous analysis in the current corona-crisis there are gainers and losers who are profiting either out of the crisis or having deficiencies to catch up onto the level seen before the corona-fears hit the markets. Therefore we see a paradigm shift in the global economy similar to these ones we have seen in the past where there have been companies which gone bankrupt due to lack of resilience and others which survived the crisis and exist still today, this was a constant repetition in the financial-crashes we have seen in history and it is repeating itself right now as history does not change at all only marginally when the necessities desire different circumstances. Therefore we have stocks that perform better than the markets, which are the truffles within this situation where we should keep an eye on when considering something on the long side and there are others that cant catch up with the train and consolidating or downshift.
Example Stock: Weaker Than Rest Market: BERKSHIRE (4-Hour Timeframe):
When looking at my chart you can see that J&J is trading above the 800-EMA marked in black which firstly is a strong sign that the stock holds above the EMA, furthermore, we have the 100-EMA which you see marked in green within the structure of my chart which provided a failed bearish-cross, this is a bullish sign indicating that the bulls are stronger than the bears. It is also the major difference to BERKSHIRE where the 100-EMA crossed the 800-EMA to the downside and provided a bearish crossover signal since which the stock didn't take these EMAs out this gives adds a more bullish edge to J&J at the moment which is trading in a possible bull-flag right now which you can see marked in blue.
The next time we can expect the stock to test the support it has remaining in the 138 level and the 800-EMA after forming the wave D of its overall wave count. When this test provides successful and solidity confirms at that level it is within the possible spectrum that J&J moves higher to confirm the huge possible bull-flag in which it is trading at the moment, this scenario will play out when the stock crosses with good volatility and sustainable above the higher boundary of the channel. When the stock provides such a breakout it will move onto its targets within the all-time-high range with a high possibility and even higher after that when there confirm good bullish volatility and no other meaningful bearish signs which alter the situation again.
Taking all these factors into consideration we have a technical basis for J&J to succeed next times although because it is the pharmaceutical company with the biggest market and as I already pointed out in past analysis these are stocks which can provide gains also in the current corona-crisis and show a possible anticyclical movement compared to the average rest market. In comparison with the S&P 500 which is still below its all-time high, we have a stronger picture here at the moment. We will see how this will develop further the next time and if J&J provides to hold this strong environment. Although there can still show new volatility to the downside in the average market due to upcoming corona-restriction this can add to J&J but as it is a possible anticyclical market mover the volatility to the downside can proof not that devastatingly fatal.
In this manner, thank you for watching, support for more market insight, good day, and all the best!
“Learning is an ornament in prosperity, a refuge in adversity, and a provision in modern markets.”
Information provided is only educational and should not be used to take action in the markets.

JNJ BUYHello, according to Johnson & Johnson stock analysis. There is a good opportunity to buy or invest in stocks for the long term. Especially since the arrow came out of the rectangle. It also broke the resistance at 166. An ascending channel started to form, which indicates that the stock is very positive. Good luck everyone

Johnson and Johnson J&J Retest support when last breakout after earning
Good risk and reward
Good entry point to a company that can keep forever
If trading:
SL at pink line
TP 2/3 at blue line and let 1/3 run. Change SL to entry price once hit the blue line tp

KVUE Split-off: A Response to JNJ's Cancer-Related Products?It is plausible to consider that Johnson & Johnson's decision to spin off Kenvue might be linked to an effort to mitigate potential legal liabilities stemming from its talc-based products, which have been implicated in cases of cancer in the US and Canada. This strategic maneuver could potentially offer a layer of legal protection. Shareholders are expected to transition from holding Johnson & Johnson shares to Kenvue shares in the upcoming week. A similar approach was attempted by MMM, although it did not yield successful results, causing a downward trajectory in its stock performance over the past two years.
From my perspective, the true rationale behind the division appears to be related to the numerous instances of individuals developing cancer due to Johnson & Johnson's talc-based products. A recent legal ruling mandated Johnson & Johnson to pay $18.8 million to a California resident who claimed to have contracted cancer from using its baby powder. This decision represents a setback for the company as it seeks resolution for thousands of comparable cases related to its talc-based products within a US bankruptcy court.
Johnson & Johnson recently disclosed detailed information regarding the much-anticipated division of its consumer healthcare venture, Kenvue. This move involves a separation of at least 80.1% of Kenvue shares, facilitated through an exchange offer presented to investors. Within this arrangement, shareholders have the flexibility to trade all, a portion, or none of their Johnson & Johnson shares for Kenvue stock.
The company is extending the choice to its investors, allowing them to opt for an exchange of shares for Kenvue stock. To incentivize this exchange, a 7% discount is being offered on the shares. However, there is an upper threshold of 8.0549 Kenvue shares for each Johnson & Johnson share. If this ceiling is not applicable, shareholders will receive approximately $107.53 worth of Kenvue shares for every $100 worth of Johnson & Johnson stock they intend to exchange. The execution of this exchange offer is anticipated to conclude by mid-August. Notably, this exchange program is voluntary and carries tax-free advantages.
Kenvue has outlined plans to distribute a portion of its available funds to shareholders through dividend payments. The company has recently initiated a quarterly dividend of $0.20 per share (equivalent to $0.80 annually), with the first payout scheduled for early September. This dividend framework translates to a dividend yield of 3.3% based on the prevailing stock price of approximately $24 per share. This yield marginally exceeds Johnson & Johnson's existing dividend yield of 2.8%.
It is likely that a significant portion of individuals holding Johnson & Johnson stock will opt to exchange their shares for Kenvue.
Based on this assessment, I anticipate that Kenvue's stock could potentially reach $30 in the near future.
Looking forward to read your opinion about it!

JNJ Johnson & Johnson Options Ahead of EarningsAnalyzing the options chain of JNJ Johnson & Johnson prior to the earnings report this week,
I would consider purchasing the 160usd strike price Calls with
an expiration date of 2023-9-15,
for a premium of approximately $3.85.
If these options prove to be profitable prior to the earnings release, I would sell at least half of them.
Looking forward to read your opinion about it.

Johnson & Johnson Long risk/reward 1/1.5Perfect bounce on the 100 ma line and 3x top high, we now made it support and it can go back to the top.

JNJ Johnson & Johnson Options Ahead of EarningsAnalyzing the options chain of JNJ Johnson & Johnson prior to the earnings report this week, I would consider purchasing
at the money Calls with a 165usd strike price and an expiration date of 2023-4-21, for a premium of approximately $2.36.
If these options prove to be profitable prior to the earnings release, I would sell at least half of them.
I am interested to hear your thoughts on this strategy.

JNJ | I Love It Here | LONGJohnson & Johnson, together with its subsidiaries, researches, develops, manufactures, and sells various products in the healthcare field worldwide. The company's Consumer Health segment provides skin health/beauty products under the AVEENO, CLEAN & CLEAR, DR. CI:LABO, NEUTROGENA, and OGX brands; baby care products under the JOHNSON'S and AVEENO Baby brands; oral care products under the LISTERINE brand; TYLENOL acetaminophen products; SUDAFED cold, flu, and allergy products; BENADRYL and ZYRTEC allergy products; MOTRIN IB ibuprofen products; NICORETTE smoking cessation products; and PEPCID acid reflux products. This segment also offers STAYFREE and CAREFREE sanitary pads; o.b. tampons; adhesive bandages under the BAND-AID brand; and first aid products under the NEOSPORIN brand. It serves general public, retail outlets, and distributors. The company's Pharmaceutical segment provides products for rheumatoid arthritis, psoriatic arthritis, inflammatory bowel disease, and psoriasis; HIV/AIDS infectious diseases; mood disorders, neurodegenerative disorders, and schizophrenia; prostate cancer, hematologic malignancies, lung cancer, and bladder cancer; thrombosis, diabetes, and macular degeneration; and pulmonary arterial hypertension. This segment serves retailers, wholesalers, distributors, hospitals, and healthcare professionals directly for prescription use. Its MedTech segment offers electrophysiology products to treat cardiovascular diseases; neurovascular care products to treat hemorrhagic and ischemic stroke; orthopaedics products in support of hips, knees, trauma, spine, sports, and other; advanced and general surgery solutions that focus on breast aesthetics, ear, nose, and throat procedures; and contact lenses and ophthalmic technologies related to cataract and laser refractive surgery under the ACUVUE brand. This segment serves wholesalers, hospitals, and retailers. The company was founded in 1886 and is based in New Brunswick, New Jersey.
