JOHNSON & JOHNSON Short-term correction ahead.Johnson & Johnson (JNJ) has been trading within a 5-month Channel Up since the June 20 Low, with the 1D MA50 (red trend-line) in firm Support.
The 4H RSI is printing a peak formation similar to all previous Higher Highs of the pattern. What followed after all those tops were pull-backs just under the 0.382 Fibonacci retracement level but never below the 1D MA50.
As a result, we expect a technical pull-back (Bearish Leg) on this stock to $197.50.
---
** Please LIKE 👍, FOLLOW ✅, SHARE 🙌 and COMMENT ✍ if you enjoy this idea! Also share your ideas and charts in the comments section below! This is best way to keep it relevant, support us, keep the content here free and allow the idea to reach as many people as possible. **
---
💸💸💸💸💸💸
👇 👇 👇 👇 👇 👇
Johnsonandjohnson

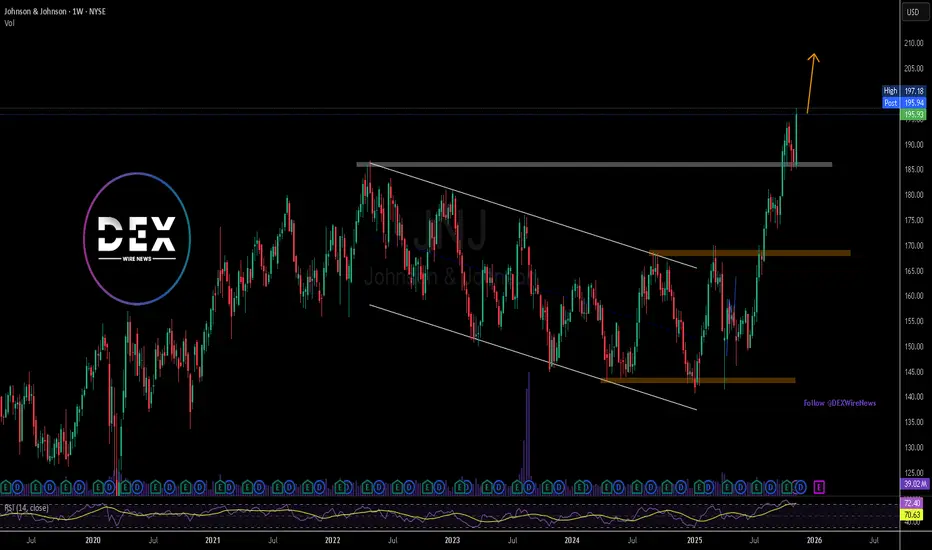
Johnson & Johnson (JNJ) Finds Support at Key Level Johnson & Johnson (JNJ) continues to demonstrate strong defensive positioning and renewed momentum as structural shifts in its business and improving sentiment fuel a breakout from a multiyear downtrend. After the successful separation of its consumer health arm, J&J is now more focused on its pharmaceutical and medical technology segments—two higher-margin businesses with long-term growth drivers tied to immunology, oncology, surgical robotics and med-tech innovation.
Fundamentally, J&J’s pharma portfolio remains robust, supported by key drugs such as Darzalex, Stelara and Tremfya, with new pipeline readouts expected to broaden the company’s long-term revenue base. Meanwhile, the med-tech division continues to recover as global elective procedures normalize, giving J&J steady top-line expansion despite macro uncertainty.
Another important shift is the decreasing overhang from litigation issues—particularly talc claims—which has weighed on the stock for years. As settlements progress and legal clarity improves, investor confidence is returning, contributing to the stock’s recent momentum surge. Additionally, J&J maintains one of the strongest balance sheets in the healthcare sector, with consistent cash flow generation supporting dividends and R&D investment.
Technical Outlook
The chart shows JNJ breaking strongly above a long-term descending channel that has contained price action since 2022. This breakout, accompanied by rising volume, signals a major trend reversal from a multiyear downtrend to a new bullish phase.
Price has also reclaimed a key horizontal level around $185, turning previous resistance into new support. The current momentum suggests JNJ may now target the next major resistance zone near $205–210 phychological high.
The RSI remains elevated but healthy, reflecting strong bullish buying without extreme overextension. As long as JNJ holds above the $185 support region, the bullish structure remains intact.
Overall, Johnson & Johnson approaches 2026 with improving fundamentals, fading legal risks and a clean technical breakout, creating a constructive setup for continued upside.
Johnson & Johnson | JNJ | Long at $146.00Johnson & Johnson NYSE:JNJ is strong (but highly controversial) company with anticipated earnings growth on the horizon. With a P/E of 23x, steady dividend growth record, low debt, and expected increased cashflow, the future is optimistic for NYSE:JNJ if they can stay out of the shady spotlight...
While the historical simple moving average I've selected suggests the stock is entering a downtrend on the daily chart, I'm going to go against this given the current price/position it is in. If the price can hold in $140's and then move up, there could be an early cup formation here. However, if the price drops below $140, that idea is out, and the near-term downtrend may be on. But the company, overall, is a personal buy-and-hold for the long-term ups and downs (unless new news points the company in a different direction). Thus, at $146.00, NYSE:JNJ is in a personal buy-zone.
Target #1 = $157.00
Target #2 = $165.00
Target #3 = $170.00+

JOHNSON & JOHNSON Sell opportunity on a Double Resistance.It's been 9 months (October 11 2024, see chart below) since our last Johnson & Johnson (JNJ) analysis, where we gave a very timely sell signal that surgically hit our $141.00 Target:
The Channel Down has since broke to the upside and a new Higher Lows structure has emerged but with a clear Resistance Zone for the time being. At the same time, the price is also just below the Higher Highs trend-line that started on the September 04 2024 High.
With the 1D RSI overbought (same as on February 25 2025), we don't give the upside much room to go, so we turn bearish here, targeting the 0.382 Fibonacci extension and Higher Lows trend-line at $160.00.
-------------------------------------------------------------------------------
** Please LIKE 👍, FOLLOW ✅, SHARE 🙌 and COMMENT ✍ if you enjoy this idea! Also share your ideas and charts in the comments section below! This is best way to keep it relevant, support us, keep the content here free and allow the idea to reach as many people as possible. **
-------------------------------------------------------------------------------
💸💸💸💸💸💸
👇 👇 👇 👇 👇 👇

JOHNSON AND JOHNSON: Re-accumulation is targeting $175.JNJ is neutral on its 1D technical outlook (RSI = 49.991, MACD = -1.040, ADX = 18.184) as it's only trading around its 1W MA50 but having made an impressive rebound 4 weeks ago inside the Demand Zone. This is the 4th time this Demand Zone provided a rally and the last one even crossed over the 3 year LH trendline that kept the stock on a downtrend since 2022. The breakout confirmed the emergence of a HH trendline which is taking the stock on a new multiyear bullish path. We expect at least one more high on the HH before the end of the year (TP = 175.00).
## If you like our free content follow our profile to get more daily ideas. ##
## Comments and likes are greatly appreciated. ##

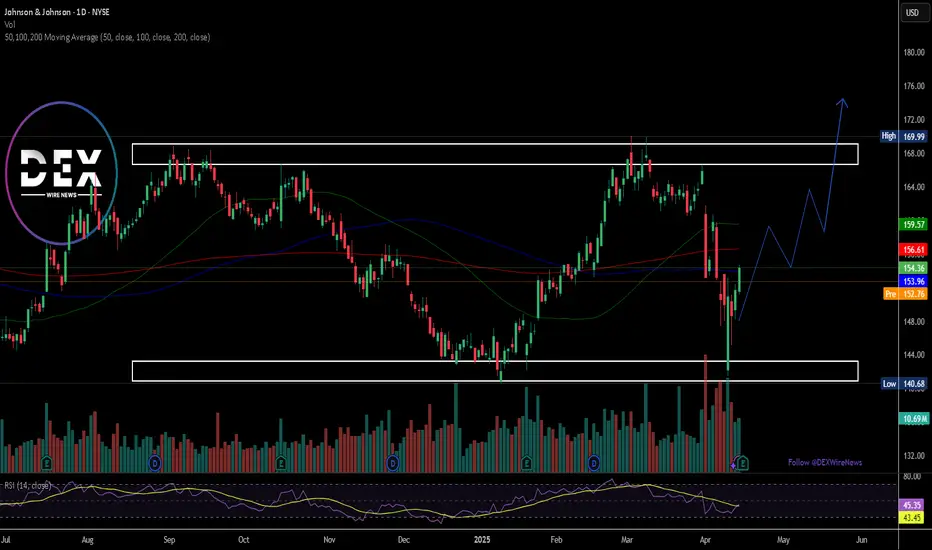
Johnson & Johnson Beats Q1 Estimates, Premarket Not Doing WellJohnson & Johnson (NYSE: NYSE:JNJ ) on Tuesday reported better-than-expected Q1 results and lifted its sales forecast for the full year.
Johnson & Johnson (NYSE: NYSE:JNJ ), together with its subsidiaries, engages in the research and development, manufacture, and sale of various products in the healthcare field worldwide, operating in two segments, Innovative Medicine and MedTech. Posted adjusted earnings per share (EPS) of $2.77 on revenue of $21.89 billion.
However, analysts had expected $2.56 and $21.56 billion, respectively, according to estimates compiled by Visible Alpha.
Price Action
Shares of Johnson & Johnson (NYSE: NYSE:JNJ ) were up about 1% immediately following the report, but the uptick was shortlived as the stock is down -0.54% in premarket trading. They entered the day up about 7% since the start of the year.
The company lifted its projected sales range to $91.0 billion to $91.8 billion, up from $89.2 billion to $90.0 billion previously. It also held its adjusted EPS forecast steady at $10.50 to $10.70, "including tariff costs, dilution from the Intra-Cellular Therapies acquisition, and updated foreign exchange."
Since reporting a disappointing 2025 sales outlook in January, the company closed its nearly $15 billion acquisition of Intra-Cellular Therapies and announced plans to lift its U.S. investment to more than $55 billion over the next four years.23
Technical Outlook
Shares of NYSE:JNJ closed Monday's session up 1.73% and despite the Q1 Earnings beat, the premarket session tells a different story as the asset is down 0.54% in Tuesday's session.
The asset is trading within an enclosed rectangular formation with a perfectly formed support and resistant zones as indicated in the chart. A break above the the key moving averages could cement a bullish breakout that may resort to a break above the $169 resistant point.
With the RSI at 45.35, NYSE:JNJ is well positioned for a bullish campaign once traders digest the earnings news.
Johnson & Johnson (JNJ) Shares Drop Over 7%Johnson & Johnson (JNJ) Shares Drop Over 7%
As the chart shows, Johnson & Johnson (JNJ) shares declined by approximately 7.6%, reaching their lowest level since late February. This marked one of the worst performances in the stock market yesterday.
Why Did JNJ Shares Fall?
Two major bearish factors contributed to the decline:
A Texas judge rejected Johnson & Johnson's third attempt to settle lawsuits related to allegations that its baby powder and other talc-based products harmed consumers.
On Tuesday, Johnson & Johnson announced that its upcoming acquisition of Intra-Cellular Therapies is expected to dilute adjusted earnings per share by approximately $0.25 for the full year 2025. Investors appear to have reacted negatively to this outlook, despite the company’s expectation that the deal will generate around $700 million in additional sales.
Technical Analysis of JNJ Stock Chart
Price movements in 2025 have formed an ascending channel (marked in blue), with indicators highlighting how:
→ The channel’s boundaries have acted as support and resistance levels.
→ The channel’s median line has served as a “magnet” for price action, reflecting the balance between supply and demand.
As JNJ's share price approaches the lower boundary (circled), just above the psychological support level at $150—previously a key level in February—traders have reasons to anticipate that the decline may slow down or even lead to a significant rebound from this support area.
This article represents the opinion of the Companies operating under the FXOpen brand only. It is not to be construed as an offer, solicitation, or recommendation with respect to products and services provided by the Companies operating under the FXOpen brand, nor is it to be considered financial advice.

Johnson&Johnson: Rejected AgainJohnson&Johnson has now been rejected at the $168.75 resistance level for the second time, pulling back more noticeably in response. However, in our primary scenario, we still expect an imminent breakout above this level, which should allow the turquoise wave X to establish its high well above it. Afterward, the turquoise wave Y should drive the stock sharply lower again, as we anticipate the low of the larger green wave in the corresponding long Target Zone between $138.78 and $125.75. That said, reaching this Zone is not a certainty. There remains a 35% chance that the low of the green wave alt. is already settled. Under this alternative scenario, the stock would break through $168.75 without resistance and continue its impulsive move higher.

Johnson & Johnson (JNJ): 2024 Challenges, 2025 OpportunitiesJohnson & Johnson could become one of the standout plays for 2025 if key levels are respected.
A Brief Recap of NYSE:JNJ in 2024
Johnson & Johnson experienced a challenging year. The company finalized the spin-off of its Consumer Health division, sharpening its focus on Pharmaceuticals and MedTech. In April, J&J completed the acquisition of Shockwave Medical for $12.5 billion, strengthening its cardiovascular MedTech portfolio. Financially, the company performed well, surpassing Q3 expectations with $22.5 billion in revenue (+5.2% YoY) and an EPS of $2.42.
Despite the positives, the stock faced significant headwinds, peaking at $170 in August before dropping to $140 by December—a 15% decline over the quarter.
While we briefly considered a potential outperformance in 2024, we refrained from entering a long position, which proved to be the right decision. Looking ahead, 2025 may offer renewed opportunities. For NYSE:JNJ to regain bullish momentum, it must respect the lower edge of the long-standing trend channel established in October 2021. Ideally, we would like to see a fake-out below this channel to trigger a bearish shakeout, followed by a reversal that targets higher levels.
For the longer term, our outlook includes the potential to test the $116–$100 range. However, if our 2025 thesis aligns with technical developments, we will consider adding exposure to $JNJ.

JOHNSON & JOHNSON Excellent confirmed sell signalJohnson & Johnson (JNJ) gave us the most optimal buy entry on our last call (April 17, see chart below) and easily hit our 157.50 Target:
Having been rejected early in September exactly at the top (Lower Highs trend-line) of the 2-year Channel Down and now establishing price action below its 1D MA50 (blue trend-line), this is a confirmed sell signal and the start of the Channel's 5th Bearish Leg. The RSI Lower Highs are common on all previous Channel tops.
Our Target is 141.00, which is on the Internal Lower Lows trend-line (formed by the last 2 Lower Lows) and still above the 1.236 Fibonacci extension.
-------------------------------------------------------------------------------
** Please LIKE 👍, FOLLOW ✅, SHARE 🙌 and COMMENT ✍ if you enjoy this idea! Also share your ideas and charts in the comments section below! This is best way to keep it relevant, support us, keep the content here free and allow the idea to reach as many people as possible. **
-------------------------------------------------------------------------------
💸💸💸💸💸💸
👇 👇 👇 👇 👇 👇

Johnson & Johnson (JNJ) - Approaching the Reversal ZoneIn April, we anticipated a pullback for JNJ, and since then, the stock has dropped approximately 7%, aligning with our expectations. The current trend suggests further downward movement, reinforcing our previous analysis.
We are focusing on the support zone ranging from $134 to $116, with a potential lower bound at $109, the Corona-Low. The ongoing pullback could represent the completion of Wave (4) within this target zone, aligning with multiple levels.
We are going to be monitoring this for signs of a reversal within this zone. This zone will be crucial to confirm the next possible upward movement.

JNJ Johnson & Johnson Options Ahead of EarningsIf you haven`t bought JNJ before the previous earnings:
Then analyzing the options chain and the chart patterns of JNJ Johnson & Johnson prior to the earnings report this week,
I would consider purchasing the 145usd strike price Puts with
an expiration date of 2025-1-17,
for a premium of approximately $7.55.
If these options prove to be profitable prior to the earnings release, I would sell at least half of them.

JOHNSON & JOHNSON Time to start buying.Johnson & Johnson (JNJ) quickly hit the $147.00 Target that we set on our very recent sell call (April 03, see chart below) and is now approaching the bottom of the massive 2-year Channel Down:
Even though based on the very reliable and consistent Sine Waves, the bottom might be a process that can take up to 2-months, the stock is low enough for medium-term investors to start considering adding buys.
On top of that, the 1D RSI is highly oversold below 20.00, the lowest it has been in more than 4 years (since February 28 2020)! As a result and since the Bearish Legs of this Channel Down have ranged within -14.78% and -17.58%, we are turning bullish on this stock, targeting $157.50 (minimum +13.00% rise as with January 22 2024 High).
-------------------------------------------------------------------------------
** Please LIKE 👍, FOLLOW ✅, SHARE 🙌 and COMMENT ✍ if you enjoy this idea! Also share your ideas and charts in the comments section below! This is best way to keep it relevant, support us, keep the content here free and allow the idea to reach as many people as possible. **
-------------------------------------------------------------------------------
💸💸💸💸💸💸
👇 👇 👇 👇 👇 👇

Rallybio's Breakthrough Collaboration Drives $RLYB Stock SurgeRallybio Corporation (Nasdaq: NASDAQ:RLYB ) is hitting the accelerator pedal after announcing a groundbreaking collaboration with Johnson & Johnson to combat fetal and neonatal alloimmune thrombocytopenia (FNAIT).
In a strategic move aimed at advancing therapeutic solutions for pregnant individuals at risk of FNAIT, Rallybio revealed plans for RLYB212, a revolutionary human monoclonal antibody designed to prevent alloimmunization and eliminate the risk of FNAIT in fetuses and newborns.
The partnership with Johnson & Johnson not only includes a significant equity investment but also underscores a joint commitment to tackle this severe and rare disease. Rallybio's CEO, Stephen Uden, expressed enthusiasm about the collaboration, emphasizing its potential to drive awareness, accelerate research, and ultimately, eradicate FNAIT.
RLYB212 stands out as the only investigational therapy targeting pregnant individuals at risk of FNAIT who have not yet alloimmunized. This innovative approach complements Johnson & Johnson's ongoing Phase 3 study of nipocalimab, targeting FcRn, in pregnant individuals already alloimmunized.
Rallybio's natural history study is a crucial step in gathering data to support future registration of RLYB212. The study's focus on a diverse population underscores the company's commitment to inclusivity and comprehensive research.
The collaboration between Rallybio and Johnson & Johnson represents a significant leap forward in addressing FNAIT, offering hope to pregnant individuals and their newborns. As Rallybio continues to drive innovation in therapeutic solutions, investors are optimistic about the company's potential to transform the landscape of rare disease treatment.

JNJ has bottomed and can rise by +50%Johnson & Johnson gives a very clear idea of its trend on the 1M timeframe. The price may be under the 1D MA50 but has reached the bottom of the multi year Channel Up that started at the bottom of the 2008-2009 crisis. Being neutral on the 1M technical outlook (RSI = 45.714, MACD = -1.180, ADX = 20.525) has historically been one of the best buy opportunities, in fact the stock has grown by at least +53.04% three time during that time span. We shouldn't also ignore the fact that the 1M MA100 is still holding and has been doing so since June 2012. We are aiming long term for at least +53.04% again (TP = 220.00).
## If you like our free content follow our profile to get more daily ideas. ##
## Comments and likes are greatly appreciated. ##

JOHNSON & JOHNSON More pain along the way. SELL.Johnson & Johnson (JNJ) got rejected on its 1D MA200 (orange trend-line) - 1D MA50 (blue trend-line) Resistance Zone. It has been practically trading sideways since the start of the year and based on the Sine Waves, that priced the new Top (Lower Highs trend-line) of the 2-year Channel Down pattern.
The expected completion of a Bearish Cross this week on the 1W RSI, will confirm the Sell Signal, as all 3 previous Bearish Cross sequences were forme just after a Top. Though their declines ranged from -17.58% to -14.78%, we will use the October 10 2022 Low as an example and target the 0.9 Fibonacci retracement level at 147.00 as since the Bullish Leg was limited, we expect an equally less aggressive Bearish Leg towards the bottom of the Sine Waves.
-------------------------------------------------------------------------------
** Please LIKE 👍, FOLLOW ✅, SHARE 🙌 and COMMENT ✍ if you enjoy this idea! Also share your ideas and charts in the comments section below! This is best way to keep it relevant, support us, keep the content here free and allow the idea to reach as many people as possible. **
-------------------------------------------------------------------------------
💸💸💸💸💸💸
👇 👇 👇 👇 👇 👇

Pharmaceutical Giants Stocks: Macro Fib SchematicsThe biggest pharma giants are easy to recognize. Johnson and Johnson, Pfizer, Moderna, Merck & Co, Danaher Corp, Thermo Fisher Scientific. All medications and pharmaceutical drugs come out of these drug corporations. Lab equipment, medical research, vaccines, and other life science developments come out of these conglomerate pharma giants.
Support and Resistance is clear with these schematics. All clusters are laid over appropriately.

JOHNSON & JOHNSON Double buy entry.JNJ touched Support (1) at 153.20, a level holding since June 1st.
Along with Support (2) at 150.10 are the major buy levels for the long term.
The medium term Resistance is the MA200 (1d).
Trading Plan:
1. Buy on the current market price.
2. If Support (1) breaks, buy on Support (2).
Targets:
1. 162.00 (expected contact point with the MA200 (1d)).
2. 161.00 (expected contact point with the MA200 (1d)).
Tips:
1. The RSI (1d) shows that the stock price in the past 12 months bottoms a little after the RSI forms a Double Bottom. It makes a slightly lower low. Be on the look out for one.
Please like, follow and comment!!

KVUE Split-off: A Response to JNJ's Cancer-Related Products?It is plausible to consider that Johnson & Johnson's decision to spin off Kenvue might be linked to an effort to mitigate potential legal liabilities stemming from its talc-based products, which have been implicated in cases of cancer in the US and Canada. This strategic maneuver could potentially offer a layer of legal protection. Shareholders are expected to transition from holding Johnson & Johnson shares to Kenvue shares in the upcoming week. A similar approach was attempted by MMM, although it did not yield successful results, causing a downward trajectory in its stock performance over the past two years.
From my perspective, the true rationale behind the division appears to be related to the numerous instances of individuals developing cancer due to Johnson & Johnson's talc-based products. A recent legal ruling mandated Johnson & Johnson to pay $18.8 million to a California resident who claimed to have contracted cancer from using its baby powder. This decision represents a setback for the company as it seeks resolution for thousands of comparable cases related to its talc-based products within a US bankruptcy court.
Johnson & Johnson recently disclosed detailed information regarding the much-anticipated division of its consumer healthcare venture, Kenvue. This move involves a separation of at least 80.1% of Kenvue shares, facilitated through an exchange offer presented to investors. Within this arrangement, shareholders have the flexibility to trade all, a portion, or none of their Johnson & Johnson shares for Kenvue stock.
The company is extending the choice to its investors, allowing them to opt for an exchange of shares for Kenvue stock. To incentivize this exchange, a 7% discount is being offered on the shares. However, there is an upper threshold of 8.0549 Kenvue shares for each Johnson & Johnson share. If this ceiling is not applicable, shareholders will receive approximately $107.53 worth of Kenvue shares for every $100 worth of Johnson & Johnson stock they intend to exchange. The execution of this exchange offer is anticipated to conclude by mid-August. Notably, this exchange program is voluntary and carries tax-free advantages.
Kenvue has outlined plans to distribute a portion of its available funds to shareholders through dividend payments. The company has recently initiated a quarterly dividend of $0.20 per share (equivalent to $0.80 annually), with the first payout scheduled for early September. This dividend framework translates to a dividend yield of 3.3% based on the prevailing stock price of approximately $24 per share. This yield marginally exceeds Johnson & Johnson's existing dividend yield of 2.8%.
It is likely that a significant portion of individuals holding Johnson & Johnson stock will opt to exchange their shares for Kenvue.
Based on this assessment, I anticipate that Kenvue's stock could potentially reach $30 in the near future.
Looking forward to read your opinion about it!

JNJ Johnson & Johnson Options Ahead of EarningsAnalyzing the options chain of JNJ Johnson & Johnson prior to the earnings report this week,
I would consider purchasing the 160usd strike price Calls with
an expiration date of 2023-9-15,
for a premium of approximately $3.85.
If these options prove to be profitable prior to the earnings release, I would sell at least half of them.
Looking forward to read your opinion about it.

JOHNSON & JOHNSON Buy opportunity.Johnson & Johnson is trading inside an Ascending Triangle pattern with the 1D technicals neutral (RSI = 49.652, MACD = -0.360, ADX = 36.021). The 1D MACD is close to making a Buy Cross so today's cross over the 1D MA50 is a first buy signal, that targets the 1D MA200 (TP = 165.00).
If the price crosses over the R1 (167.25) we will buy again targeting the R2 (TP = 181.15), which is exactly on the 2.0 Fibonacci extension level.
## If you like our free content follow our profile to get more daily ideas. ##
## Comments and likes are greatly appreciated. ##

Johnson & Johnson Long risk/reward 1/1.5Perfect bounce on the 100 ma line and 3x top high, we now made it support and it can go back to the top.

JNJ Johnson & Johnson Options Ahead of EarningsAnalyzing the options chain of JNJ Johnson & Johnson prior to the earnings report this week, I would consider purchasing
at the money Calls with a 165usd strike price and an expiration date of 2023-4-21, for a premium of approximately $2.36.
If these options prove to be profitable prior to the earnings release, I would sell at least half of them.
I am interested to hear your thoughts on this strategy.
