Possible head and shoulders on the DJI Possible head and shoulders on the DJI, opening the oppertunity for a bullish upswing on a small time frame. In the big picture things still seem bearish, keeping in mind the recent interest rate spikes by the FED and the ongoing tradewar with China.
Jones

#DJI index still hitting downa YO-YO week for the market!
still #Dow_Jones Industrial Average #DJI hitting down, toward 23575/23510 zone!

Dow Jones Industrial Average (DJI) Price Prediction for 10/25/18I am predicting it will either go up or down by the date shown. I am more 90% confident that it will go upwards, but I included the decrease path just incase.
The indicators I used were:
1) Gann
2) Ichimoku
3) Lunar Cycles
4) Elliot Waves
5) Fibonacci

Thinking Fast and Slow: A Case for Dow Jones Industrial Index Hello traders.
Here my case for slow and fast moving trendlines.
Following a major drop the past few days on DJI we are looking at a very volatile market indeed.
I am not going to elaborate on why this happened and make sense of the 2000 point drop you can read all that on WSJ
Our job as traders is to find a direction that is consistent with our technical analysis and not speculate around causes and effects.
My approach is based around trend lines and act on projections around said trendlines highlighted as yellow arrows.
Position your trades accordingly.
Trade Safe, Trade Well

DOW JONES: DON'T PANIC!The week before last gave us a shooting star/doji. The following week resulted in a pull-back that has everyone scared.
For now, we held lower parallel support. However, I'm leaning on the prospect of more downside for now.
The markets are telling us something: there is clear concern over the mid-term elections. If Democrats win, I'm sure that would pour water on stock market fundamentals. The Democrats seem to be in a state of emotional meltdown. Any Democratic victory may render the United States uninvestable. As the crown jewel of American industry, the Dow Jones may enter a serious bear market.
However, I do not foresee that happening. I foresee a Trump victory - not only in the mid-terms, but for 2020.
So, stay with the trend. There will be an amazing buying opportunity soon. Should last week's low give way, it opens up the possibility of falling to the year's lows. Even better: we take out the February low WITHOUT closing below it, on a weekly or monthly basis, creating a severe snap-back rally. THAT would be an incredible trade.
I am bullish the Dow Jones long term. I am bullish the Dow Jones in the medium term. But bullishness must be fueled buy the consensus being on the wrong side. We MUST create the conditions that prompt the majority to believe that stocks will go down, in order to go up.
This could be a period of sideways consolidation, in a large range. Or it could mean a spike down that 'washes' everyone out, catching them flat-footed.
Such a move is possible. Was last week the spike? For now, I think not, as I believe the markets are awaiting confirmation in US politics in November.
I await a signal to enter a full position long. As long as we remain below the 25760 area (prior support turned resistance) on a closing basis, I will be taking short scalps, ready to roll into a long.

Dow Jones short approach #2My previous analysis aged well, as expected, we bounced for a pullback in the 25000's, I'm searching for an entry in zone 1 and 2, tiny stop loss because risky move, for big r/r. If the sell off continues , a very good TP would be around 24050-24100. What are your thoughts ?

11.1/1 R/r | The Big Short | 1D Bear Div | Evening Star doji 1DThe recent hike of the fed rates will eventually result in a large number of defaults which will cause for a collapse/ pullback / correction / whatever you want to call it.
1D Bear Price action & Bear div
Unsustainable parabolic uptrend
The band has stopped playing. Pull the plug
Get out of US Equities and hedge with BTC,
after all that's what it's made for.
Close short - 20201
Stop loss: 1.83%
Entry: 26 656
Risk/Reward ratio: 11
Happy trading

Dow Jones short entry ?Today DJIA made a new ATH, breaking the previews resistance but failed to stay above for now. Multiples bearish divergences, as you can see the last time we saw a divergence like this it was follow by a correction, the economics context isn't very good, and October isn't a good period in markets. So I think we could see an other correction in coming days. What are your thoughts ? Do you think DJIA is gonna make another ATH soon ? The only thing making me think the Dow can pursue his ride is that only two companies aren't performing GE and IBM, but I think 2/3 are overvalued.

Dow Jones short approach Bearish divergence on the dow jones. That's how I'm gonna play it what are your thoughts?

Short Apple - Short US MarketI continue to say that the bull run in Apple will soon be finished. The divergence between the rising stock and the down trend in RSI is visible. The problem is that in Nasdaq and Dow Jones you can see the same thing. The economical cycle is almost finished. You can look at the indicators. They are all slowing:
United States ISM Purchasing Managers Index (PMI) - July: 58.1 - Estimate 59.5
United States ISM Non Manufacturing PMI - July: 55.7 - Estimate 58.6
United States Building Permits -July: 1.311 - Estimate 1.4
United States Consumer Sentiment - August: 95.3 - Estimate 98
United States New Home Sales -July: 627 - Estimate: 645
United States Existing Home Sales -July: 5.34 - Estimate 5.4
United States Durable Goods Orders - July: -1.7% - Estimate -0.5%
My view is that september will be a very big stress test for the US Market. The graphic of the Dow Jones index is very similar to the one in 1929...even the market sentiment is the same
China - US trade war, Trump's impeachment, inflation rising, FED's rising rates, North Korea etc --- anything can go wrong...and from that point, the market will start fearing and puking

DOW JONES INDUSTRIALS 30_Daily map_possible shortI think about possible short momentum after the Kumo breakout
DOW JONES - Bearish EWs count on 15 min and reduced liquidity.DOW JONES - Bearish EWs count on 15 min. selloff driven by the news on Cohen and Manafort - we may have seen a new source of volatility entering the US stock markets.
Global liquidity is shrinking and US market liquidity is being reduced by the Fed's rate hike and QT program.

DOW JONES / Crash / Pattern Gartley // Make Money /Dow Jones forming ideal Gartley pattern. in which case it extends to 0.88% in fibonnaci to form gartley Negotiable,
the collapse at any moment happens ... that's where we enter
to make money
What do you think?

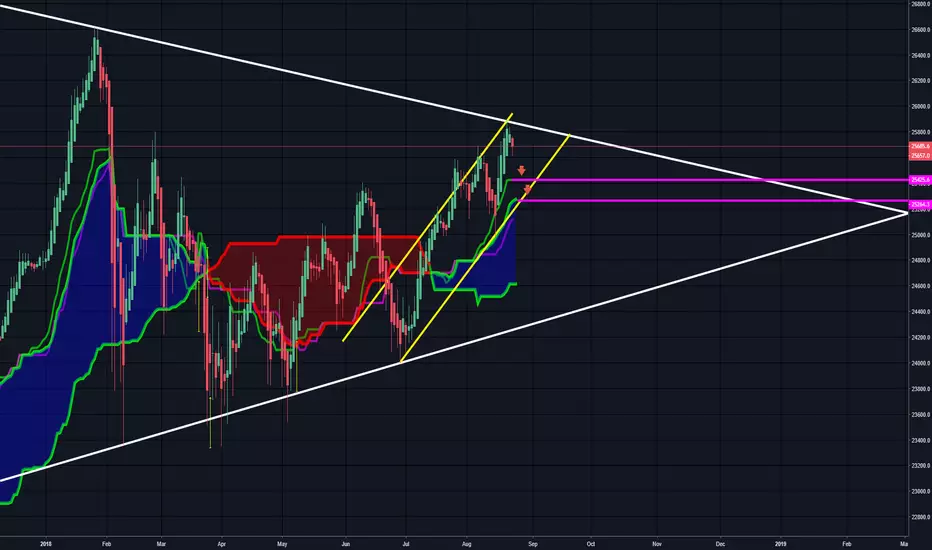
Dow Jones: WARNING PART IIIn my previous post, I was short the DJIA, with the expectation of adding at down trending resistance. I did add, but was quickly stopped out.
Now price has broken ABOVE the resistance line, and I'm forced into a neutral position. This means I have no conviction either way, and any trades I take will be 1/3 of my full size.
I do not want to be one of these traders who perpetually tries to short US equities - which is exactly what has fueled the most hated rally in history. Yet, I maintain that this could be a FALSE BREAKOUT, and that significant downside remains a possibility. For that to happen, price would need to quickly reverse, fall back under the top side of the multi-month triangle, and stay below there.
Another possibility is that we see a choppy consolidation at these levels over the next few months, before simply rocketing higher. For the bullish case to be confirmed, I would still need to see a closing above the 25800 level to indicate strength.
For now I'm neutral, with a slight bearish leaning. My bearishness is colored by the action in S&P and the Nasdaq - updates coming soon.
I will take a small short position on a Monday rally, with a stop above last week's high. If price moves higher next week, I will wait for a clear pattern to emerge before acting.

Same big DJ - different direction...WAIT for confirmation ...and sell... 24950+- would be cool... Will keep it updated... :)

Russell 2000 US Equities' Upside Leading Indicator says GO 7-3*I tried to draw trendlines on all the comparison symbols but TradingView just isn't having it. Sorry!*
Hello Friends, the Russell 2000 has begun a new uptrend after breaking its previous trend line and making a higher low and higher high. The rest of the US indices are in consolidation. If recent history is a guide, the Nasdaq, which may or may not be breaking out of the diamond formation it has constructed, should be the second mover. The S&P should follow and finally the Dow. Notice the Dow seems to be the leading decline indicator. Of the 4 I would personally rather trade the Russell or Nasdaq, after all, buy strength, sell weakness.
This 3rd is a holiday trading period. Furthermore, I do not know what affects the tariffs coming online Friday will have, but one would think this is priced in by now, although trade is obviously the story that has been roiling the markets. However, it appears to me things have gotten to the point where the market wants to climb and it is going to do so trade concerns regardless...probably as a result of the money flowing in every month? due to retirement investments and institutions. Anyway, prudence may decide waiting until after the fourth...but then once could say the same thing about the tariffs etc. When does it stop? The decisions we must make.

Dow Jones potential bearishness in store.After the first correction price been recovering nicely and you could easily plot the trajectory, but recently its kind of broken the trajectory and may lose steam completely essentially forming a head and shoulders.

DOW JONES DOWNTREND FROM 24900 TILL 23300 BEFORE END OF JUNEMUST SELL NOW >>>>>>>>>>>>>>>>> DOW JONES FROM 24900 TILL 23300 BEFORE THE END OF THESE MONTH

DOW JONES - Trading update 11th of JunePotential bearish outlook for the US30.
Momentum slowing down, resistance at 25500.
On the other hand, price strongly respected the 25000 mark, so let's see if that holds.

Dow Jones Bull Flag?Here we have a potential bull flag forming on the DOW . Something to watch... Market was pretty strong this week.

Dow Jones might be getting overboughtStrong 25000 barrier with early signs of momentum slowing down towards that level.
Bear move expected soon. I'll keep this updated.

Nasdaq IXIC - Finding the 9 year cycleMarkets are more predictable than we have been led to believe. Here we are going to examine the 9 year cycles found in the Nasdaq composite.
This is a follow-up idea from my previous idea which was Lesson one in Market Cycles in the DOW JONES INDUSTRIAL AVERAGE. Please follow that link for a more detailed explanation on this.
In the Nasdaq we can see an (approx) 9 year half cycle which is very consistent. It actually is closer to approx 9 year 3 months. But you should know that the time between each line is EXACTLY the same. In the method I use, I use the fib time zone tool to create lines which all have the EXACT amount of time between each line.
As I said in my previous idea, there are multiple cycles on different time frames and different frequencies all occurring simultaneously. If we only focus on one particular cycle, we will not have enough information to know how to trade. But when we calculate the net effect of several cycles, we will have a much better idea and information for FUTURE predictions. Please read my previous idea for more info on that.
In addition to the 17 year Secular bull and Secular bear markets, we can see this 9 year (approx) cycle which also is present in DJIA.
The green line represents the LOW Point or trough of the cycle and the RED line represents the PEAK of the cycle. The GREEN ZONE starts at the GREEN LINE and goes to the RED LINE. The RED ZONE starts and the RED LINE and goes to the GREEN LINE. Remember that a GREEN ZONE will have stronger GROWTH - GREEN = GROWTH and RED = REST. But the 9 year cycle and 17 cycles are not the only cycles occurring. There are others. So the individual cycle will not explain all of the movements int he chart.
Can you see how near the end of the GREEN ZONE (before the red line) the growth gets stronger? And near the end of the RED ZONE, it gets weaker. Imagine this a cycle of fluctuating energy -- the green is a positive energy and the red is a negative energy. The energy is highest as we reach the end of the GREEN ZONE, and energy is lowest when we reach the end of the RED ZONE.
We will also explore other cycles and other charts soon. I will soon make a chart where I will show both the 17 year cycle and 9 year cycle on the SAME CHART. There you will see how when both cycles are GREEN the growth gets much stronger. Please STAY TUNED for more IDEAS.
I also will be analyzing BITCOIN using the same method. You may save my profile so you can see more ideas as I post them.
Please feel free to give your comments and click like if you like the idea.

DJIA Dow Jones - Market Cycles LESSON TWO - Studying 2 cyclesLesson Two
The market is more predictable that we have been led to believe.
We will now study the effects of both the 17 year half-cycle and the 9 year half-cycle which are occurring at the same time.
There are many other cycles or sine-waves occurring in DJIA and in other markets as well, but for now we will just focus on these two cycles.
Please see the Lesson One link below for an introduction to how market cycles work.
As I said in the other ideas, the Green line occurs at the trough (low-point) of the cycle and the Red Line occurs at the peak of the cycle. The GREEN ZONE is the period starting at the GREEN LINE to the red line. The RED ZONE starts at the RED LINE and goes to the GREEN LiNE. Growth is strongest in the GREEN ZONE, especially at the end of the green zone. Growth is weakest during the RED ZONE, especially at the end of the RED ZONE.
With TWO CYCLES, there are Green zones and Red Zones. When it is a time period where both cycles are GREEN ZONES, GROWTH is the strongest. When one is red and one is Green, the forces counteract each other. When both zones are RED, growth is the weakest and corrections are stronger.
All of the cycles are still part of a very long term growing economic cycle. It's hard to calculate when this long-term cycle began due to lack of data in the 1700s and 1800s. So due to that, it is hard to know when this long-term cycle will end. But this long-term growth cycle is what keeps the markets overall moving up, despite various corrections.
In this chart the SOLID GREEN Lines are the green lines from the 17 year cycle. The 17 year cycle is stronger, but it takes longer to complete. The DOTTED Lines are the 9 year (approx) cycle which I showed you on the Nasdaq. This 9 year cycle also fits the DOW, I suppose because they are both US Stock market indexes.
You can see how these cycles interact with each other. Growth is stronger when both cycles are green. The DOT.COM Bubble burst after both the 17 year GREEN cycle and the 9 Year Green cycle ended around the same time. They both went into a RED cycle until 2009 where the 9 year cycle became GREEN. The 17 year cycle did not become green until 2016, and afterwards the market growth really picked up. Now we are approaching the end of the GREEN 9 year cycle which ends around November 2018. Stay with my ideas and will will try to calculate shorter cycles to determine where the current market peak is going to end.
I think it points to a recession coming, maybe 2019. But due to the 17 year green cycle, it probably won't be end-of-the-world type market crashes. The 9 year cycle will be red until 2028 where it turns green. The 17 year cycle is green until 2033. There is still the possibility of doing something like the predepression bubble after 2028 when both cycles are green at the same time. Even if not like that, it is likely to have a bubble of some sort after 2028 due to both cycles being green.
Please click like if like the idea. Give comments or questions for clarifications how two cycles interact together. I hope I have explained this well enough.
Stay tuned, we will try to focus on a closer cycle to see if we can get a more accurate time period for a market top in 2018.
