JP Morgan $JPM$JPM is still in bearish channel even though it is just above the 50SMA which is good sign for future trend. I would expect to hold above $115 before get in.
12 months Consensus Price Target: $111.99
if you find my charts useful, please leave me "like" or "comment".
Please don't trade according to the ideas, rely on your own knowledge.
Thx
Jpmorganchase

jpmjuyl 10: first day value higher
is it real buyer or just short
covering.
Any offer below 95.15 could
lead lower as it could just
be short covering from the 107.33 area.

JPM Heavily Oversold on the 1H, Breaking Fibonacci Levels $JPM The hourly chart on JPM suggests heavily oversold conditions. The price recently crossed the lower Bollinger band (with Standard Deviation set at 2.5), and RSI(14) is below 30 (closer to 25). Moreover, the price has retraced and broke through the 0.5 Fibonacci line around 99. Next Fibonacci support level is at 95. I already bought at the 0.5 level (at 99). If you also bought I recommend hold, but if you did not buy watch price action in the coming days, a nice entry level might be closer to 95.

Will JPMORGAN continue climbing to historical summit?The movement of stocks is known in the past days, a strong movement in all sectors, even the financial sector knows a strong movement and among them the JPMORGAN CHASE & CO after the stock bounced from a weekly trend
The stock formed a classic triangular, and it was able to penetrate it with a respectable volume, and with a price gap.
The stock will currently try to descend towards the upper side of the triangle to retest at 105, which is a good opportunity to buy by targeting the top at 135.

#Daily: JPM gonna riseJPMorgan Chase & Co. CEO Jamie Dimon spoke during the Deutsche Bank Global Financial Services Conference Tuesday and argued the bank's stock is "very valuable" at current levels.
The price broke the $99,45 level. Long on retest of $99,45 or $103,11. Targets: $112,63, $125,73.
Earlier: Trump and SP500

CLEAR ascending support on JPM - and we are lazy at it right nowAscending support on JPM - some will also identify the pivot highs calling for a triangle pattern.
Keep an eye on this support level if the market gets weaker - looking for things that were already lazy when the market was strong... looking for those to then get even weaker when the market gets weak... this is a good way to find intraday setups!
Hope this chart perspective helps the community
xeenos trading - sending positive energy to all those watching.


WOW - Remembering all Mr. PresidentsLmao, I did not remember this. It's from long time ago trying to understand a little bit more this bank. Maybe is something irrelevant but it could be helpful to feed the curiosity some people still have and expand their knowledge with a better research. Also if i lose this idea again for some months I'll know where to find it now.
There I tried to find correlation between democrat presidents or republican and the action price development from that far, just for educational purposes like I said. Just to be able to dig a bit more and find political causes related to the historical growing of one of the biggest banks on Earth.
I found this when I was checking other "too big to fail" banks recent movements, to check the impact with all this infinite stimulus have been announced almost everywhere, and anyone with sufficient authority is printing money now. What a mess, isn't it?
Please hope you find your own conclusions from here, always keep that curiosity... and doubt.
Thanks!

JP Morgan AnalysisShort on JPM, still practicing fib spirals, may be for awhile, enjoying them. hope you guys enjoy..
Bullish 'Fib' wave in green, bearish in yellow
Top to bottom for bullish waves
Bottom to top for bearish waves ~Spirals

JMP technicaly based forecast
📌Short intro:
I am full time trader - analyst * High accuracy of ideas * Technicaly and Fudnamentaly side in analysis * Comment if have any questions or want to send support * Price action - FIBO - Candl pattern * FX - STOCK - CRYPTO * Simple ideas
💡 JPM technicaly based idea, technicaly indicators showing we can expect higher recovery phase, global economy is in slow phase of recovery, we can see price is near to break FIBO 0.382 in this case FIBO 0.382 is and support zone, expecting to see break ad higher push in price till FIBO 0.6 or till trend line.
📌Have on mind, trading involves risk, check idea on your own tactic, if have questions pls comment!
Thanks on supporting!
All best, good luck!


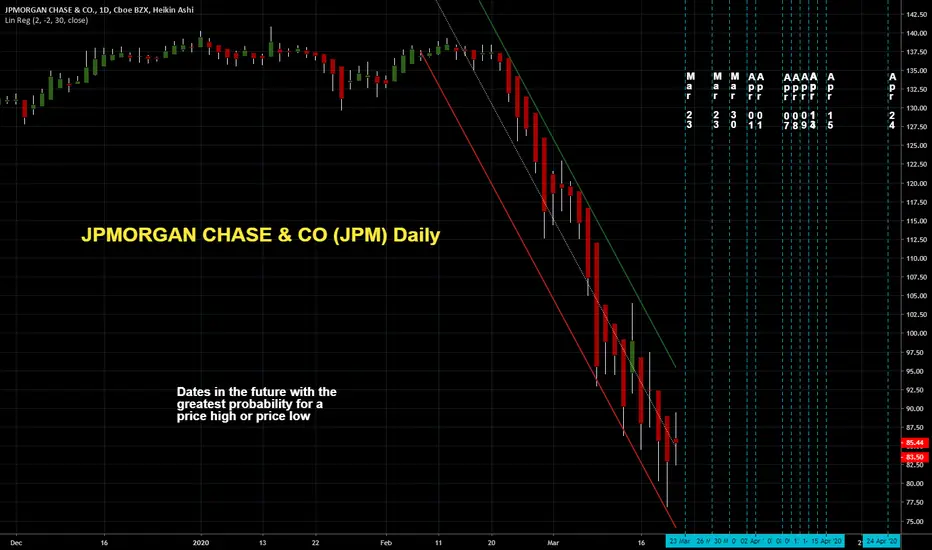
JPMORGAN CHASE & CO (JPM) DailyDates in the future with the greatest probability for a price high or price low
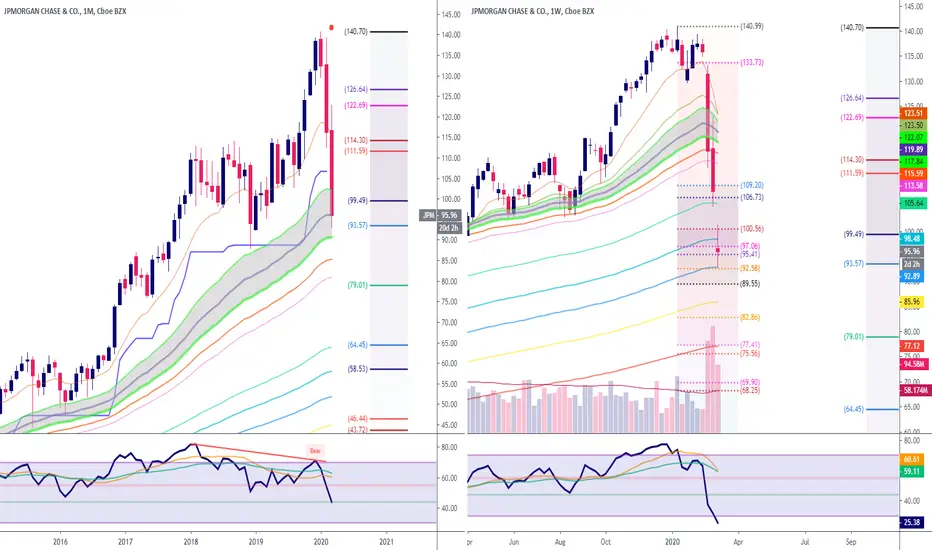
JPMorgan / testing Monthly EMA50.If you are a long-term investor, I would wait
JPMorgan Chase & Co.testing Monthly EMA50.
38.2% correction since 2009 low.
RSI monthly 44-
RSI weekly oversold 25, but no divergence.
Too risky to short, to early for long-term buying.
Long-term stock investors still shouldn’t buy the dip, but it’s an opportunity-filled environment for pro traders.
If you are a long-term investor, I would wait........
Disclaimer:
We are not registered or licensed in any jurisdiction whatsoever to provide investing advice or anything of an advisory or consultancy nature,
and are therefore are unqualified to give investment recommendations.
Always do your own research and consult with a licensed investment professional before investing.
This communication is never to be used as the basis of making investment decisions, and it is for entertainment purposes only.
JPM Bearish Exaggerated DivergenceAn exaggerated bearish divergence occurs when price forms a clear top, while the technical indicator (in this case RSI) diverges and forms a lower high.

JPM Dark Pool Quiet DistributionJPM has been running well over the past quarter. However, as the fractional and odd lot new investors buy, the giant Buy Side Institutions are selling. The white candlesticks over the past few days reveal just how heavy the Dark Pool large lot selling is, as the gains are below the previous highs. The risk is that the new investors may run out of capital, which could create a sell down at least temporarily.


JPM Bump and RunJPM has had several bump and runs throughout the course of its upward trendline, this pattern may continue with the formation of a new bump. A clear Adam & Adam double bottom can also be seen. Overall a strong investment purely based on chart patterns.


ANALYSIS OF JP MORGAN 20.11.2019The price above 200 MA, indicating a growing trend.
The MACD histogram is above the zero lines.
The oscillator Force Index is above the zero lines.
If the level of resistance is broken, you should follow the recommendations below:
• Timeframe: H4
• Recommendation: Long Position
• Entry Level: Long Position 131.10
• Take Profit Level: 132.50 (140 pips)
If the price rebound from resistance level, you should follow the recommendations below:
• Timeframe: H4
• Recommendation: Short Position
• Entry Level: Short Position 130.00
• Take Profit Level: 129.50 (50 pips)
USDJPY
A possible short position in the breakdown of the level 108.30
GOLD
A possible long position at the breakout of the level 1479.00
USDCHF
A possible long position at the breakout of the level 0.9920
GBPUSD
A possible long position at the breakout of the level 1.2990
WHY TRADE WITH PAXFOREX?
We are one of the fastest growing Forex Brokers in the Market. Trade with PaxForex to get the full Forex Trading experience which is based on...
Top Effective Educational Tools For All Types Of Traders
The Reliability in all assets in the market
Live Multi-language Online Support 24/5

JPMORGAN Daily Chart Short After AB=CDJPMORGAN price break few trendlines and now end AB=CD
Price can easily go down to retest trendline breakout and clear the CD leg.

Analysis of JP MORGAN 18.10.2019The price above 200 MA, indicating a growing trend.
The MACD histogram is above the zero lines.
The oscillator Force Index is above the zero lines.
If the level of resistance is broken, you should follow the recommendations below:
• Timeframe: H4
• Recommendation: Long Position
• Entry Level: Long Position 121.40
• Take Profit Level: 123.00 (160 pips)
If the price rebound from resistance level, you should follow the recommendations below:
• Timeframe: H4
• Recommendation: Short Position
• Entry Level: Short Position 119.00
• Take Profit Level: 118.50 (50 pips)
USDJPY
A possible long position at the breakout of the level 108.75
GOLD
A possible short position in the breakdown of the level 1484.00
USDCHF
A possible short position in the breakdown of the level 0.9865
GBPUSD
A possible long position at the breakout of the level 1.2920

Last week outcome and current market statement ISM Manufacturing Index report announced on Tuesday was the main event last week. Recall, the Index fell to its lowest level since June 2009 - 47.8 points (below 50 means decrease inactivity). As a result, the dollar has undergone the most massive one-day sales over the last month.
However, the sale did not receive further development. The markets were waiting for the statistics on the NFP (unemployment fell to 3.5%, which is a record low for the past few decades. NFP figures are close enough to the forecasts and market expectations. Nevertheless, the dynamics can be traced more clearly (downward trend). So after Friday’s data to come out, the Fed has untied its hands to reduce rates in October (currently the markets estimate the probability at 76%). We also note that lower wage growth is also another enable signal to lower the interest rate.
So, our position as for the dollar has not changed, but rather strengthened. We will continue to look for points for its sales across the entire spectrum of the foreign exchange market. Moreover, the US has not only economic but also political problems. The beginning of the impeachment procedure, regardless of its outcomes, is a negative signal for the US dollar.
As for the upcoming week, it will be relatively calm on Wednesday, the markets will look through the minutes of the last FOMC meeting, on Thursday data on the UK economy (GDP, industrial production), as well as inflation in the USA, on Friday, attention will be focused on statistics on the Canadian labour market, as well as consumer sentiment in the USA.
Of our other preferences, we note the purchase of gold, as well as the Japanese yen. According to analysts at JPMorgan Chase, the 4th quarter in the last 10 years is the most unfortunate period for the Japanese yen. So do not forget about the stops and control the volume of entry.
In the oil market last week, everything was following our forecasts. Goal 51.20 has been achieved. After that, the bears recorded profits on Friday. It is still difficult to say whether this fixation will turn into a full-fledged correction. So we will spend the beginning of the week neutral regarding oil - we will observe how events will develop and we will monitor the news background.
