JPN225: Major Resistance Breakout – Long OpportunityThe Japan 225 (Nikkei 225) on the 4H timeframe is signaling a clear bullish reversal after a solid accumulation phase.
Technical Analysis:
Trendline Breakout: Price has successfully broken above the descending trendline that has been active since November.
Resistance Flipped: The current candle is closing above the key horizontal resistance level at 51,062, confirming a shift in momentum.
Market Structure: The accumulation zone (grey box) provided a strong base, allowing buyers to take control and push for a breakout.
Order setup: Long
Entry: 51,062 (Enter on 4H candle close confirmation or a minor retest).
Stop Loss (SL): 50,775 (Placed below the recent support zone).
Take Profit (TP): 51,700 (Targeting the previous swing high).
Risk/Reward Ratio: ~2.2
⚠️ DISCLAIMER: This post is for educational purposes and personal opinion only; it is not financial advice. Trading indices involves significant risk, especially during low-liquidity holiday periods. Please Do Your Own Research (DYOR) and manage your risk strictly.
Nikkei 225 JPN225 CFD

JPN225 H4 | Bullish Bounce OffThe price has bounced off our buy entry level at 50,261.74, which is an overlap support.
Our stop loss is set at 49,846.21, which is an overlap support.
Our take profit is set at 51,425.25, which is a pullback resistance.
High Risk Investment Warning
Stratos Markets Limited (

JP225 - Long I know what happend to Turkeys stockmarket. I think the same thing will happen this time with Japan.

JPN225 H4 | Bearish Reversal Off 50% Fib ResistanceMomentum: Bearish
The price has rejected off the sell entry, which is an overlap resistance and also aligns with the 50% Fib retracement, which adds significant strength to this level.
Sell entry: 49,929.37
Overlap resistance
50% Fib retracement
Stop loss: 50,417.72
Pullback resistance
Slightly above the 61.8% Fib retracement
Take profit: 48,639.37
Multi swing low suport
High Risk Investment Warning
Stratos Markets Limited (tradu.com ), Stratos Europe Ltd (tradu.com ):
CFDs are complex instruments and come with a high risk of losing money rapidly due to leverage. 70% of retail investor accounts lose money when trading CFDs with this provider. You should consider whether you understand how CFDs work and whether you can afford to take the high risk of losing your money.
Stratos Global LLC (tradu.com ): Losses can exceed deposits.
Please be advised that the information presented on TradingView is provided to Tradu (‘Company’, ‘we’) by a third-party provider (‘TFA Global Pte Ltd’). Please be reminded that you are solely responsible for the trading decisions on your account. Any information and/or content is intended entirely for research, educational and informational purposes only and does not constitute investment or consultation advice or investment strategy. The information is not tailored to the investment needs of any specific person and therefore does not involve a consideration of any of the investment objectives, financial situation or needs of any viewer that may receive it. Past performance is not a reliable indicator of future results. Actual results may differ materially from those anticipated in forward-looking or past performance statements. We assume no liability as to the accuracy or completeness of any of the information and/or content provided herein and the Company cannot be held responsible for any omission, mistake nor for any loss or damage including without limitation to any loss of profit which may arise from reliance on any information supplied by TFA Global Pte Ltd.

JPN225 H4 | Bullish Bounce OffMomentum: Bullish
Price is pulling back toward the buy entry, which aligns with the 50% Fibonacci retracement level. It also remains above the ascending trendline, adding significant strength to this level.
Buy Entry: 49,929.37
Pullback support
Stop Loss: 49,269.72
Pullback support
Take Profit: 51,450.83
Pullback resistance
High Risk Investment Warning
Stratos Markets Limited (tradu.com ), Stratos Europe Ltd (tradu.com ):
CFDs are complex instruments and come with a high risk of losing money rapidly due to leverage. 70% of retail investor accounts lose money when trading CFDs with this provider. You should consider whether you understand how CFDs work and whether you can afford to take the high risk of losing your money.
Stratos Global LLC (tradu.com ): Losses can exceed deposits.
Please be advised that the information presented on TradingView is provided to Tradu (‘Company’, ‘we’) by a third-party provider (‘TFA Global Pte Ltd’). Please be reminded that you are solely responsible for the trading decisions on your account. Any information and/or content is intended entirely for research, educational and informational purposes only and does not constitute investment or consultation advice or investment strategy. The information is not tailored to the investment needs of any specific person and therefore does not involve a consideration of any of the investment objectives, financial situation or needs of any viewer that may receive it. Past performance is not a reliable indicator of future results. Actual results may differ materially from those anticipated in forward-looking or past performance statements. We assume no liability as to the accuracy or completeness of any of the information and/or content provided herein and the Company cannot be held responsible for any omission, mistake nor for any loss or damage including without limitation to any loss of profit which may arise from reliance on any information supplied by TFA Global Pte Ltd.

SOFTBANK can drop another 50%Softbank Group shares took a nosedive on Thursday, dragging down Japanese markets as mixed earnings and guidance from cloud giant Oracle raised fresh worries about excessive spending on artificial intelligence.
#Softbank (TYO:9984) dropped 7.7% to a one-week low of 17,210.0 yen by 22:34 ET (03:34 GMT), making it the biggest loser on the Nikkei 225 index, which fell by over 1%.
The decline in Softbank followed a more than 10% drop in Oracle (NYSE:ORCL), which plummeted after its fiscal second-quarter earnings report. Although the company exceeded market expectations for its net income, it fell short on revenue and provided a weaker-than-anticipated outlook for the upcoming quarter.
#Oracle also raised its fiscal 2026 capital expenditure forecast to $50 billion from $35 billion. The mixed earnings, along with expectations of increased capex, reignited concerns about how Oracle intends to profit from its substantial AI data center spending plans. There are also worries about the company’s debt load, following billions in issuances this year, and its significant exposure to OpenAI, which negatively impacted sentiment towards the stock.
BMO analysts pointed out that Oracle’s ties to OpenAI pose some long-term risks, considering the scale of the startup’s spending commitments and uncertainties about how it plans to fulfill those promises.
These worries spilled over to Softbank, which has a heavy investment in OpenAI. Softbank CFO Yoshimitsu Goto recently mentioned to Nikkei that the tech conglomerate is firmly focused on OpenAI and has no interest in funding its rivals.

JAPAN STOCK (NIKKEI225) vs Bitcoin CYCLYE CHART ! JAPAN STOCK (NIKKEI 225) vs Bitcoin CYCLE CHART !
1950-2025 NIKKEI vs 2010-2025 BTC
FRACTAL ( 5 cycles)

JPN225 H | Bullish Bounce Off 50% Fibonacci SupportMomentum: Bullish
Price has bounced off the buy entry, which aligns with the 50% Fibonacci retracement.
Buy entry: 50,97.62
Pullback support
50% Fibonacci retracement
Stop loss: 49,51.20
Pullback support
Take profit: 51,886.28
Pullback resistance
127.2% Fibonacci extension
Stratos Markets Limited (tradu.com ):
CFDs are complex instruments and come with a high risk of losing money rapidly due to leverage. 68% of retail investor accounts lose money when trading CFDs with this provider. You should consider whether you understand how CFDs work and whether you can afford to take the high risk of losing your money.
Stratos Europe Ltd (tradu.com ):
CFDs are complex instruments and come with a high risk of losing money rapidly due to leverage. 70% of retail investor accounts lose money when trading CFDs with this provider. You should consider whether you understand how CFDs work and whether you can afford to take the high risk of losing your money.

JPN225 Long• Trend context: This setup aligns with the H4 uptrend, supported by a strong upward impulse.
• Momentum: M15, M30, and H1 are oversold, suggesting a potential rebound from current levels.
• Structure: A clear double bottom has formed on both M15 and M30, with RSI divergence of 9 points confirming bullish momentum.
• Support zone: Price is holding above strong support at the previous week’s high, a key level that continues to attract buyers.
• Pattern signal: A bullish shark pattern is forming, indicating strong reversal potential.
• Risk management: Stop loss placed below 50,700 to protect capital.
• Target: First target when M15 turns overbought or when price retests 52,600 highs.

JPN225 ShortPattern structure: A bat pattern has completed on the M15 chart, highlighting a potential reversal zone.
• Market context: Price is testing the all-time high, an area that has historically acted as strong resistance.
• Trend alignment: While this setup moves counter to the H4 trend, recent consolidation has flattened the H1 moving average, suggesting momentum is fading.
• Momentum signal: RSI on H1 is showing significant bearish divergence with a clear triple top — a strong early signal of potential exhaustion.
• Risk management: Stop loss set at 300 pips to protect capital, with a target of 51,700.

JP225 3-7 Nov 51,600 to 51,700 first defense into ISM and NFPWhy this idea exists
Friday closed at 52,411.34, a new record after an explosive October. We are heading into an event heavy week with Tokyo cash closed on Monday for Culture Day while Osaka derivatives trade. That mix invites gap risk into the Tuesday cash open. Midweek brings Japan PMIs and Toyota results. The United States adds ISM Services on Wednesday and nonfarm payrolls on Friday. My job for the week is to respect the breakout, know where I am wrong, and avoid being caught during the data windows.
How to set up your chart
Timeframe 1 hour on JP225 or JPN225 depending on your broker. Draw a horizontal band at 51,600 to 51,700. This is the breakout retest zone formed by Friday low near 51,613 and the prior day high. Mark 52,500 as the first shelf above and 53,000 as a psychological magnet. Below, mark 51,300 as the prior record close and 50,500 to 50,200 as the first deeper shelf. If you like context, add a simple Fibonacci retrace from the October swing at 46,544 to 52,411. The 38.2 percent area near 50,170 and the 50 percent area near 49,480 line up with that lower shelf. No need for a basket of indicators. Keep the view clean so you can read order flow around those bands.
What actually moves price this week
Monday Tokyo cash is closed, derivatives are open. That means futures can lead the tone before cash resumes. Tuesday brings the final Japan manufacturing PMI. Wednesday brings the Japan services PMI and Toyota results, then United States ISM Services late in the Tokyo evening. Friday brings United States nonfarm payrolls. China adds a services PMI and a trade balance print that can tug cyclicals on the margin. The index is also sensitive to the yen. A sharp yen firming is the classic blindside for the bulls, while a soft yen tends to support exporters and the headline beta.
The playbook in three parts
Base case
Sideways to higher while the market digests the calendar. As long as price is accepted above 51,600 to 51,700 on closing basis, the path of least resistance remains higher. Within that regime I expect rotational pushes toward 52,500 and attempts at 53,000 around event hours. I will let futures do the talking on Monday and use Tuesday cash open to judge whether buyers defend the band on first touch.
Upside extension
A firm 4 hour close north of 52,500 with ranges contracting into the close usually sets up a controlled push into 52,800 to 53,000. If that move happens on an event day, accept slippage and keep stops outside recent 2 times ATR on the 4 hour chart. The goal is to avoid getting chopped by headline noise after the first spike.
Downside checkback
A clean failure of 51,600 with a wide range breakdown candle and rising volume changes the game. In that case I expect a step down into 50,500 to 50,200 which is the first proper shelf with multiple reference highs and closes. I will not fade the first touch unless intraday structure rebuilds with higher lows. In a stronger flush the Fibonacci 38.2 and 50 percent zones become the next map points, not instant buy zones.
Risk budget and timing
Average daily range late last week was close to eight hundred points. That is your sizing reality. If your stop is tighter than half of that number you should expect frequent noise hits. My default this week is a stop outside half to three quarters of the recent daily range for swing attempts, tighter only intraday when structure is clean. I do not initiate new risk within fifteen minutes before or after the following windows: Japan PMIs, Toyota press conference start, United States ISM at ten hundred Eastern, United States payrolls at zero eight thirty Eastern. During the Monday cash holiday I treat futures signals as information, not obligation, and I accept that Tuesday cash can gap past my levels.
What would change my mind quickly
One, a sharp yen firming coupled with a hot United States prices subindex inside ISM. Two, a Toyota miss or conservative guide that knocks autos and suppliers at the open. Three, a sudden rumor cycle about Bank of Japan that lifts Japanese Government Bond yields and flips the dollar yen tone. Any of these can turn a routine retest into a full range day.
Three simple rules to run all week
• Hold above 51,600 to 51,700 on closing basis favors continuation toward 52,500 then 53,000.
• Lose 51,600 with a wide breakdown and volume, expect a rotation into 50,500 to 50,200 and stand aside until structure rebuilds.
• Never take a fresh position inside the five minute window around the major releases. If in doubt, flatten and re enter after the first post event pullback.
One chart to keep open
A clean 4 hour chart with the bands drawn, a single session separator, and a twenty period ATR panel. That is enough to keep you on the right side of the map without drowning in signals.
Disclosure and intent
This is education and market analysis, not investment advice. Manage your own risk. If you post your own map, tag the levels you defended and note what you learned. It compounds faster than any entry trick.

JP225 Pullback Complete? Next Stop 50K Resistance?🎌 JAPAN225 (JP225): Bullish Retest Play at 786 LSMA - Thief's Layered Entry Strategy 🎯
📊 Market Overview
The Nikkei 225 (JP225) is showing bullish confirmation with a pullback retest at the 786 Least Squares Moving Average (LSMA)—a classic swing/day trade setup for those who love precision entries with a side of controlled chaos. 🎰
This isn't your grandma's single-entry trade. We're going full Thief Mode with layered limit orders to maximize positioning while the market does its thing. Think of it as "dollar-cost averaging" but cooler and with more risk. 😎
🎯 Trade Setup
📈 Bias: BULLISH
🔍 Confirmation: Retest & bounce at 786 LSMA support zone
⚡ Strategy: Thief's Layered Entry Method (Multiple Limit Orders)
Entry Strategy: The Thief's Ladder
Instead of going all-in at one price (boring! 😴), we're layering buy limit orders like a pro:
Layer 1: 46,500
Layer 2: 46,800
Layer 3: 47,000
Layer 4: 47,500
💡 Pro Tip: You can add more layers based on your risk appetite and account size. The deeper the pullback, the more contracts you accumulate. This is how the Thief OG's do it. 🦝💼
🛑 Stop Loss
Thief's SL: 46,000
⚠️ Important Note: Dear Ladies & Gentlemen (Thief OG's), I'm NOT recommending you blindly follow my stop loss. This is your money, your rules. Set your SL based on your own risk tolerance. If you make money, take money—at your own risk. 💰🎲
🎯 Take Profit Target
Target Zone: 50,500
Why? This level coincides with:
Strong resistance 🧱
Overbought conditions 🔥
Potential bull trap zone 🪤
💡 Exit Strategy: When we hit overbought + resistance, it's time to escape with profits like a true thief in the night. 🌙💨
⚠️ Another Note: Dear Ladies & Gentlemen (Thief OG's), I'm NOT saying you MUST take profit here. Scale out, trail your stop, or hold for glory—your choice, your consequences. 🚀
📈 Key Technical Points
✅ 786 LSMA Support: Acting as dynamic support—this is our retest zone
✅ Bullish Structure Intact: Higher lows forming on multiple timeframes
✅ Risk-to-Reward: Solid 1:3+ R:R depending on your layer average
✅ Momentum Confirmation: Watch for bullish divergence on RSI/MACD if you're into that stuff 📊
🌍 Related Pairs to Watch
Keep an eye on these correlated assets for confirmation:
$USD/JPY (DXY correlation): Inverse relationship—weak USD = stronger Yen = potential JP225 boost 💴
SP:SPX (S&P 500): Risk-on sentiment in US markets often lifts JP225 🇺🇸📈
HSI:HSI (Hang Seng Index): Asian market correlation—regional sentiment matters 🇭🇰
TSE:TOPIX (Tokyo Stock Price Index): Direct correlation with broader Japanese equities 🎌
💡 Correlation Play: If US indices are pumping and USD is weakening, JP225 tends to follow the party. 🎉
⚙️ Risk Management Reminder
This is a layered entry strategy—meaning your average entry price will depend on how many layers get filled. The beauty? You're not FOMOing at one level. The downside? You need proper position sizing across layers to avoid overexposure. 🧮
Golden Rule: Never risk more than 1-2% of your account on a single trade idea. Thief's honor. 🤝
✨ If you find value in my analysis, a 👍 and 🚀 boost is much appreciated — it helps me share more setups with the community!
#JP225 #Nikkei225 #JapanIndex #ThiefStrategy #LayeredEntry #SwingTrading #DayTrading #LSMA #TechnicalAnalysis #ForexCorrelation #RiskManagement #BullishSetup #TradingView #PriceAction #SupportAndResistance #TradeSmart

$JPINTR -Japan Interest Rates (October/2025)ECONOMICS:JPINTR
October/2025
source: Bank of Japan
- The Bank of Japan kept its benchmark short-term rate unchanged at 0.5% in October 2025, maintaining borrowing costs at their highest level since 2008 and extending a pause since the last hike in January.
The decision, in line with market expectations, was approved by a 7-2 vote, with board members Naoki Tamura and Hajime Takata again proposing a rise to 0.75%, as they had in September.
The central bank reaffirmed its commitment to continue raising borrowing costs if the economy follows its projections.
The move came hours after the U.S. Federal Reserve delivered its second rate cut of the year.
In its quarterly outlook, the BoJ held core inflation for FY 2025 at 2.7%, expecting it to ease to 1.8% in FY 2026 before rising slightly to 2.0% in FY 2027.
GDP growth for FY 2025 was revised up to 0.7% from 0.6%, supported by a trade deal with Washington and new leadership under Prime Minister Sanae Takaichi, while GDP projections for FY 2026 and 2027 remained at 0.7% and 1%, respectively.

Nikkei surges higher: What’s powering the market now#NIKKEI has soared above 50,000. The rally is fueled by a mix of political momentum following Sanae Takaichi’s arrival, the predictably dovish stance of the Bank of Japan, a weak yen benefiting exporters, accelerating corporate reforms, and a revival in tourism and domestic demand — all pushing profit expectations and valuations to record highs.
Key drivers of further #NIKKEI growth:
Weak yen + dovish BoJ : Exporters earn more when converting foreign revenue into yen; cheap credit keeps valuations and multiples strong.
AI and semiconductor investment cycle : Japan is expanding chip fabs, while local suppliers of materials and equipment enjoy long-term contracts and steady cash flow.
Corporate reforms & buybacks : Companies are selling off non-core assets, boosting efficiency, and buying back shares — lifting EPS and investor confidence.
Tourism & services boom : Japan is affordable for travelers, spending is up, and hotels, retailers, restaurants, and transport firms are reporting record revenues.
Rising wages & consumption : Households have more disposable income; businesses raise prices moderately, margins stay solid, and revenues grow steadily across sectors.
#NIKKEI’s growth isn’t only about the weak yen. FreshForex analysts believe political reform momentum, loose monetary policy, renewed chip demand, disciplined corporate management, and a robust services/tourism sector are key supports. The base scenario: the uptrend could extend through 2025–2026, though risks include a sharp yen rebound or political delays.

JPN225 H4 | Bullish Continuation SetupJPN225 is falling towards the buy entry at 49,979.88, which is a pullback support that is slightly below the 23.6% Fibonacci retracement and could bounce from this level to the upside.
Stop loss is at 48,579.49, which is an overlap support that is slightly above the 50% Fibonacci retracement.
Take profit is at 51,891.00, which lines up with the 78.6% Fibonacci projection.
Stratos Markets Limited (tradu.com ):
CFDs are complex instruments and come with a high risk of losing money rapidly due to leverage. 68% of retail investor accounts lose money when trading CFDs with this provider. You should consider whether you understand how CFDs work and whether you can afford to take the high risk of losing your money.
Stratos Europe Ltd (tradu.com ):
CFDs are complex instruments and come with a high risk of losing money rapidly due to leverage. 70% of retail investor accounts lose money when trading CFDs with this provider. You should consider whether you understand how CFDs work and whether you can afford to take the high risk of losing your money.

Nikkei 225 is showing an extreme bullish biasThe Nikkei 225 is showing an extreme bullish bias on the daily chart, coiling within a clear Bullish Wedge/Triangle pattern, indicating an impending major upside breakout.
Parameter Level:-
Entry Confirm close above 49510
Target (T1) -50,380
Stop-Loss (SL) - 49233
Reason : The pattern is consolidating after an uptrend, suggesting momentum is being built for a powerful continuation. A confirmed break above the upper trendline signals activation. Trade the confirmed breakout for explosive upside potential toward the \mathbf{50,380} target.

Nikkei, another leg lower first? Nikkei rallied strongly on Monday, stalled yesterday then came down. It dropped further just now but rebounded strongly. Price at a strong level here. If price is rejected by current level, look for another leg lower.

JPN225 H4 | Bullish Momentum Likely to ExtendBased on the H4 chart analysis, we could see the price fall to the buy entry at 48,663.24, which is a pullback support that is slightly above the 38.2% Fibonacci retracement and could bounce from this levle to the upside.
Stop loss is at 46,831.41, which is a pullback support that lines up with the 78.6% Fibonacci retracement.
Take profit is at 50,983.56, which aligns with the 161.8% Fibonacci extension.
High Risk Investment Warning
Trading Forex/CFDs on margin carries a high level of risk and may not be suitable for all investors. Leverage can work against you.
Stratos Markets Limited (tradu.com ):
CFDs are complex instruments and come with a high risk of losing money rapidly due to leverage. 65% of retail investor accounts lose money when trading CFDs with this provider. You should consider whether you understand how CFDs work and whether you can afford to take the high risk of losing your money.
Stratos Europe Ltd (tradu.com ):
CFDs are complex instruments and come with a high risk of losing money rapidly due to leverage. 66% of retail investor accounts lose money when trading CFDs with this provider. You should consider whether you understand how CFDs work and whether you can afford to take the high risk of losing your money.
Stratos Global LLC (tradu.com ):
Losses can exceed deposits.
Please be advised that the information presented on TradingView is provided to Tradu (‘Company’, ‘we’) by a third-party provider (‘TFA Global Pte Ltd’). Please be reminded that you are solely responsible for the trading decisions on your account. There is a very high degree of risk involved in trading. Any information and/or content is intended entirely for research, educational and informational purposes only and does not constitute investment or consultation advice or investment strategy. The information is not tailored to the investment needs of any specific person and therefore does not involve a consideration of any of the investment objectives, financial situation or needs of any viewer that may receive it. Kindly also note that past performance is not a reliable indicator of future results. Actual results may differ materially from those anticipated in forward-looking or past performance statements. We assume no liability as to the accuracy or completeness of any of the information and/or content provided herein and the Company cannot be held responsible for any omission, mistake nor for any loss or damage including without limitation to any loss of profit which may arise from reliance on any information supplied by TFA Global Pte Ltd.
The speaker(s) is neither an employee, agent nor representative of Tradu and is therefore acting independently. The opinions given are their own, constitute general market commentary, and do not constitute the opinion or advice of Tradu or any form of personal or investment advice. Tradu neither endorses nor guarantees offerings of third-party speakers, nor is Tradu responsible for the content, veracity or opinions of third-party speakers, presenters or participants.

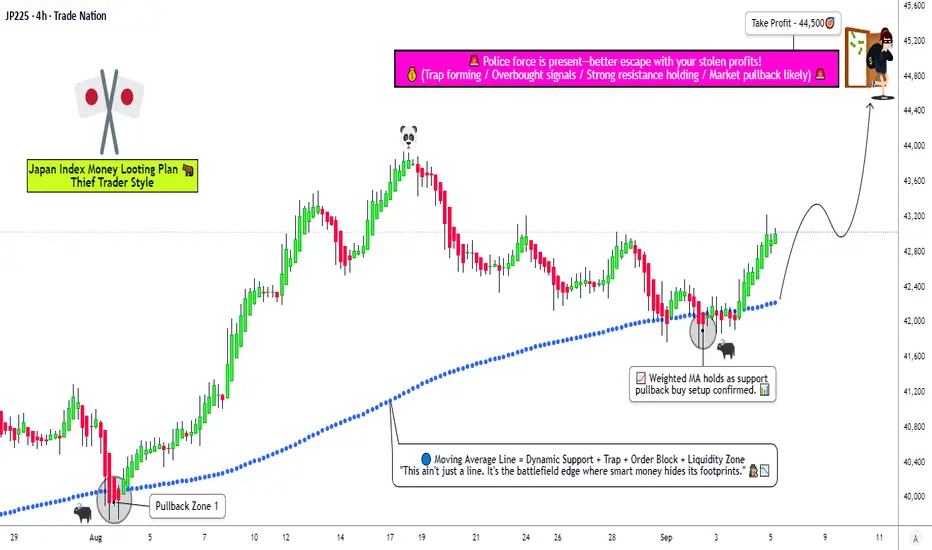
JP225 – Multi-Layer Entry, Smart SL & Steal Profits!🚀🇯🇵 JP225 (JAPAN 225) CFD - THIEF STRATEGY BULLISH PLAN 🇯🇵🚀
🎯 Core Trading Idea
The "Thief Strategy" uses layered limit orders to stealthily accumulate positions during bullish momentum, targeting a swift escape before key resistance levels. This approach maximizes entry efficiency while minimizing market impact – perfect for the current JP225 setup!
📊 THIEF STRATEGY EXECUTION PLAN
⚡ Entry Protocol (Layered Limit Orders)
🔰 Layer 1: 42,200
🔰 Layer 2: 42,400
🔰 Layer 3: 42,600
🔰 Layer 4: 42,800
💡 Pro Tip: Add more layers based on your risk tolerance and capital allocation
🛑 Stop Loss Configuration
Thief OG SL: 41,800 (Strategic support breach level)
⚠️ Disclaimer: Adjust SL based on your personal risk management rules. This is NOT financial advice.
🎯 Profit-Taking Target
Primary Escape Zone: 44,500 (Take profits before police barricade resistance at 45,000)
Remember: Escape with your stolen money wisely! Partial profits at 43,800 and 44,200 recommended
📈 WHY THIS PLAN? MARKET CONTEXT & ANALYSIS
🎯 Real-Time Index Snapshot (Sep 05, 2025)
Current Price: 43,002.00 (+423.82 / +1.00% 📈)
Monthly Gain: +5.48% (Strong momentum ✅)
Yearly Gain: +18.24% (Bullish trend intact ✅)
All-Time High: 43,876.42 (August 2025 🏆)
😰😊 Market Sentiment: Fear & Greed Index
Current Reading: Greed (Score ~70/100) 😊
Momentum: Strong (Above 125-day MA) 📈
Volatility: Low to Moderate 😌
Safe Haven Demand: Low 🚫
Options Activity: Neutral 📊
✅ Fundamental Drivers (BULLISH CATALYSTS)
🏎️ Trade Policy Win: U.S. auto tariffs reduced to 15% (from 27.5%) - massive boost for Japanese exporters
💰 Wage Growth Breakthrough: Real wages turned positive (+0.5%) for first time since December 2024
💵 Investment Surge: $550B Japanese investments in U.S. projects announced
🌍 Global Liquidity Support: Fed rate cut expectations supporting risk assets
🏢 Corporate Strength: Toyota (+1.98%), Honda (+1.14%), and Mitsubishi UFJ (+0.93%) leading gains
⚠️ Key Risks (BE AWARE)
💴 Yen Appreciation Risk: Potential JPY strength if U.S. accelerates rate cuts
🎯 Inflation Pressure: Consumer inflation at 3.6% (above BoJ's 2% target)
📉 Mixed Economic Signals: Coincident index dropped to 113.3 (from 116.7)
📊 Technical Assessment
🎯 Trend Structure: Bullish above 41,500 support
📊 Momentum: Strong upward trajectory with occasional consolidation
🧱 Resistance Levels: 43,900 (Recent high), 45,000 (Psychological barrier)
🛡️ Support Levels: 41,800 (Strategy SL), 41,200 (Strong weekly support)
🌐 RELATED PAIRS TO WATCH
FX:USDJPY - Critical for exporter competitiveness
INDEX:NKY - Nikkei 225 futures correlation
SP:SPX - Global risk sentiment gauge
OANDA:EURJPY - Yen strength indicator
📊 BULLISH/BEARISH SCORECARD
Technical: 80% Bullish ✅ | 20% Bearish
Fundamental: 75% Bullish ✅ | 25% Bearish
Sentiment: 70% Bullish ✅ | 30% Bearish
Risk/Reward: 80% Favorable ✅ | 20% Unfavorable
OVERALL: 76% BULLISH ✅ | 24% BEARISH
👑 TRADER PERSPECTIVES
🎯 Retail Traders: Optimistic but cautious near ATHs. Watch for breakout above 43,900
🏦 Institutional Flow: Accumulating on dips, focusing on exporters and tech names
🇯🇵 Domestic Investors: Positive on wage growth and trade developments
✨ "If you find value in my analysis, a 👍 and 🚀 boost is much appreciated — it helps me share more setups with the community!"
⚠️ RISK DISCLAIMER
This idea is for educational purposes only. I am not a financial advisor. The "Thief Strategy" is a personal approach and may not suit all traders. Always conduct your own analysis and manage risk appropriately. Past performance doesn't guarantee future results. Trading CFDs carries substantial risk of loss.
#JP225 #Japan225 #NIKKEI #TradingSetup #SwingTrading #DayTrading #TradingStrategy #CFD #MarketAnalysis #TechnicalAnalysis #TradingView #ThiefStrategy #Bullish #Investing #Stocks #Finance
Nikkei 225 Extends Uptrend Within Ascending ChannelThe Nikkei 225 index continues its strong upward trajectory, maintaining a well-defined ascending channel since mid-2025. Recent price action shows a sharp rally to the upper boundary of the channel, supported by sustained bullish momentum.
Both moving averages confirm the prevailing uptrend — the 50-day SMA (blue) remains above the 200-day SMA (red), reflecting a healthy technical structure. The latest surge pushed prices well above these averages, suggesting strong market conviction despite the steep short-term rise.
Momentum indicators paint a similar picture:
The MACD histogram remains positive, with the MACD line comfortably above the signal line, indicating ongoing upward momentum.
The RSI (14) has climbed above 70, signaling overbought conditions that may precede a brief pause or consolidation, especially as the index approaches the top of its trend channel.
In summary, the Japan 225 maintains a robust bullish trend within its established ascending channel. While momentum remains favorable, traders may watch for potential cooling or pullback signals near the channel’s upper boundary before assessing the next directional phase.
-MW

JPN225 H4 | Bearish Momentum to ExtendBased on the H4 chart analysis, we can see that the price has rejected off the sell entry at 45,015.82, which is a pullback resistance and could drop from this level to the downside.
Stop loss is at 45,921.36, which is a swing high resistance.
Take profit is at 43,822.81, which is a pullback support that aligns with the 50% Fibonacci retracement.
High Risk Investment Warning
Trading Forex/CFDs on margin carries a high level of risk and may not be suitable for all investors. Leverage can work against you.
Stratos Markets Limited (tradu.com ):
CFDs are complex instruments and come with a high risk of losing money rapidly due to leverage. 65% of retail investor accounts lose money when trading CFDs with this provider. You should consider whether you understand how CFDs work and whether you can afford to take the high risk of losing your money.
Stratos Europe Ltd (tradu.com ):
CFDs are complex instruments and come with a high risk of losing money rapidly due to leverage. 66% of retail investor accounts lose money when trading CFDs with this provider. You should consider whether you understand how CFDs work and whether you can afford to take the high risk of losing your money.
Stratos Global LLC (tradu.com ):
Losses can exceed deposits.
Please be advised that the information presented on TradingView is provided to Tradu (‘Company’, ‘we’) by a third-party provider (‘TFA Global Pte Ltd’). Please be reminded that you are solely responsible for the trading decisions on your account. There is a very high degree of risk involved in trading. Any information and/or content is intended entirely for research, educational and informational purposes only and does not constitute investment or consultation advice or investment strategy. The information is not tailored to the investment needs of any specific person and therefore does not involve a consideration of any of the investment objectives, financial situation or needs of any viewer that may receive it. Kindly also note that past performance is not a reliable indicator of future results. Actual results may differ materially from those anticipated in forward-looking or past performance statements. We assume no liability as to the accuracy or completeness of any of the information and/or content provided herein and the Company cannot be held responsible for any omission, mistake nor for any loss or damage including without limitation to any loss of profit which may arise from reliance on any information supplied by TFA Global Pte Ltd.
The speaker(s) is neither an employee, agent nor representative of Tradu and is therefore acting independently. The opinions given are their own, constitute general market commentary, and do not constitute the opinion or advice of Tradu or any form of personal or investment advice. Tradu neither endorses nor guarantees offerings of third-party speakers, nor is Tradu responsible for the content, veracity or opinions of third-party speakers, presenters or participants.

$JPIRYY -Japan Inflation Rate (August/2025)ECONOMICS:JPIRYY
August/2025
source: Ministry of Internal Affairs & Communications
-Japan's annual inflation rate eased to 2.7% in August 2025 from 3.1% in the previous month,
marking the lowest reading since October 2024.
Electricity prices fell much steeper (-7.0% vs -0.7% in July) due to government subsidies, and gas prices dropped (-2.7%) after being flat previously.
Education costs also continued to drop (-5.6% vs -5.6%). Price growth slowed for household items (2.0% vs 2.5%), healthcare (1.3% vs 1.5%), and recreation (2.3% vs 2.6%).
Inflation accelerated for housing (1.1% vs 1.0%), clothing (2.9% vs 2.8%), transport (3.0% vs 2.6%), communications (7.0% vs 6.4%), and miscellaneous goods (1.3% vs 1.2%).
On the food side, prices rose 7.2%, easing from July’s five-month peak of 7.6%, driven by the smallest gain in rice prices in eight months at 69.7%, amid Tokyo’s efforts to curb staple food costs. Core inflation also stood at 2.7%, matching market consensus and reaching a nine-month low.
Monthly, the CPI edged up 0.1%, holding steady for the third straight month.

Update to our Nikkei 225 callThe Nikkei 225 is up around 10% since our bullish note in June .
That confirms our earlier conviction. Japan’s pivot into AI, combined with ultra-loose domestic policy, has powered earnings and investor confidence. Now, a secondary wave of upside is building, centred on a weakening US dollar.
The US dollar has entered a broad downward trend. Falling yields, slower US growth, and rising expectations of rate cuts have all contributed. Markets are now pricing in more Fed easing, pushing the dollar to multi-year lows.
This matters for Japanese equities. A weaker dollar usually drives a weaker yen, boosting the export sector. Dollar revenues translate into higher earnings. Japanese companies become more competitive globally. Foreign capital also starts to look at yen assets more seriously, especially when US returns are under pressure.
At the same time, global risk appetite is stabilising. Japan’s equity market, still trading at a discount to US peers, offers solid earnings growth with less tech sector froth. That’s a rare combination.
We remain high-conviction bullish on the Nikkei. The AI transformation is real, and earnings momentum remains strong. With the greenback weakening, Japan’s export engine stands to accelerate. The weak dollar isn’t just supportive, it’s the next catalyst for the rally.
The forecasts provided herein are intended for informational purposes only and should not be construed as guarantees of future performance. This is an example only to enhance a consumer's understanding of the strategy being described above and is not to be taken as Blueberry Markets providing personal advice.
