USDJPY H1 | Bearish drop headBased on the H1 chart analysis, we could see the price rise to the sell entry, which acts as a pullback resistance, and could drop from this level to the downside.
Sell entry is 147.29, which is a pullback resistance.
Stop loss is at 147.97, which is a swing high resistance.
Take profit is at 146.35, which is a swing low support that lines up with the 78.6% Fibonacci projection.
High Risk Investment Warning
Trading Forex/CFDs on margin carries a high level of risk and may not be suitable for all investors. Leverage can work against you.
Stratos Markets Limited (tradu.com ):
CFDs are complex instruments and come with a high risk of losing money rapidly due to leverage. 65% of retail investor accounts lose money when trading CFDs with this provider. You should consider whether you understand how CFDs work and whether you can afford to take the high risk of losing your money.
Stratos Europe Ltd (tradu.com ):
CFDs are complex instruments and come with a high risk of losing money rapidly due to leverage. 66% of retail investor accounts lose money when trading CFDs with this provider. You should consider whether you understand how CFDs work and whether you can afford to take the high risk of losing your money.
Stratos Global LLC (tradu.com):
Losses can exceed deposits.
Please be advised that the information presented on TradingView is provided to Tradu (‘Company’, ‘we’) by a third-party provider (‘TFA Global Pte Ltd’). Please be reminded that you are solely responsible for the trading decisions on your account. There is a very high degree of risk involved in trading. Any information and/or content is intended entirely for research, educational and informational purposes only and does not constitute investment or consultation advice or investment strategy. The information is not tailored to the investment needs of any specific person and therefore does not involve a consideration of any of the investment objectives, financial situation or needs of any viewer that may receive it. Kindly also note that past performance is not a reliable indicator of future results. Actual results may differ materially from those anticipated in forward-looking or past performance statements. We assume no liability as to the accuracy or completeness of any of the information and/or content provided herein and the Company cannot be held responsible for any omission, mistake nor for any loss or damage including without limitation to any loss of profit which may arise from reliance on any information supplied by TFA Global Pte Ltd.
The speaker(s) is neither an employee, agent nor representative of Tradu and is therefore acting independently. The opinions given are their own, constitute general market commentary, and do not constitute the opinion or advice of Tradu or any form of personal or investment advice. Tradu neither endorses nor guarantees offerings of third-party speakers, nor is Tradu responsible for the content, veracity or opinions of third-party speakers, presenters or participants.
Jpy

NZDJPY to find sellers at previous swing high?NZDJPY - 24h expiry
Early optimism is likely to lead to gains although extended attempts higher are expected to fail.
88.36 has been pivotal.
We look for a temporary move higher.
Preferred trade is to sell into rallies.
Selling spikes offers good risk/reward.
We look to Sell at 88.25 (stop at 88.58)
Our profit targets will be 87.25 and 87.05
Resistance: 87.89 / 88.20 / 88.36
Support: 87.50 / 87.17 / 86.63
Risk Disclaimer
The trade ideas beyond this page are for informational purposes only and do not constitute investment advice or a solicitation to trade. This information is provided by Signal Centre, a third-party unaffiliated with OANDA, and is intended for general circulation only. OANDA does not guarantee the accuracy of this information and assumes no responsibilities for the information provided by the third party. The information does not take into account the specific investment objectives, financial situation, or particular needs of any particular person. You should take into account your specific investment objectives, financial situation, and particular needs before making a commitment to trade, including seeking, under a separate engagement, as you deem fit.
You accept that you assume all risks in independently viewing the contents and selecting a chosen strategy.
Where the research is distributed in Singapore to a person who is not an Accredited Investor, Expert Investor or an Institutional Investor, Oanda Asia Pacific Pte Ltd (“OAP“) accepts legal responsibility for the contents of the report to such persons only to the extent required by law. Singapore customers should contact OAP at 6579 8289 for matters arising from, or in connection with, the information/research distributed.

Bullish reversal off pullback support?USD/JPY is falling towards the support level, which is a pullback support and could bounce from this level to our take profit.
Entry: 146.37
Why we like it:
There is a pullback support.
Stop loss: 145.84
Why we like it:
There is an overlap support that aligns with the 127.2% Fibonacci extension.
Take profit: 147.84
Why we like it:
There is a pullback resistance.
Enjoying your TradingView experience? Review us!
Please be advised that the information presented on TradingView is provided to Vantage (‘Vantage Global Limited’, ‘we’) by a third-party provider (‘Everest Fortune Group’). Please be reminded that you are solely responsible for the trading decisions on your account. There is a very high degree of risk involved in trading. Any information and/or content is intended entirely for research, educational and informational purposes only and does not constitute investment or consultation advice or investment strategy. The information is not tailored to the investment needs of any specific person and therefore does not involve a consideration of any of the investment objectives, financial situation or needs of any viewer that may receive it. Kindly also note that past performance is not a reliable indicator of future results. Actual results may differ materially from those anticipated in forward-looking or past performance statements. We assume no liability as to the accuracy or completeness of any of the information and/or content provided herein and the Company cannot be held responsible for any omission, mistake nor for any loss or damage including without limitation to any loss of profit which may arise from reliance on any information supplied by Everest Fortune Group.

Bullish bounce off 61.8% Fibonacci support?USD/JPY is falling towards the pivot, which is a pullback support that aligns with the 61.8% Fibonacci retracement and could bounce to the 1st resistance.
Pivot: 146.84
1st Support: 145.99
1st Resistance: 148.34
Disclaimer:
The above opinions given constitute general market commentary, and do not constitute the opinion or advice of IC Markets or any form of personal or investment advice.
Any opinions, news, research, analyses, prices, other information, or links to third-party sites contained on this website are provided on an "as-is" basis, are intended only to be informative, is not an advice nor a recommendation, nor research, or a record of our trading prices, or an offer of, or solicitation for a transaction in any financial instrument and thus should not be treated as such. The information provided does not involve any specific investment objectives, financial situation and needs of any specific person who may receive it. Please be aware, that past performance is not a reliable indicator of future performance and/or results. Past Performance or Forward-looking scenarios based upon the reasonable beliefs of the third-party provider are not a guarantee of future performance. Actual results may differ materially from those anticipated in forward-looking or past performance statements. IC Markets makes no representation or warranty and assumes no liability as to the accuracy or completeness of the information provided, nor any loss arising from any investment based on a recommendation, forecast or any information supplied by any third-party.

Potential bearish dropEUR/JPY has rejected off the resistance level, which is a pullback resistance that is slightly below the 50% Fibonacci retracement and could drop from this level to our take profit.
Entry: 172.83
Why we like it:
There is a pullback resistance that is slightly below the 50% Fibonacci retracement.
Stop loss: 173.55
Why we like it:
There is a pullback resistance level.
Take profit: 171.99
Why we like it:
There is a pullback support that is slightly above the 127.2% Fibonacci extension.
Enjoying your TradingView experience? Review us!
Please be advised that the information presented on TradingView is provided to Vantage (‘Vantage Global Limited’, ‘we’) by a third-party provider (‘Everest Fortune Group’). Please be reminded that you are solely responsible for the trading decisions on your account. There is a very high degree of risk involved in trading. Any information and/or content is intended entirely for research, educational and informational purposes only and does not constitute investment or consultation advice or investment strategy. The information is not tailored to the investment needs of any specific person and therefore does not involve a consideration of any of the investment objectives, financial situation or needs of any viewer that may receive it. Kindly also note that past performance is not a reliable indicator of future results. Actual results may differ materially from those anticipated in forward-looking or past performance statements. We assume no liability as to the accuracy or completeness of any of the information and/or content provided herein and the Company cannot be held responsible for any omission, mistake nor for any loss or damage including without limitation to any loss of profit which may arise from reliance on any information supplied by Everest Fortune Group.

GBPJPY POSSIBLE SELL SETUP 📉 GBPJPY – Possible Rejection at 200.200 Resistance
Description:
GBPJPY is currently approaching a key supply/resistance zone around 200.200. Price has shown a break of structure (BOS) earlier, and now it may retest before continuing lower.
Resistance zone: 200.000 – 200.200
Potential entry: Around 200.000 (waiting for confirmation of rejection).
Target zone: 198.200 – 198.500
Stop Loss: Above 200.600
Bias:
I’m bearish on GBPJPY unless the price closes above 200.600.
Risk Note:
⚠️ This is just analysis, not financial advice. Always manage risk properly.
I share analysis like this regularly. If you find it useful, feel free to follow me here on TradingView for more updates 🙌.

USD/JPY - Targets for next move Hi Traders, what are everyone's thoughts on USD/JPY?
This is my view.. I see price in HTF making Bullish movements reacting of Demand zones. What we have now is a very clear ranging market after price came off the Supply zone. BSL was swept and now we are stuck between a very weak Support and Resistance.
So what I belive will happen next will be due to HTF bullish Demand, I see SSL liquidity that has to be swept before buyers step in to drive the price back up again. Im seeing much stronger rejections from sellers than I am from buyers currently telling me Sellers have more control.
I do have short positions currently active but I will continue to add more positions on this pullback. The highlighted yellow area within the IMB will be my targets.
Good luck traders and please follow and comment if this was helpful

USDJPY H1 | Bullish bounce offUSD/JPY has bounced off the buy entry, which is a pullback support, and could rise from this level to the upside.
Buy entry is at 147.22, which is a pullbacksupport.
Stop loss is at 146.84, which is a pullback support.
Take profit is at 147.90, which is a pullback resistance.
High Risk Investment Warning
Trading Forex/CFDs on margin carries a high level of risk and may not be suitable for all investors. Leverage can work against you.
Stratos Markets Limited (tradu.com ):
CFDs are complex instruments and come with a high risk of losing money rapidly due to leverage. 65% of retail investor accounts lose money when trading CFDs with this provider. You should consider whether you understand how CFDs work and whether you can afford to take the high risk of losing your money.
Stratos Europe Ltd (tradu.com ):
CFDs are complex instruments and come with a high risk of losing money rapidly due to leverage. 66% of retail investor accounts lose money when trading CFDs with this provider. You should consider whether you understand how CFDs work and whether you can afford to take the high risk of losing your money.
Stratos Global LLC (tradu.com ):
Losses can exceed deposits.
Please be advised that the information presented on TradingView is provided to Tradu (‘Company’, ‘we’) by a third-party provider (‘TFA Global Pte Ltd’). Please be reminded that you are solely responsible for the trading decisions on your account. There is a very high degree of risk involved in trading. Any information and/or content is intended entirely for research, educational and informational purposes only and does not constitute investment or consultation advice or investment strategy. The information is not tailored to the investment needs of any specific person and therefore does not involve a consideration of any of the investment objectives, financial situation or needs of any viewer that may receive it. Kindly also note that past performance is not a reliable indicator of future results. Actual results may differ materially from those anticipated in forward-looking or past performance statements. We assume no liability as to the accuracy or completeness of any of the information and/or content provided herein and the Company cannot be held responsible for any omission, mistake nor for any loss or damage including without limitation to any loss of profit which may arise from reliance on any information supplied by TFA Global Pte Ltd.
The speaker(s) is neither an employee, agent nor representative of Tradu and is therefore acting independently. The opinions given are their own, constitute general market commentary, and do not constitute the opinion or advice of Tradu or any form of personal or investment advice. Tradu neither endorses nor guarantees offerings of third-party speakers, nor is Tradu responsible for the content, veracity or opinions of third-party speakers, presenters or participants.

Bearish reversal off pullback resistance?EUR/JPY is rising towards the pivot and could reverse to the 1st support.
Pivot: 173.11
1st Support: 172.00
1st Resistance: 173.89
Disclaimer:
The above opinions given constitute general market commentary, and do not constitute the opinion or advice of IC Markets or any form of personal or investment advice.
Any opinions, news, research, analyses, prices, other information, or links to third-party sites contained on this website are provided on an "as-is" basis, are intended only to be informative, is not an advice nor a recommendation, nor research, or a record of our trading prices, or an offer of, or solicitation for a transaction in any financial instrument and thus should not be treated as such. The information provided does not involve any specific investment objectives, financial situation and needs of any specific person who may receive it. Please be aware, that past performance is not a reliable indicator of future performance and/or results. Past Performance or Forward-looking scenarios based upon the reasonable beliefs of the third-party provider are not a guarantee of future performance. Actual results may differ materially from those anticipated in forward-looking or past performance statements. IC Markets makes no representation or warranty and assumes no liability as to the accuracy or completeness of the information provided, nor any loss arising from any investment based on a recommendation, forecast or any information supplied by any third-party.

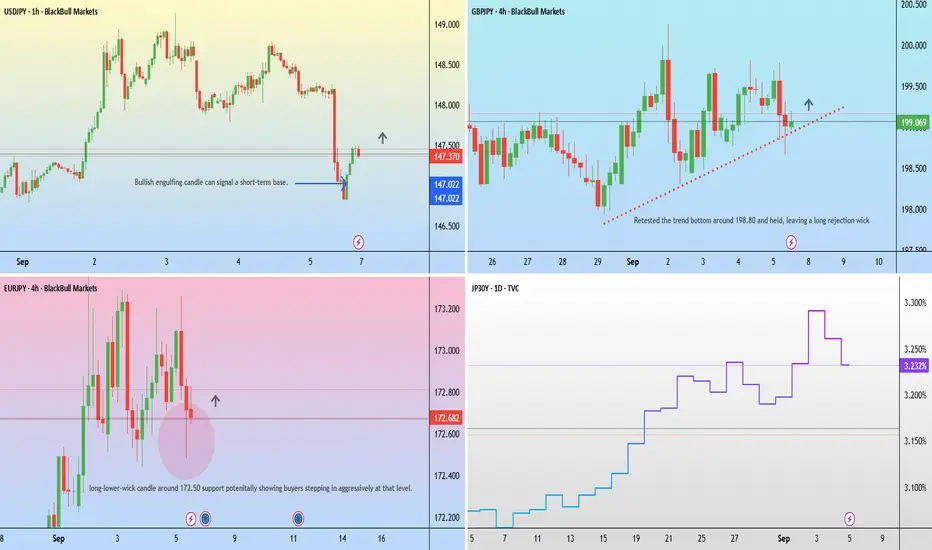
Yen Pairs Falter at Technical Junctures Several yen pairs have stalled around resistance levels, despite solid rallies into them. But whether this could indicate the beginning of a deep pullback or eventual bullish breakout likely hinges on whether incoming data points towards a hard or soft landing in the US. Today I look out EUR/JPY, GBP/JPY, CHF/JPY and CAD/JPY crosses, and update analysis on USD/JPY.
Matt Simpson, market Analyst at City Index

Bullish momentum to extend?NZD/JPY is reacting off the pivot which acts as a pullback support and could rise to the 1st resistance.
Pivot: 87.24
1st Support: 86.76
1st Resistance: 88.15
Disclaimer:
The above opinions given constitute general market commentary, and do not constitute the opinion or advice of IC Markets or any form of personal or investment advice.
Any opinions, news, research, analyses, prices, other information, or links to third-party sites contained on this website are provided on an "as-is" basis, are intended only to be informative, is not an advice nor a recommendation, nor research, or a record of our trading prices, or an offer of, or solicitation for a transaction in any financial instrument and thus should not be treated as such. The information provided does not involve any specific investment objectives, financial situation and needs of any specific person who may receive it. Please be aware, that past performance is not a reliable indicator of future performance and/or results. Past Performance or Forward-looking scenarios based upon the reasonable beliefs of the third-party provider are not a guarantee of future performance. Actual results may differ materially from those anticipated in forward-looking or past performance statements. IC Markets makes no representation or warranty and assumes no liability as to the accuracy or completeness of the information provided, nor any loss arising from any investment based on a recommendation, forecast or any information supplied by any third-party.

Dollar-Yen Outlook: Bearish While Under 147.82 PivotUSDJPY – Overview
The pair shows bearish momentum after stabilizing below 147.82, confirming pressure to the downside.
Technical Outlook:
📉 As long as price trades below 147.82, bearish momentum is expected to extend toward 147.07 → 146.35.
📈 A confirmed 4H close above 147.82 would shift momentum bullish, targeting 148.49 → 149.00.
Key Levels:
Pivot: 147.82
Support: 147.07 – 146.35
Resistance: 148.49 – 149.00
Bias: Bearish below 147.82; bullish recovery possible only on a confirmed break above this pivot.

USDJPY Testing 146.700 as Market Awaits ReactionHey Traders, in today's trading session we are monitoring USDJPY for a potential selling opportunity around the 146.700 zone. The pair has been trading in an uptrend, but is currently in a correction phase, approaching this key support/resistance level.
Structure: While the broader bias has been bullish, the correction is bringing price back toward an area of interest.
Key level in focus: 146.700 — a zone where sellers may look to step in if momentum shifts.
Fundamentals: Market sentiment remains sensitive to U.S. data and Fed expectations, which continue to guide short-term USD moves.
Trade safe,
Joe.

GBPJPY H4| Bearish reversal in playGBP/JPY has rejected off the sell entry, which is a pullback resistance, and could drop from this level to the downside.
Sell entry is at 200.06, which is a pullback resistance.
Stop loss is at 200.84, a resistance level that aligns with the 127.2% Fibonacci extension.
Take profit is at 198.59, which is a pullback support.
High Risk Investment Warning
Trading Forex/CFDs on margin carries a high level of risk and may not be suitable for all investors. Leverage can work against you.
Stratos Markets Limited (tradu.com ):
CFDs are complex instruments and come with a high risk of losing money rapidly due to leverage. 65% of retail investor accounts lose money when trading CFDs with this provider. You should consider whether you understand how CFDs work and whether you can afford to take the high risk of losing your money.
Stratos Europe Ltd (tradu.com ):
CFDs are complex instruments and come with a high risk of losing money rapidly due to leverage. 66% of retail investor accounts lose money when trading CFDs with this provider. You should consider whether you understand how CFDs work and whether you can afford to take the high risk of losing your money.
Stratos Global LLC (tradu.com ):
Losses can exceed deposits.
Please be advised that the information presented on TradingView is provided to Tradu (‘Company’, ‘we’) by a third-party provider (‘TFA Global Pte Ltd’). Please be reminded that you are solely responsible for the trading decisions on your account. There is a very high degree of risk involved in trading. Any information and/or content is intended entirely for research, educational and informational purposes only and does not constitute investment or consultation advice or investment strategy. The information is not tailored to the investment needs of any specific person and therefore does not involve a consideration of any of the investment objectives, financial situation or needs of any viewer that may receive it. Kindly also note that past performance is not a reliable indicator of future results. Actual results may differ materially from those anticipated in forward-looking or past performance statements. We assume no liability as to the accuracy or completeness of any of the information and/or content provided herein and the Company cannot be held responsible for any omission, mistake nor for any loss or damage including without limitation to any loss of profit which may arise from reliance on any information supplied by TFA Global Pte Ltd.
The speaker(s) is neither an employee, agent nor representative of Tradu and is therefore acting independently. The opinions given are their own, constitute general market commentary, and do not constitute the opinion or advice of Tradu or any form of personal or investment advice. Tradu neither endorses nor guarantees offerings of third-party speakers, nor is Tradu responsible for the content, veracity or opinions of third-party speakers, presenters or participants.

USDJPY H4| Bullish bounce from key supportUSD/JPY is falling towards the buy entry, which is a pullback support that aligns with the 78.6% Fibonacci projection and could bounce from this level to the take profit.
Buy entry is at 146.70, which is a pullback support that lines up with the 78.6% Fibonacci projection.
Stop loss is at 146.05, which is a pullback support that aligns with the 138.2% Fibonacci extension.
Take profit is at 147.92, which is a pullback resistance.
High Risk Investment Warning
Trading Forex/CFDs on margin carries a high level of risk and may not be suitable for all investors. Leverage can work against you.
Stratos Markets Limited (tradu.com ):
CFDs are complex instruments and come with a high risk of losing money rapidly due to leverage. 65% of retail investor accounts lose money when trading CFDs with this provider. You should consider whether you understand how CFDs work and whether you can afford to take the high risk of losing your money.
Stratos Europe Ltd (tradu.com ):
CFDs are complex instruments and come with a high risk of losing money rapidly due to leverage. 66% of retail investor accounts lose money when trading CFDs with this provider. You should consider whether you understand how CFDs work and whether you can afford to take the high risk of losing your money.
Stratos Global LLC (tradu.com ):
Losses can exceed deposits.
Please be advised that the information presented on TradingView is provided to Tradu (‘Company’, ‘we’) by a third-party provider (‘TFA Global Pte Ltd’). Please be reminded that you are solely responsible for the trading decisions on your account. There is a very high degree of risk involved in trading. Any information and/or content is intended entirely for research, educational and informational purposes only and does not constitute investment or consultation advice or investment strategy. The information is not tailored to the investment needs of any specific person and therefore does not involve a consideration of any of the investment objectives, financial situation or needs of any viewer that may receive it. Kindly also note that past performance is not a reliable indicator of future results. Actual results may differ materially from those anticipated in forward-looking or past performance statements. We assume no liability as to the accuracy or completeness of any of the information and/or content provided herein and the Company cannot be held responsible for any omission, mistake nor for any loss or damage including without limitation to any loss of profit which may arise from reliance on any information supplied by TFA Global Pte Ltd.
The speaker(s) is neither an employee, agent nor representative of Tradu and is therefore acting independently. The opinions given are their own, constitute general market commentary, and do not constitute the opinion or advice of Tradu or any form of personal or investment advice. Tradu neither endorses nor guarantees offerings of third-party speakers, nor is Tradu responsible for the content, veracity or opinions of third-party speakers, presenters or participants.

Potential bearish reversal?AUD/JPY is reacting off the resistance level, which is a pullback resistance and could reverse from this level to our take profit.
Entry: 97.26
Why we like it:
There is a pullback resistance level.
Stop loss: 97.90
Why we like it:
There is a resistance level which aligns with the 161.8% Fibonacci extension.
Take profit: 96.18
Why we like it:
There is a pullback support that aligns with the 38.2% Fibonacci retracement.
Enjoying your TradingView experience? Review us!
Please be advised that the information presented on TradingView is provided to Vantage (‘Vantage Global Limited’, ‘we’) by a third-party provider (‘Everest Fortune Group’). Please be reminded that you are solely responsible for the trading decisions on your account. There is a very high degree of risk involved in trading. Any information and/or content is intended entirely for research, educational and informational purposes only and does not constitute investment or consultation advice or investment strategy. The information is not tailored to the investment needs of any specific person and therefore does not involve a consideration of any of the investment objectives, financial situation or needs of any viewer that may receive it. Kindly also note that past performance is not a reliable indicator of future results. Actual results may differ materially from those anticipated in forward-looking or past performance statements. We assume no liability as to the accuracy or completeness of any of the information and/or content provided herein and the Company cannot be held responsible for any omission, mistake nor for any loss or damage including without limitation to any loss of profit which may arise from reliance on any information supplied by Everest Fortune Group.

Bearish reversal off major resistance?NZD/JPY has rejected off the resistance level, which his an overlap resistance that aligns with the 61.8% Fibonacci projection and could drop from this level to our take profit.
Entry: 87.65
Why we like it:
There is an overlap resistance that aligns with the 61.8% Fibonacci projection.
Stop loss: 86.18
Why we like it:
There is a swing high resistance level.
Take profit: 87.07
Why we like it:
There is a pullback support that aligns with the 61.8% Fibonacci retracement.
Enjoying your TradingView experience? Review us!
Please be advised that the information presented on TradingView is provided to Vantage (‘Vantage Global Limited’, ‘we’) by a third-party provider (‘Everest Fortune Group’). Please be reminded that you are solely responsible for the trading decisions on your account. There is a very high degree of risk involved in trading. Any information and/or content is intended entirely for research, educational and informational purposes only and does not constitute investment or consultation advice or investment strategy. The information is not tailored to the investment needs of any specific person and therefore does not involve a consideration of any of the investment objectives, financial situation or needs of any viewer that may receive it. Kindly also note that past performance is not a reliable indicator of future results. Actual results may differ materially from those anticipated in forward-looking or past performance statements. We assume no liability as to the accuracy or completeness of any of the information and/or content provided herein and the Company cannot be held responsible for any omission, mistake nor for any loss or damage including without limitation to any loss of profit which may arise from reliance on any information supplied by Everest Fortune Group.

"Aha!" Moments Are Dangerous — Here’s Why You Shouldn’t Panic Just because a big options trade appears — doesn’t mean it’s a signal.
Options move every day.
Some trades are:
-Speculative
-Hedging plays
-Pure lottery tickets
Only a few carry real directional sentiment.
And learning to separate noise from signal?
That’s one of the most powerful skills a trader can develop — even if you never trade options yourself.
Let’s Look at JPY (See Chart)
On September 5, two large put portfolios appeared:
1. 0.0064 Put
2. 0.00635 Put
Both new, both with no prior open interest — so not a roll.
And yes — they’re larger than average.
To a beginner, this screams:
“JPY is going to crash — time to short everything!”
But let’s pause.
An experienced flow analyst would ask:
Is this really a bearish signal?
🔍 Here’s What the Data Says:
❗️Size ≠ Significance
Yes, the portfolios are big — but each costs ~$90K.
In institutional terms? Not massive.
❗️Delta is ~2%
That means less than 2% chance of expiring in the money.
❗️This Happens Often in JPY
Same strike (0.0064), same structure — appeared in the previous series.
Price never went near it.
No crash. No panic.
Just… nothing.
🧠 So Why Buy It?
I don’t know.
And I don’t need to.
Could be:
1️⃣A hedge for a larger book
2️⃣A counterparty agreement
3️⃣A some extra aggressive logic
But here’s what I do know:
Based on years of CME data and personal tracking —
Trades like this don’t cause market crashes.
They don’t move the needle.
They don’t change the trend.
✅ Final Takeaway:
Don’t react to the data headline.
Ask:
How likely is this to matter?
Is it priced in?
Has this happened before? Price reaction after big OTM options?
Because real edge isn’t in the "Aha!" moment —
It’s in the "Wait, let me check…" moment.

Bullish bounce?USD/JPY is falling towards the pivot and could bounce to the pullback resistance.
Pivot: 144.92
1st Support: 142.44
1st Resistance: 150.96
Disclaimer:
The above opinions given constitute general market commentary, and do not constitute the opinion or advice of IC Markets or any form of personal or investment advice.
Any opinions, news, research, analyses, prices, other information, or links to third-party sites contained on this website are provided on an "as-is" basis, are intended only to be informative, is not an advice nor a recommendation, nor research, or a record of our trading prices, or an offer of, or solicitation for a transaction in any financial instrument and thus should not be treated as such. The information provided does not involve any specific investment objectives, financial situation and needs of any specific person who may receive it. Please be aware, that past performance is not a reliable indicator of future performance and/or results. Past Performance or Forward-looking scenarios based upon the reasonable beliefs of the third-party provider are not a guarantee of future performance. Actual results may differ materially from those anticipated in forward-looking or past performance statements. IC Markets makes no representation or warranty and assumes no liability as to the accuracy or completeness of the information provided, nor any loss arising from any investment based on a recommendation, forecast or any information supplied by any third-party.

Political chaos in Japan collides with key chart setupsThe yen’s momentum reversed sharply on Friday, perhaps getting ahead of the weekend’s news. Japan’s Prime Minister Shigeru Ishiba announced his resignation following growing pressure within his party to accept responsibility for a historic loss of power in this year's election.
As the new trading week begins, the outlook for the yen remains fragile. Unless volatility in Japanese government bonds subsides, USD/JPY, EUR/JPY, and GBP/JPY potentially all look tilted to the upside.
This week’s domestic calendar will also draw attention, with final Q2 GDP, August producer inflation, machine tool orders, Reuters Tankan results, and key manufacturing sentiment surveys all in focus.
Bullish reversal in play?USD/JPY has bounced off the support level, which acts as a pullback support and could potentially rise from this level to our take profit.
Entry: 147.09
Why we like it:
There is a pullback support.
Stop loss: 146.62
Why we like it:
There is a pullback support.
Take profit: 147.92
Why we like it:
There is a pullback resistance that is slightly above the 50% Fibonacci retracement.
Enjoying your TradingView experience? Review us!
Please be advised that the information presented on TradingView is provided to Vantage (‘Vantage Global Limited’, ‘we’) by a third-party provider (‘Everest Fortune Group’). Please be reminded that you are solely responsible for the trading decisions on your account. There is a very high degree of risk involved in trading. Any information and/or content is intended entirely for research, educational and informational purposes only and does not constitute investment or consultation advice or investment strategy. The information is not tailored to the investment needs of any specific person and therefore does not involve a consideration of any of the investment objectives, financial situation or needs of any viewer that may receive it. Kindly also note that past performance is not a reliable indicator of future results. Actual results may differ materially from those anticipated in forward-looking or past performance statements. We assume no liability as to the accuracy or completeness of any of the information and/or content provided herein and the Company cannot be held responsible for any omission, mistake nor for any loss or damage including without limitation to any loss of profit which may arise from reliance on any information supplied by Everest Fortune Group.

USDJPY SELL SETUP SHOOOOOOOOOOOOOOOORTHELLO, How are you?
The price entered SUPPLY Zone ,then exited from it to under ,so I expected fall
especially It is in consolidation area and in premium zone
with downtrend on DAILY FRAME
so I WILL SELL ,but after confirmation

USDJPY Near 148.500 as Markets Await Key NFP PrintHey Traders, in today's trading session we are monitoring USDJPY for a potential selling opportunity around the 148.500 zone. The pair recently broke its uptrend structure and is now in a correction phase, approaching this important support/resistance level.
Structure: USDJPY shifted from an uptrend into a corrective move, with 148.500 acting as a retracement area of interest.
Key level in focus: 148.500 — a zone where sellers could regain control if bearish momentum builds.
Event risk – NFP scenarios:
Below 60k: Would likely trigger immediate USD weakness, keeping pressure on USDJPY and favoring further downside.
Between 80k–95k: Could produce an initial USD bounce, but the move may fade as markets recognize it’s still a soft jobs number.
Above 100k: Would complicate the bearish USD narrative, as stronger data may support the greenback.
Context: Overall, the bias leans toward USD weakness unless a clear upside surprise emerges from NFP. Watching how USDJPY reacts around 148.500 will be key into the weekly close.
Trade safe,
Joe.
