Bullish bounce off major support?USD/JPY has bounced off the pivot and could rise to the 1st resistance.
Pivot: 149.69
1st Support: 146.58
1st Resistance: 156.29
Disclaimer:
The above opinions given constitute general market commentary, and do not constitute the opinion or advice of IC Markets or any form of personal or investment advice.
Any opinions, news, research, analyses, prices, other information, or links to third-party sites contained on this website are provided on an "as-is" basis, are intended only to be informative, is not an advice nor a recommendation, nor research, or a record of our trading prices, or an offer of, or solicitation for a transaction in any financial instrument and thus should not be treated as such. The information provided does not involve any specific investment objectives, financial situation and needs of any specific person who may receive it. Please be aware, that past performance is not a reliable indicator of future performance and/or results. Past Performance or Forward-looking scenarios based upon the reasonable beliefs of the third-party provider are not a guarantee of future performance. Actual results may differ materially from those anticipated in forward-looking or past performance statements. IC Markets makes no representation or warranty and assumes no liability as to the accuracy or completeness of the information provided, nor any loss arising from any investment based on a recommendation, forecast or any information supplied by any third-party.
Jpy

GBP/JPY 4H Analysis A bit of a tricky one on GBPJPY, no clear formation, however, we still have that unaddressed gap that was formed in the previous week, maybe we can see that getting filled. Pin off the Mayo.

Can USDJPY Hold Below 152.000? Sellers on WatchHey Traders,
In today’s session, we’re monitoring USDJPY for a selling opportunity around the 152.000 zone.
The pair remains within a broader downtrend, and current price action shows a corrective move approaching a key resistance area.
A rejection from this level could reaffirm the prevailing bearish momentum, while a breakout above may challenge the current trend structure.
Trade safe,
Joe.

GBPJPY H1 | Heading Into 50% Fibonacci ResistanceGBP?JPY is rising towards the sell entry, which is a pullback resistance that aligns with the 50% Fibonacci retracement and could reverse from this level to the take profit.
Sell entry is at 202.58, which is a pullback resistance that aligns with the 50% Fibonacci retracement.
Stop loss is at 203.42, which is a multi-swing high resistance.
Take profit is at 201.43, which is a swing low support.
High Risk Investment Warning
Trading Forex/CFDs on margin carries a high level of risk and may not be suitable for all investors. Leverage can work against you.
Stratos Markets Limited (tradu.com ):
CFDs are complex instruments and come with a high risk of losing money rapidly due to leverage. 65% of retail investor accounts lose money when trading CFDs with this provider. You should consider whether you understand how CFDs work and whether you can afford to take the high risk of losing your money.
Stratos Europe Ltd (tradu.com ):
CFDs are complex instruments and come with a high risk of losing money rapidly due to leverage. 66% of retail investor accounts lose money when trading CFDs with this provider. You should consider whether you understand how CFDs work and whether you can afford to take the high risk of losing your money.
Stratos Global LLC (tradu.com ):
Losses can exceed deposits.
Please be advised that the information presented on TradingView is provided to Tradu (‘Company’, ‘we’) by a third-party provider (‘TFA Global Pte Ltd’). Please be reminded that you are solely responsible for the trading decisions on your account. There is a very high degree of risk involved in trading. Any information and/or content is intended entirely for research, educational and informational purposes only and does not constitute investment or consultation advice or investment strategy. The information is not tailored to the investment needs of any specific person and therefore does not involve a consideration of any of the investment objectives, financial situation or needs of any viewer that may receive it. Kindly also note that past performance is not a reliable indicator of future results. Actual results may differ materially from those anticipated in forward-looking or past performance statements. We assume no liability as to the accuracy or completeness of any of the information and/or content provided herein and the Company cannot be held responsible for any omission, mistake nor for any loss or damage including without limitation to any loss of profit which may arise from reliance on any information supplied by TFA Global Pte Ltd.
The speaker(s) is neither an employee, agent nor representative of Tradu and is therefore acting independently. The opinions given are their own, constitute general market commentary, and do not constitute the opinion or advice of Tradu or any form of personal or investment advice. Tradu neither endorses nor guarantees offerings of third-party speakers, nor is Tradu responsible for the content, veracity or opinions of third-party speakers, presenters or participants.

USDJPY H4 | Bearish Momentum To ExtendUSD/JPY has rejected off the sell entry, which is a pullback resistance and could potentially drop from this level to the downside.
Sell entry is at 151.08, which is a pullback resistance.
Stop loss is at 152.49, whichis a pullback resistance.
Take profit is at 148.77, which is a pullback support that is slightly below the 61.8% Fibonacci retracement.
High Risk Investment Warning
Trading Forex/CFDs on margin carries a high level of risk and may not be suitable for all investors. Leverage can work against you.
Stratos Markets Limited (tradu.com ):
CFDs are complex instruments and come with a high risk of losing money rapidly due to leverage. 65% of retail investor accounts lose money when trading CFDs with this provider. You should consider whether you understand how CFDs work and whether you can afford to take the high risk of losing your money.
Stratos Europe Ltd (tradu.com ):
CFDs are complex instruments and come with a high risk of losing money rapidly due to leverage. 66% of retail investor accounts lose money when trading CFDs with this provider. You should consider whether you understand how CFDs work and whether you can afford to take the high risk of losing your money.
Stratos Global LLC (tradu.com ):
Losses can exceed deposits.
Please be advised that the information presented on TradingView is provided to Tradu (‘Company’, ‘we’) by a third-party provider (‘TFA Global Pte Ltd’). Please be reminded that you are solely responsible for the trading decisions on your account. There is a very high degree of risk involved in trading. Any information and/or content is intended entirely for research, educational and informational purposes only and does not constitute investment or consultation advice or investment strategy. The information is not tailored to the investment needs of any specific person and therefore does not involve a consideration of any of the investment objectives, financial situation or needs of any viewer that may receive it. Kindly also note that past performance is not a reliable indicator of future results. Actual results may differ materially from those anticipated in forward-looking or past performance statements. We assume no liability as to the accuracy or completeness of any of the information and/or content provided herein and the Company cannot be held responsible for any omission, mistake nor for any loss or damage including without limitation to any loss of profit which may arise from reliance on any information supplied by TFA Global Pte Ltd.
The speaker(s) is neither an employee, agent nor representative of Tradu and is therefore acting independently. The opinions given are their own, constitute general market commentary, and do not constitute the opinion or advice of Tradu or any form of personal or investment advice. Tradu neither endorses nor guarantees offerings of third-party speakers, nor is Tradu responsible for the content, veracity or opinions of third-party speakers, presenters or participants.

Potential bearish drop off?USD/JPY has rejected off the pivot which is an overlap resistance and oculd drop to the 1st support.
Pivot: 151.14
1st Suport: 148.79
1st Resistance: 153.11
Disclaimer:
The above opinions given constitute general market commentary, and do not constitute the opinion or advice of IC Markets or any form of personal or investment advice.
Any opinions, news, research, analyses, prices, other information, or links to third-party sites contained on this website are provided on an "as-is" basis, are intended only to be informative, is not an advice nor a recommendation, nor research, or a record of our trading prices, or an offer of, or solicitation for a transaction in any financial instrument and thus should not be treated as such. The information provided does not involve any specific investment objectives, financial situation and needs of any specific person who may receive it. Please be aware, that past performance is not a reliable indicator of future performance and/or results. Past Performance or Forward-looking scenarios based upon the reasonable beliefs of the third-party provider are not a guarantee of future performance. Actual results may differ materially from those anticipated in forward-looking or past performance statements. IC Markets makes no representation or warranty and assumes no liability as to the accuracy or completeness of the information provided, nor any loss arising from any investment based on a recommendation, forecast or any information supplied by any third-party.

NZDJPY to find buyers at previous swing low?NZDJPY - 24h expiry
The previous swing low is located at 85.56.
85.38 has been pivotal.
50 4week EMA is at 85.66.
Early pessimism is likely to lead to losses although extended attempts lower are expected to fail.
Dip buying offers good risk/reward.
We look to Buy at 85.67 (stop at 85.17)
Our profit targets will be 87.17 and 87.37
Resistance: 86.84 / 87.46 / 87.75
Support: 86.33 / 86.00 / 85.38
Risk Disclaimer
The trade ideas beyond this page are for informational purposes only and do not constitute investment advice or a solicitation to trade. This information is provided by Signal Centre, a third-party unaffiliated with OANDA, and is intended for general circulation only. OANDA does not guarantee the accuracy of this information and assumes no responsibilities for the information provided by the third party. The information does not take into account the specific investment objectives, financial situation, or particular needs of any particular person. You should take into account your specific investment objectives, financial situation, and particular needs before making a commitment to trade, including seeking, under a separate engagement, as you deem fit.
You accept that you assume all risks in independently viewing the contents and selecting a chosen strategy.
Where the research is distributed in Singapore to a person who is not an Accredited Investor, Expert Investor or an Institutional Investor, Oanda Asia Pacific Pte Ltd (“OAP“) accepts legal responsibility for the contents of the report to such persons only to the extent required by law. Singapore customers should contact OAP at 6579 8289 for matters arising from, or in connection with, the information/research distributed.

US–China Tensions Put Pressure on AUDJPY Near 98.600!!Hey Traders,
In today’s session, we’re closely watching AUDJPY as price approaches the 98.600 zone, aligning with a key resistance level within the broader downtrend. After a short-term corrective move higher, the pair now faces an area that has historically acted as a turning point for sellers.
From a fundamental perspective, global sentiment appears to be tilting toward risk aversion once again.
Ongoing US–China tensions have reignited geopolitical uncertainty, with markets increasingly pricing in the possibility of further escalation. In such an environment, high-beta currencies like the AUD tend to underperform, while safe-haven flows favor the JPY.
If risk sentiment deteriorates further, AUDJPY could see renewed downside momentum from this resistance region.
Key zone: 98.600 — confluence of structure resistance and trend alignment.
Bias: Bearish while below this level.
Trade safe,
Joe.

Bullish reversal off major support?NZD/JPY is falling towards the pivot, which is a multi-swing low support level and could bounce to the pullback resistance.
Pivot: 85.65
1st Support: 84.74
1st Resistance: 86.43
Disclaimer:
The above opinions given constitute general market commentary, and do not constitute the opinion or advice of IC Markets or any form of personal or investment advice.
Any opinions, news, research, analyses, prices, other information, or links to third-party sites contained on this website are provided on an "as-is" basis, are intended only to be informative, is not an advice nor a recommendation, nor research, or a record of our trading prices, or an offer of, or solicitation for a transaction in any financial instrument and thus should not be treated as such. The information provided does not involve any specific investment objectives, financial situation and needs of any specific person who may receive it. Please be aware, that past performance is not a reliable indicator of future performance and/or results. Past Performance or Forward-looking scenarios based upon the reasonable beliefs of the third-party provider are not a guarantee of future performance. Actual results may differ materially from those anticipated in forward-looking or past performance statements. IC Markets makes no representation or warranty and assumes no liability as to the accuracy or completeness of the information provided, nor any loss arising from any investment based on a recommendation, forecast or any information supplied by any third-party.

usdjpy On the last day of last week, the sharp decline of this symbol caused the last 4-hour price low to disappear and in the meantime, it hit resistance near the last weekly candle formed.
There is a possibility of filling the price gap of last week.

GBP/JPY | Breakout Alert! (16.10.2025)The GBP/JPY pair on the M30 timeframe presents a Potential Buying Opportunity due to a recent Formation of a Wedge Breakout Pattern.
This suggests a shift in momentum towards the upside and a higher likelihood of further advances in the coming hours.
Possible Long Trade:
Entry: Consider Entering A Long Position around Trendline Of The Pattern.
Target Levels:
1st Resistance – 204.11
2nd Resistance – 201.77
#GBPJPY #Forex #TradingSetup #TechnicalAnalysis #Breakout #SupportAndResistance #Ichimoku #FX #Bullish #TradePlan
🎁 Please hit the like button and
🎁 Leave a comment to support for My Post !
Your likes and comments are incredibly motivating and will encourage me to share more analysis with you.
Disclaimer: This is for educational and analytical purposes only. Trading involves significant risk and is not suitable for everyone. Do your own research (DYOR) and always manage your risk. Never trade with money you cannot afford to lose. "Charts Don't Lie, Traders Don't Quit."
Best Regards, KABHI_TA_TRADING
Thank you.

GBPJPY H4 | Sharp Bearish ReversalGBP/JPY is reacting off the sell entry, whichis a pullback resistance that lines up with the 23.6% Fibonacci retracement and could drop from this level to veto the downside.
Sell entry is at 202.51, which is a pullback resistance that aligns with the 23.6% Fibonacci retracement
Stop loss is at 204.01, which is a pullback resistance that lines up with he 61.8% Fibonacci retracement.
Take profit is at 200.41, whichis a pullback support that aligns with the 61.8% Fibonacci retracement.
High Risk Investment Warning
Trading Forex/CFDs on margin carries a high level of risk and may not be suitable for all investors. Leverage can work against you.
Stratos Markets Limited (tradu.com ):
CFDs are complex instruments and come with a high risk of losing money rapidly due to leverage. 65% of retail investor accounts lose money when trading CFDs with this provider. You should consider whether you understand how CFDs work and whether you can afford to take the high risk of losing your money.
Stratos Europe Ltd (tradu.com ):
CFDs are complex instruments and come with a high risk of losing money rapidly due to leverage. 66% of retail investor accounts lose money when trading CFDs with this provider. You should consider whether you understand how CFDs work and whether you can afford to take the high risk of losing your money.
Stratos Global LLC (tradu.com ):
Losses can exceed deposits.
Please be advised that the information presented on TradingView is provided to Tradu (‘Company’, ‘we’) by a third-party provider (‘TFA Global Pte Ltd’). Please be reminded that you are solely responsible for the trading decisions on your account. There is a very high degree of risk involved in trading. Any information and/or content is intended entirely for research, educational and informational purposes only and does not constitute investment or consultation advice or investment strategy. The information is not tailored to the investment needs of any specific person and therefore does not involve a consideration of any of the investment objectives, financial situation or needs of any viewer that may receive it. Kindly also note that past performance is not a reliable indicator of future results. Actual results may differ materially from those anticipated in forward-looking or past performance statements. We assume no liability as to the accuracy or completeness of any of the information and/or content provided herein and the Company cannot be held responsible for any omission, mistake nor for any loss or damage including without limitation to any loss of profit which may arise from reliance on any information supplied by TFA Global Pte Ltd.
The speaker(s) is neither an employee, agent nor representative of Tradu and is therefore acting independently. The opinions given are their own, constitute general market commentary, and do not constitute the opinion or advice of Tradu or any form of personal or investment advice. Tradu neither endorses nor guarantees offerings of third-party speakers, nor is Tradu responsible for the content, veracity or opinions of third-party speakers, presenters or participants.

USDJPY – Demand Zone Retest | Bullish Reversal ExpectedFX:USDJPY
🟢
Structure | Trend | Key Reaction Zones
Price is testing the yellow demand zone (150.700 – 150.400), which aligns perfectly with the ascending channel’s lower boundary.
Structure remains bullish overall — the market is simply correcting after hitting upper-trend resistance.
A strong rejection from this demand area could initiate the next impulse leg toward the 152.600–153.300 zone.
Market Overview
USDJPY has been moving within a large ascending channel structure. After a sustained rally, price began to retrace, retesting the key demand zone that acted as a previous breakout base.
Buyers are expected to defend this region for continuation higher, targeting upper-channel liquidity zones and major resistance levels.
Confirmation will come from bullish engulfing or breakout candles off the yellow zone.
Key Scenarios
✅ Bullish Case 🚀 → 🎯 Target 1 152.050 | 🎯 Target 2 152.600 | 🎯 Target 3 153.300
❌ Bearish Case 📉 → Close below 150.400 may extend downside toward 149.500 support
Current Levels to Watch
Resistance 🔴 152.050 – 152.600
Support 🟢 150.700 – 150.400
⚠️ Disclaimer: This analysis is for educational purposes only. Not financial advice.

Bearish drop off in play?USD/JPY has rejected off the pivot which is an overlap resistance that aligns with the 50% Fibonacci retracement and could drop to the 1st support.
Pivot: 151.60
1st Support: 149.90
1st Resistance: 152.43
Disclaimer:
The above opinions given constitute general market commentary, and do not constitute the opinion or advice of IC Markets or any form of personal or investment advice.
Any opinions, news, research, analyses, prices, other information, or links to third-party sites contained on this website are provided on an "as-is" basis, are intended only to be informative, is not an advice nor a recommendation, nor research, or a record of our trading prices, or an offer of, or solicitation for a transaction in any financial instrument and thus should not be treated as such. The information provided does not involve any specific investment objectives, financial situation and needs of any specific person who may receive it. Please be aware, that past performance is not a reliable indicator of future performance and/or results. Past Performance or Forward-looking scenarios based upon the reasonable beliefs of the third-party provider are not a guarantee of future performance. Actual results may differ materially from those anticipated in forward-looking or past performance statements. IC Markets makes no representation or warranty and assumes no liability as to the accuracy or completeness of the information provided, nor any loss arising from any investment based on a recommendation, forecast or any information supplied by any third-party.

GBPJPY starting a new multi-year Bear Cycle.The GBPJPY pair gave us recently (October 02, see chart below) an excellent buy signal on the 1D MA100, which instantly hit our 201.200 Target:
This time we view the market on the longest scale possible, the 1M time-frame, where since August 1990 High, it has been declining under the pressure of a Lower Highs trend-line.
The price is approaching that Lower Highs trend-line again after more than 18 years and in our perspective, sell any rally is the way to go long-term as it has much greater return potential than risk.
The first two Bearish Legs of this pattern (Bear Cycles) have declined by around -55%, the next one was shorter at -37.35%. As a result, we expect a minimum of -37.35% decline from the Lower Highs trend-line, which gives us a long-term Target of 136.000.
It is worth pointing out that the 1M Golden Cross that was priced in December 2023, is a formation that last time it emerged (December 2005), preceded a market Top. Also notice the presence of the 1M RSI Resistance Zone, which is holding since 1990 and when the RSI double tops there, it has been the most reliable Sell Signal.
-------------------------------------------------------------------------------
** Please LIKE 👍, FOLLOW ✅, SHARE 🙌 and COMMENT ✍ if you enjoy this idea! Also share your ideas and charts in the comments section below! This is best way to keep it relevant, support us, keep the content here free and allow the idea to reach as many people as possible. **
-------------------------------------------------------------------------------
💸💸💸💸💸💸
👇 👇 👇 👇 👇 👇

Falling towards 50% FIbonacci support?EUR/JPY is falling towards the support level, which is an overlap support that aligns with the 50% Fibonacci retracement and could bounce from this level to our take profit.
Entry: 175.04
Why we like it:
There is a pullback support that aligns with hte 50% Fibonacci retracement.
Stop loss: 173.74
Why we like it:
There is a pullback support that is slightly above the 78/.5% Fibonacci retracement.
Take profit: 176.55
Why we like it:
There is a pullback resistance level.
Enjoying your TradingView experience? Review us!
Please be advised that the information presented on TradingView is provided to Vantage (‘Vantage Global Limited’, ‘we’) by a third-party provider (‘Everest Fortune Group’). Please be reminded that you are solely responsible for the trading decisions on your account. There is a very high degree of risk involved in trading. Any information and/or content is intended entirely for research, educational and informational purposes only and does not constitute investment or consultation advice or investment strategy. The information is not tailored to the investment needs of any specific person and therefore does not involve a consideration of any of the investment objectives, financial situation or needs of any viewer that may receive it. Kindly also note that past performance is not a reliable indicator of future results. Actual results may differ materially from those anticipated in forward-looking or past performance statements. We assume no liability as to the accuracy or completeness of any of the information and/or content provided herein and the Company cannot be held responsible for any omission, mistake nor for any loss or damage including without limitation to any loss of profit which may arise from reliance on any information supplied by Everest Fortune Group.
GBPJPY H1 | Signs of a Bearish ReversalBased on the H1 chart analysis, we can see that the price is reacting off the sell entry, which is a pullback resistance, and could drop from this level to the take profit.
Sell entry is at 202.22, whichis a pullback resistance.
Stop loss is at 203.41, which is a swing high resistance.
Take profit is at 200.49, whichis a pullback support that line sup with the 78.6% Fibonacci projection.
High Risk Investment Warning
Trading Forex/CFDs on margin carries a high level of risk and may not be suitable for all investors. Leverage can work against you.
Stratos Markets Limited (tradu.com):
CFDs are complex instruments and come with a high risk of losing money rapidly due to leverage. 65% of retail investor accounts lose money when trading CFDs with this provider. You should consider whether you understand how CFDs work and whether you can afford to take the high risk of losing your money.
Stratos Europe Ltd (tradu.com ):
CFDs are complex instruments and come with a high risk of losing money rapidly due to leverage. 66% of retail investor accounts lose money when trading CFDs with this provider. You should consider whether you understand how CFDs work and whether you can afford to take the high risk of losing your money.
Stratos Global LLC (tradu.com ):
Losses can exceed deposits.
Please be advised that the information presented on TradingView is provided to Tradu (‘Company’, ‘we’) by a third-party provider (‘TFA Global Pte Ltd’). Please be reminded that you are solely responsible for the trading decisions on your account. There is a very high degree of risk involved in trading. Any information and/or content is intended entirely for research, educational and informational purposes only and does not constitute investment or consultation advice or investment strategy. The information is not tailored to the investment needs of any specific person and therefore does not involve a consideration of any of the investment objectives, financial situation or needs of any viewer that may receive it. Kindly also note that past performance is not a reliable indicator of future results. Actual results may differ materially from those anticipated in forward-looking or past performance statements. We assume no liability as to the accuracy or completeness of any of the information and/or content provided herein and the Company cannot be held responsible for any omission, mistake nor for any loss or damage including without limitation to any loss of profit which may arise from reliance on any information supplied by TFA Global Pte Ltd.
The speaker(s) is neither an employee, agent nor representative of Tradu and is therefore acting independently. The opinions given are their own, constitute general market commentary, and do not constitute the opinion or advice of Tradu or any form of personal or investment advice. Tradu neither endorses nor guarantees offerings of third-party speakers, nor is Tradu responsible for the content, veracity or opinions of third-party speakers, presenters or participants.

USDJPY H1 | Bearish Drop-Off in MomentumUSD/JPY has rejected off the sell entry, which is a pullback resistance and could drop from this levle to the downside.
Sell entry is at 152.43, whichis a pullback resistance.
Stop loss is at 153.21, whichis a swing high resistance.
Take profit is at 150.50, whichis a pullback support that is slightly below the 50% Fibonacci retracement.
High Risk Investment Warning
Trading Forex/CFDs on margin carries a high level of risk and may not be suitable for all investors. Leverage can work against you.
Stratos Markets Limited (tradu.com/uk ):
CFDs are complex instruments and come with a high risk of losing money rapidly due to leverage. 65% of retail investor accounts lose money when trading CFDs with this provider. You should consider whether you understand how CFDs work and whether you can afford to take the high risk of losing your money.
Stratos Europe Ltd (tradu.com/eu ):
CFDs are complex instruments and come with a high risk of losing money rapidly due to leverage. 66% of retail investor accounts lose money when trading CFDs with this provider. You should consider whether you understand how CFDs work and whether you can afford to take the high risk of losing your money.
Stratos Global LLC (tradu.com/en ):
Losses can exceed deposits.
Please be advised that the information presented on TradingView is provided to Tradu (‘Company’, ‘we’) by a third-party provider (‘TFA Global Pte Ltd’). Please be reminded that you are solely responsible for the trading decisions on your account. There is a very high degree of risk involved in trading. Any information and/or content is intended entirely for research, educational and informational purposes only and does not constitute investment or consultation advice or investment strategy. The information is not tailored to the investment needs of any specific person and therefore does not involve a consideration of any of the investment objectives, financial situation or needs of any viewer that may receive it. Kindly also note that past performance is not a reliable indicator of future results. Actual results may differ materially from those anticipated in forward-looking or past performance statements. We assume no liability as to the accuracy or completeness of any of the information and/or content provided herein and the Company cannot be held responsible for any omission, mistake nor for any loss or damage including without limitation to any loss of profit which may arise from reliance on any information supplied by TFA Global Pte Ltd.
The speaker(s) is neither an employee, agent nor representative of Tradu and is therefore acting independently. The opinions given are their own, constitute general market commentary, and do not constitute the opinion or advice of Tradu or any form of personal or investment advice. Tradu neither endorses nor guarantees offerings of third-party speakers, nor is Tradu responsible for the content, veracity or opinions of third-party speakers, presenters or participants.

USDJPY (15M) – Demand Zone Reversal Setup FX:USDJPY
🚀
Structure | Trend | Key Reaction Zones
Price has tapped into the strong yellow demand zone, showing initial rejection wicks.
Structure forming a potential double bottom pattern, hinting at early bullish pressure.
Descending structure lines show a clear breakout point near 152.05 where momentum could shift.
Market Overview
USDJPY is trading within a compression channel after a heavy correction phase. The recent touch into the 151.60–151.65 zone confirms institutional demand. If buyers maintain pressure above this base, we could see a clean bullish continuation toward the 152.05–152.60 resistance zone. Patience for confirmation candle or BOS (Break of Structure) above 151.90 is key before entry.
Key Scenarios
✅ Bullish Case 🚀 → 🎯 Target 1: 152.05 → 🎯 Target 2: 152.60
❌ Bearish Case 📉 → Invalidation below 151.50
Current Levels to Watch
Resistance 🔴: 152.05 – 152.60
Support 🟢: 151.60 – 151.50
⚠️ Disclaimer: This analysis is for educational purposes only. Not financial advice.

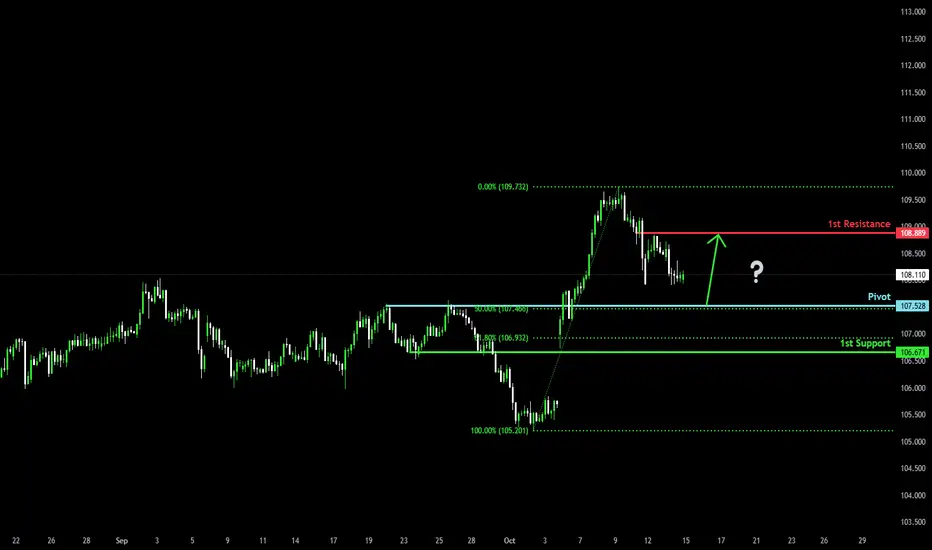
Falling towards 50% Fibonacci support?CAD/JPY is falling towards the pivot, which has been identified as a pullback support that lines up with the 50% Fibonacci retracement and could bounce from this level to the 1st resistance.
Pivot: 107.52
1st Support: 106.67
1st Resistance: 108.88
Disclaimer:
The above opinions given constitute general market commentary, and do not constitute the opinion or advice of IC Markets or any form of personal or investment advice.
Any opinions, news, research, analyses, prices, other information, or links to third-party sites contained on this website are provided on an "as-is" basis, are intended only to be informative, is not an advice nor a recommendation, nor research, or a record of our trading prices, or an offer of, or solicitation for a transaction in any financial instrument and thus should not be treated as such. The information provided does not involve any specific investment objectives, financial situation and needs of any specific person who may receive it. Please be aware, that past performance is not a reliable indicator of future performance and/or results. Past Performance or Forward-looking scenarios based upon the reasonable beliefs of the third-party provider are not a guarantee of future performance. Actual results may differ materially from those anticipated in forward-looking or past performance statements. IC Markets makes no representation or warranty and assumes no liability as to the accuracy or completeness of the information provided, nor any loss arising from any investment based on a recommendation, forecast or any information supplied by any third-party.
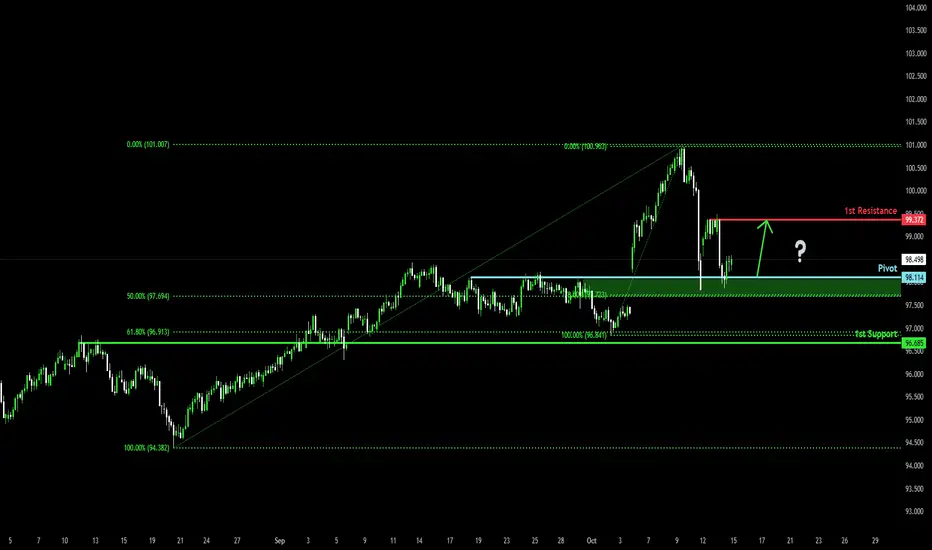
Bullish bounce off?AUD/JPY has bounced off the pivot and could potentially rise to the pullback resistance.
Pivot: 98.11
1st Support: 96.68
1st Resistance: 99.37
Disclaimer:
The above opinions given constitute general market commentary, and do not constitute the opinion or advice of IC Markets or any form of personal or investment advice.
Any opinions, news, research, analyses, prices, other information, or links to third-party sites contained on this website are provided on an "as-is" basis, are intended only to be informative, is not an advice nor a recommendation, nor research, or a record of our trading prices, or an offer of, or solicitation for a transaction in any financial instrument and thus should not be treated as such. The information provided does not involve any specific investment objectives, financial situation and needs of any specific person who may receive it. Please be aware, that past performance is not a reliable indicator of future performance and/or results. Past Performance or Forward-looking scenarios based upon the reasonable beliefs of the third-party provider are not a guarantee of future performance. Actual results may differ materially from those anticipated in forward-looking or past performance statements. IC Markets makes no representation or warranty and assumes no liability as to the accuracy or completeness of the information provided, nor any loss arising from any investment based on a recommendation, forecast or any information supplied by any third-party.
Bearish drop?NZD/JPY is rising towards the pivot which is an overlap resistance that aligns with the 38.2% Fibonacci retracement and could reverse to the 1st support.
Pivot: 87.27
1st Support: 85.72
1st Resistance: 88.03
Disclaimer:
The above opinions given constitute general market commentary, and do not constitute the opinion or advice of IC Markets or any form of personal or investment advice.
Any opinions, news, research, analyses, prices, other information, or links to third-party sites contained on this website are provided on an "as-is" basis, are intended only to be informative, is not an advice nor a recommendation, nor research, or a record of our trading prices, or an offer of, or solicitation for a transaction in any financial instrument and thus should not be treated as such. The information provided does not involve any specific investment objectives, financial situation and needs of any specific person who may receive it. Please be aware, that past performance is not a reliable indicator of future performance and/or results. Past Performance or Forward-looking scenarios based upon the reasonable beliefs of the third-party provider are not a guarantee of future performance. Actual results may differ materially from those anticipated in forward-looking or past performance statements. IC Markets makes no representation or warranty and assumes no liability as to the accuracy or completeness of the information provided, nor any loss arising from any investment based on a recommendation, forecast or any information supplied by any third-party.

Bearish reversal in play?USD/JPY has rejected off the rersistance level which is a pullback resistance and could drop from this level too ur take profit.
Entry: 152.44
Why we like it:
There is a pullback resistance level.
Stop lodd: 153.25
Why we ike it:
There is a swing high resistance level.
Take profit: 150.42
Why we like it:
There is a pullback support that lines up with the 145% Fibonacci extension.
Enjoying your TradingView experience? Review us!
Please be advised that the information presented on TradingView is provided to Vantage (‘Vantage Global Limited’, ‘we’) by a third-party provider (‘Everest Fortune Group’). Please be reminded that you are solely responsible for the trading decisions on your account. There is a very high degree of risk involved in trading. Any information and/or content is intended entirely for research, educational and informational purposes only and does not constitute investment or consultation advice or investment strategy. The information is not tailored to the investment needs of any specific person and therefore does not involve a consideration of any of the investment objectives, financial situation or needs of any viewer that may receive it. Kindly also note that past performance is not a reliable indicator of future results. Actual results may differ materially from those anticipated in forward-looking or past performance statements. We assume no liability as to the accuracy or completeness of any of the information and/or content provided herein and the Company cannot be held responsible for any omission, mistake nor for any loss or damage including without limitation to any loss of profit which may arise from reliance on any information supplied by Everest Fortune Group.
