Falling towards pullback support?USD/JPY is falling towards the support level, which is a pullback support that is slightly above the 50% Fibonacci retracement and also aligns with the 100% Fibonacci projection, and could bounce from this level to our take profit.
Entry: 149.87
Why we like it:
There is a pullback support level that is slightly above the 50% Fibonacci retracement and also aligns with the 100% Fibonacci projection.
Stop loss: 148.61
Why we like it:
There is a pullback support that aligns with the 61.8% Fibonacci retracement.
Take profit: 153.07
Why we like it:
There is a swing high resistance level.
Enjoying your TradingView experience? Review us!
Please be advised that the information presented on TradingView is provided to Vantage (‘Vantage Global Limited’, ‘we’) by a third-party provider (‘Everest Fortune Group’). Please be reminded that you are solely responsible for the trading decisions on your account. There is a very high degree of risk involved in trading. Any information and/or content is intended entirely for research, educational and informational purposes only and does not constitute investment or consultation advice or investment strategy. The information is not tailored to the investment needs of any specific person and therefore does not involve a consideration of any of the investment objectives, financial situation or needs of any viewer that may receive it. Kindly also note that past performance is not a reliable indicator of future results. Actual results may differ materially from those anticipated in forward-looking or past performance statements. We assume no liability as to the accuracy or completeness of any of the information and/or content provided herein and the Company cannot be held responsible for any omission, mistake nor for any loss or damage including without limitation to any loss of profit which may arise from reliance on any information supplied by Everest Fortune Group.
Jpy

GBPJPY H1 | Bearish Drop-Off AheadGBP/JPY is rising towards the sell entry, which is a pullback resistance that lines up with the 38.2% Fibonacci retracement and could drop from this level to the downside.
Sell entry is at 203.18, which is a pullback resistance that aligns with the 38.2% Fibonacci retracement.
Stop loss is at 204.63, which is a pullback resistance that is slightly below the 78.6% Fibonacci retracement.
Take profit is at 202.12, which is an overlap support that is slightly below the 38.2% Fibonacci retracement.
High Risk Investment Warning
Trading Forex/CFDs on margin carries a high level of risk and may not be suitable for all investors. Leverage can work against you.
Stratos Markets Limited (tradu.com ):
CFDs are complex instruments and come with a high risk of losing money rapidly due to leverage. 65% of retail investor accounts lose money when trading CFDs with this provider. You should consider whether you understand how CFDs work and whether you can afford to take the high risk of losing your money.
Stratos Europe Ltd (tradu.com ):
CFDs are complex instruments and come with a high risk of losing money rapidly due to leverage. 66% of retail investor accounts lose money when trading CFDs with this provider. You should consider whether you understand how CFDs work and whether you can afford to take the high risk of losing your money.
Stratos Global LLC (tradu.com ):
Losses can exceed deposits.
Please be advised that the information presented on TradingView is provided to Tradu (‘Company’, ‘we’) by a third-party provider (‘TFA Global Pte Ltd’). Please be reminded that you are solely responsible for the trading decisions on your account. There is a very high degree of risk involved in trading. Any information and/or content is intended entirely for research, educational and informational purposes only and does not constitute investment or consultation advice or investment strategy. The information is not tailored to the investment needs of any specific person and therefore does not involve a consideration of any of the investment objectives, financial situation or needs of any viewer that may receive it. Kindly also note that past performance is not a reliable indicator of future results. Actual results may differ materially from those anticipated in forward-looking or past performance statements. We assume no liability as to the accuracy or completeness of any of the information and/or content provided herein and the Company cannot be held responsible for any omission, mistake nor for any loss or damage including without limitation to any loss of profit which may arise from reliance on any information supplied by TFA Global Pte Ltd.
The speaker(s) is neither an employee, agent nor representative of Tradu and is therefore acting independently. The opinions given are their own, constitute general market commentary, and do not constitute the opinion or advice of Tradu or any form of personal or investment advice. Tradu neither endorses nor guarantees offerings of third-party speakers, nor is Tradu responsible for the content, veracity or opinions of third-party speakers, presenters or participants.

Bullish bounce off pullback support?GBP/JPY is falling towards the pivot which is a pullback support that lines up with the 50% Fibonacci retracement and could bounce to the 1st resistance, which acts as a swing high resistance.
Pivot: 201.34
1st Support: 199.28
1st Resistance: 204.81
Disclaimer:
The above opinions given constitute general market commentary, and do not constitute the opinion or advice of IC Markets or any form of personal or investment advice.
Any opinions, news, research, analyses, prices, other information, or links to third-party sites contained on this website are provided on an "as-is" basis, are intended only to be informative, is not an advice nor a recommendation, nor research, or a record of our trading prices, or an offer of, or solicitation for a transaction in any financial instrument and thus should not be treated as such. The information provided does not involve any specific investment objectives, financial situation and needs of any specific person who may receive it. Please be aware, that past performance is not a reliable indicator of future performance and/or results. Past Performance or Forward-looking scenarios based upon the reasonable beliefs of the third-party provider are not a guarantee of future performance. Actual results may differ materially from those anticipated in forward-looking or past performance statements. IC Markets makes no representation or warranty and assumes no liability as to the accuracy or completeness of the information provided, nor any loss arising from any investment based on a recommendation, forecast or any information supplied by any third-party.

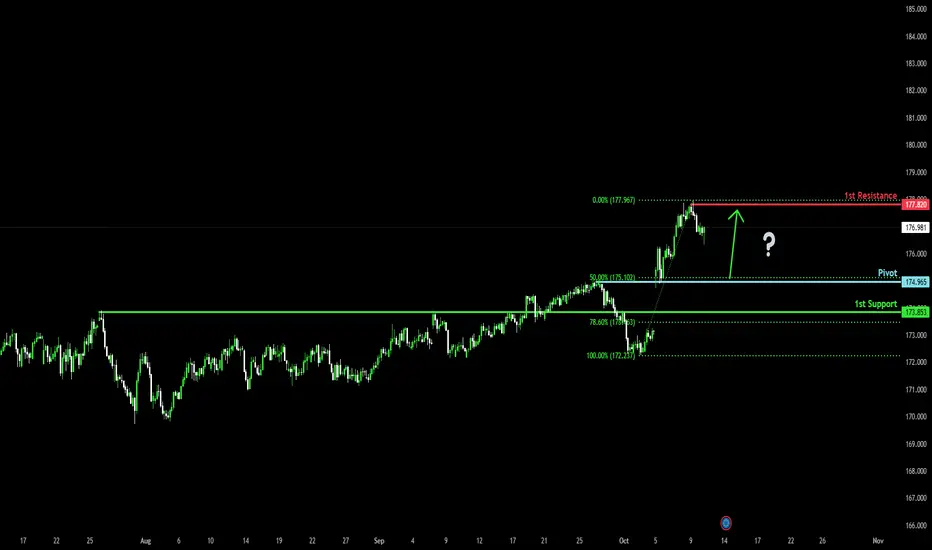
Potential bullish bounce?EUR/JPY is falling towards the pivot, which acts as an overlap support that aligns with the 50% Fibonacci retracemnt and could bounce to the swing high resistance.
Pivot: 174.96
1st Support: 173.85
1st Resistance: 177.82
Disclaimer:
The above opinions given constitute general market commentary, and do not constitute the opinion or advice of IC Markets or any form of personal or investment advice.
Any opinions, news, research, analyses, prices, other information, or links to third-party sites contained on this website are provided on an "as-is" basis, are intended only to be informative, is not an advice nor a recommendation, nor research, or a record of our trading prices, or an offer of, or solicitation for a transaction in any financial instrument and thus should not be treated as such. The information provided does not involve any specific investment objectives, financial situation and needs of any specific person who may receive it. Please be aware, that past performance is not a reliable indicator of future performance and/or results. Past Performance or Forward-looking scenarios based upon the reasonable beliefs of the third-party provider are not a guarantee of future performance. Actual results may differ materially from those anticipated in forward-looking or past performance statements. IC Markets makes no representation or warranty and assumes no liability as to the accuracy or completeness of the information provided, nor any loss arising from any investment based on a recommendation, forecast or any information supplied by any third-party.
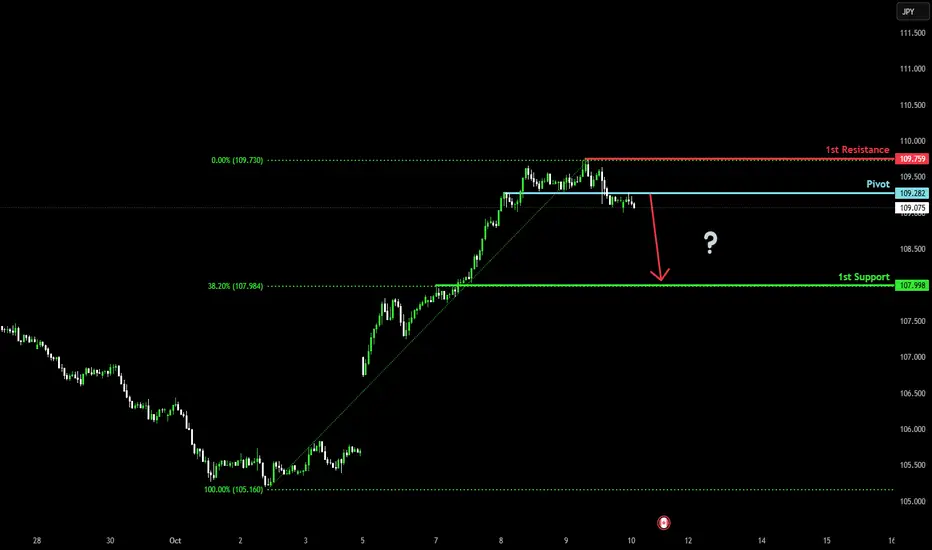
Could we see a bearish reversal?CAD/JPY is reacting off the pivot and could potentially drop to the 1st support.
Pivot: 109.28
1st Support: 107.99
1st Resistance: 109.75
Disclaimer:
The above opinions given constitute general market commentary, and do not constitute the opinion or advice of IC Markets or any form of personal or investment advice.
Any opinions, news, research, analyses, prices, other information, or links to third-party sites contained on this website are provided on an "as-is" basis, are intended only to be informative, is not an advice nor a recommendation, nor research, or a record of our trading prices, or an offer of, or solicitation for a transaction in any financial instrument and thus should not be treated as such. The information provided does not involve any specific investment objectives, financial situation and needs of any specific person who may receive it. Please be aware, that past performance is not a reliable indicator of future performance and/or results. Past Performance or Forward-looking scenarios based upon the reasonable beliefs of the third-party provider are not a guarantee of future performance. Actual results may differ materially from those anticipated in forward-looking or past performance statements. IC Markets makes no representation or warranty and assumes no liability as to the accuracy or completeness of the information provided, nor any loss arising from any investment based on a recommendation, forecast or any information supplied by any third-party.
Yen Slips as New Fiscal Policies Emerge:GBPJPY Watching 203.900!Hey Traders,
In today’s session, we’re monitoring GBPJPY for a potential buying opportunity around the 203.900 zone. The pair remains in a broader bullish structure, and price is currently in a corrective phase, approaching a key trendline and support confluence near 203.900.
On the fundamental side, Japan’s latest election outcome brought a notable shift — a fiscally loose administration expected to keep stimulus running while maintaining pressure on the Bank of Japan to avoid tightening. This mix of expansive fiscal policy and dovish monetary stance could continue to weigh on the Yen, offering support to GBPJPY upside momentum in the short term.
Trade safe,
Joe.

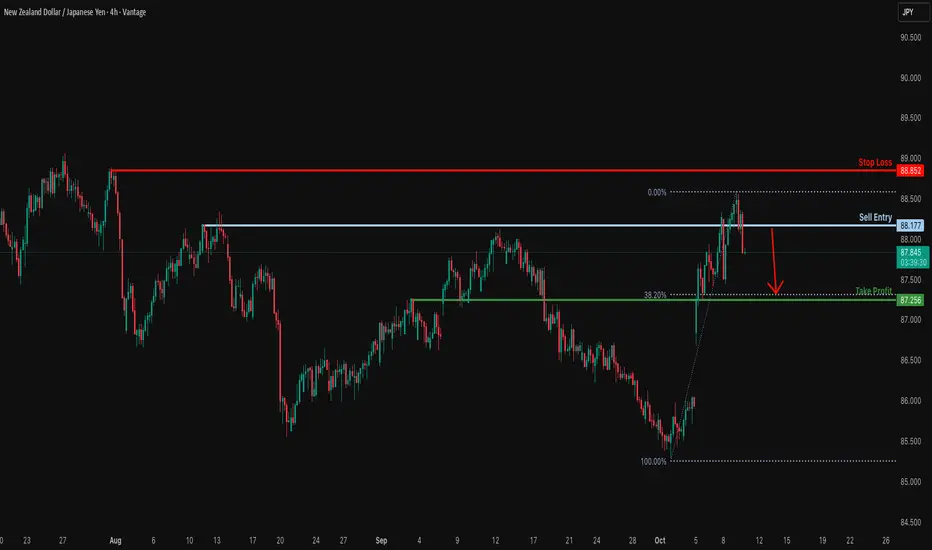
Bearish reversal setup?NZD/JPY is rising towards the resistance level, which is a pullback resistance and could reverse from this level to our take profit.
Entry: 88.17
Why we like it:
There is a pullback resistance level.
Stop loss: 88.85
Why we like it:
There is a swing high resistance level.
Take profit: 87.25
Why we like it:
There is a pullback support that aligns with the 38.2% Fibonacci retracement.
Enjoying your TradingView experience? Review us!
Please be advised that the information presented on TradingView is provided to Vantage (‘Vantage Global Limited’, ‘we’) by a third-party provider (‘Everest Fortune Group’). Please be reminded that you are solely responsible for the trading decisions on your account. There is a very high degree of risk involved in trading. Any information and/or content is intended entirely for research, educational and informational purposes only and does not constitute investment or consultation advice or investment strategy. The information is not tailored to the investment needs of any specific person and therefore does not involve a consideration of any of the investment objectives, financial situation or needs of any viewer that may receive it. Kindly also note that past performance is not a reliable indicator of future results. Actual results may differ materially from those anticipated in forward-looking or past performance statements. We assume no liability as to the accuracy or completeness of any of the information and/or content provided herein and the Company cannot be held responsible for any omission, mistake nor for any loss or damage including without limitation to any loss of profit which may arise from reliance on any information supplied by Everest Fortune Group.
NZDJPY to find sellers at current market price?NZDJPY - 24h expiry
The previous swing high is located at 88.36.
88.13 has been pivotal.
Trading volume is increasing.
Early optimism is likely to lead to gains although extended attempts higher are expected to fail.
The primary trend remains bearish.
We look to Sell at 88.10 (stop at 88.60)
Our profit targets will be 86.60 and 86.23
Resistance: 87.94 / 88.13 / 88.36
Support: 87.42 / 87.25 / 86.71
Risk Disclaimer
The trade ideas beyond this page are for informational purposes only and do not constitute investment advice or a solicitation to trade. This information is provided by Signal Centre, a third-party unaffiliated with OANDA, and is intended for general circulation only. OANDA does not guarantee the accuracy of this information and assumes no responsibilities for the information provided by the third party. The information does not take into account the specific investment objectives, financial situation, or particular needs of any particular person. You should take into account your specific investment objectives, financial situation, and particular needs before making a commitment to trade, including seeking, under a separate engagement, as you deem fit.
You accept that you assume all risks in independently viewing the contents and selecting a chosen strategy.
Where the research is distributed in Singapore to a person who is not an Accredited Investor, Expert Investor or an Institutional Investor, Oanda Asia Pacific Pte Ltd (“OAP“) accepts legal responsibility for the contents of the report to such persons only to the extent required by law. Singapore customers should contact OAP at 6579 8289 for matters arising from, or in connection with, the information/research distributed.

NZDJPY – Retesting Upper Channel: Looking for Shorts!NZDJPY remains inside a falling channel on the 4H.
Price just spiked back into the upper trendline / supply (87.40–87.80), where sellers have reacted before.
As long as this red zone holds, I’ll look for lower-high + break-of-structure sell setups toward 86.30, then the 85.40–85.00 channel low.
A clean 4H close above ~88.00 would invalidate the idea and open room for 88.70–89.00.
⚠️ Disclaimer: This is not financial advice. Always do your own research and manage risk properly.
📚 Stick to your trading plan regarding entries, risk, and management.
Good luck! 🍀
All Strategies Are Good; If Managed Properly!
~Richard Nasr

Bullish momentum to extend?USD/JPY could fall to the pivot, and a bounce from this level could lead the price to rise to the 1st resistance.
Pivot: 148.79
1st Support: 147.55
1st Resistance: 152.09
Disclaimer:
The above opinions given constitute general market commentary, and do not constitute the opinion or advice of IC Markets or any form of personal or investment advice.
Any opinions, news, research, analyses, prices, other information, or links to third-party sites contained on this website are provided on an "as-is" basis, are intended only to be informative, is not an advice nor a recommendation, nor research, or a record of our trading prices, or an offer of, or solicitation for a transaction in any financial instrument and thus should not be treated as such. The information provided does not involve any specific investment objectives, financial situation and needs of any specific person who may receive it. Please be aware, that past performance is not a reliable indicator of future performance and/or results. Past Performance or Forward-looking scenarios based upon the reasonable beliefs of the third-party provider are not a guarantee of future performance. Actual results may differ materially from those anticipated in forward-looking or past performance statements. IC Markets makes no representation or warranty and assumes no liability as to the accuracy or completeness of the information provided, nor any loss arising from any investment based on a recommendation, forecast or any information supplied by any third-party.

Bullish momentum to extend?NZD/JPY could fall toward the support level, which is a pullback support that aligns with the 38.2% Fibonacci retracement and could bounce from this level to our take profit.
Entry: 86.75
Why we like it:
There is a pullback support that aligns with the 38.2% Fibonacci retracement.
Stop loss: 86.08
Why we like it:
There is a pullback support that lines up with the 61.8% Fibonacci retracement.
Take profit: 88.04
Why we like it:
There is a swing high resistance level.
Enjoying your TradingView experience? Review us!
Please be advised that the information presented on TradingView is provided to Vantage (‘Vantage Global Limited’, ‘we’) by a third-party provider (‘Everest Fortune Group’). Please be reminded that you are solely responsible for the trading decisions on your account. There is a very high degree of risk involved in trading. Any information and/or content is intended entirely for research, educational and informational purposes only and does not constitute investment or consultation advice or investment strategy. The information is not tailored to the investment needs of any specific person and therefore does not involve a consideration of any of the investment objectives, financial situation or needs of any viewer that may receive it. Kindly also note that past performance is not a reliable indicator of future results. Actual results may differ materially from those anticipated in forward-looking or past performance statements. We assume no liability as to the accuracy or completeness of any of the information and/or content provided herein and the Company cannot be held responsible for any omission, mistake nor for any loss or damage including without limitation to any loss of profit which may arise from reliance on any information supplied by Everest Fortune Group.

AUDJPY — Buy the Retest?AUDJPY remains overall bullish inside a rising channel. Price is hovering above a 96.0–96.5 support zone, which previously acted as resistance and now aligns with the channel’s lower boundary, a solid confluence area.
🔑 Key levels
Support: 96.0–96.5 (zone to watch for bullish rejection)
Resistance: 98.5 then 100.0 (round number / channel upper band)
📊 Scenarios
Bullish 📈 If price retests 96.0–96.5 and prints confirmation (higher low / bullish candle), I’ll look for longs toward 98.5 → 100.0.
Bearish 📉 A daily close below 96.0 would invalidate the setup and open room toward the next liquidity pocket near the channel low.
What’s your plan here => wait for the retest into 96s, or trade the continuation if momentum kicks in first? 🤔
⚠️ Disclaimer: This is not financial advice. Always do your own research and manage risk properly.
📚 Stick to your trading plan regarding entries, risk, and management.
Good luck! 🍀
All Strategies Are Good; If Managed Properly!
~Richard Nasr

USDJPY - Range Floor + Trend Support = ConfluenceUSDJPY remains overall bullish within a rising channel, while price has been ranging between a lower demand band and the upper supply.
We’re now dipping into the 146.0–146.7 support area, which aligns with the channel’s lower boundary — a classic confluence zone to hunt for longs.
🔑 Key levels
Support: 146.0–146.7 (range floor + channel support)
Resistance: 149.8–151.0 (range top / supply)
📊 Scenarios
Bullish 📈 Look for a higher-low / bullish candle from 146s → path toward 149.8–151.0.
Bearish 📉 Daily close below 146.0 would invalidate the setup and open a deeper pullback before buyers try again.
Do you buy the retest into the 146s, or wait for momentum to kick in first? 🤔
⚠️ Disclaimer: This is not financial advice. Always do your own research and manage risk properly.
📚 Stick to your trading plan regarding entries, risk, and management.
Good luck! 🍀
All Strategies Are Good; If Managed Properly!
~Richard Nasr

GBPJPY H4 | Potential Bearish Reversal FormingGBP/JPY is rising towards the sell entry, which aligns with the 161.8% Fibonacci extension and could reverse from this level to he downside.
Sell entry is at 202.41, which aligns with the 161.8% Fibonacci extension.
Stop loss is at 203.65, which is a pullback resistance.
Take profit is at 200.42, which is a pullback support that aligns with the 38.2% Fibonacci retracement.
High Risk Investment Warning
Trading Forex/CFDs on margin carries a high level of risk and may not be suitable for all investors. Leverage can work against you.
Stratos Markets Limited (tradu.com/uk ):
CFDs are complex instruments and come with a high risk of losing money rapidly due to leverage. 65% of retail investor accounts lose money when trading CFDs with this provider. You should consider whether you understand how CFDs work and whether you can afford to take the high risk of losing your money.
Stratos Europe Ltd (tradu.com/eu ):
CFDs are complex instruments and come with a high risk of losing money rapidly due to leverage. 66% of retail investor accounts lose money when trading CFDs with this provider. You should consider whether you understand how CFDs work and whether you can afford to take the high risk of losing your money.
Stratos Global LLC (tradu.com/en ):
Losses can exceed deposits.
Please be advised that the information presented on TradingView is provided to Tradu (‘Company’, ‘we’) by a third-party provider (‘TFA Global Pte Ltd’). Please be reminded that you are solely responsible for the trading decisions on your account. There is a very high degree of risk involved in trading. Any information and/or content is intended entirely for research, educational and informational purposes only and does not constitute investment or consultation advice or investment strategy. The information is not tailored to the investment needs of any specific person and therefore does not involve a consideration of any of the investment objectives, financial situation or needs of any viewer that may receive it. Kindly also note that past performance is not a reliable indicator of future results. Actual results may differ materially from those anticipated in forward-looking or past performance statements. We assume no liability as to the accuracy or completeness of any of the information and/or content provided herein and the Company cannot be held responsible for any omission, mistake nor for any loss or damage including without limitation to any loss of profit which may arise from reliance on any information supplied by TFA Global Pte Ltd.
The speaker(s) is neither an employee, agent nor representative of Tradu and is therefore acting independently. The opinions given are their own, constitute general market commentary, and do not constitute the opinion or advice of Tradu or any form of personal or investment advice. Tradu neither endorses nor guarantees offerings of third-party speakers, nor is Tradu responsible for the content, veracity or opinions of third-party speakers, presenters or participants.

#030: Long Investment Opportunity on CHF/JPY
I'm monitoring CHF/JPY for a potential long entry with a Buy Limit at 184,800, with a stop loss at 184,100 and a take profit at 186,200. Hello, I'm Forex Trader Andrea Russo, an independent trader and prop trader with $200,000 in capital under management. Thank you in advance for your time.
The trade is based on technical-behavioral analysis, with particular attention to:
price structure,
sentiment dynamics,
and price behavior in key zones.
🔍 Why 184,800?
This area has acted as a dynamic and technical support zone in the past. After a decline from local highs, the price began to build a base in the 184,300–185,000 range, signaling potential absorption by stronger buyers.
Placing a buy limit at 184,800 allows traders to enter on a potential institutional reaction without chasing the price. If the market retests this area, we could see a reversal pattern and a rebound toward the highs.

Strategic Buy Zones on My USDJPY 4H Analysis | Trader Tilki📊 USDJPY 4H Analysis: Buy Setup
Hello Guys,
Here’s my 4-hour USDJPY analysis for you.
These are the exact buy levels I’ll be watching:
🔵 1st BUY level: 147.018
🔵 2nd BUY level: 146.347
🔴 Stop level: 145.509 (or adjust based on your own margin)
🟢 Target level: 150.019
Risk-to-reward ratio on this setup: 2.02
If USDJPY reaches these levels, I’ll definitely take a buy position.
Every like is my biggest motivation to keep sharing these analyses.
Thanks to everyone supporting me!

Bullish bounce off?USD/JPY is falling towards the pivot and could bounce to the 1st resistance, which acts as an overlap resistance.
Pivot: 145.27
1st Support: 143.29
1st Resistance: 151.15
Disclaimer:
The above opinions given constitute general market commentary, and do not constitute the opinion or advice of IC Markets or any form of personal or investment advice.
Any opinions, news, research, analyses, prices, other information, or links to third-party sites contained on this website are provided on an "as-is" basis, are intended only to be informative, is not an advice nor a recommendation, nor research, or a record of our trading prices, or an offer of, or solicitation for a transaction in any financial instrument and thus should not be treated as such. The information provided does not involve any specific investment objectives, financial situation and needs of any specific person who may receive it. Please be aware, that past performance is not a reliable indicator of future performance and/or results. Past Performance or Forward-looking scenarios based upon the reasonable beliefs of the third-party provider are not a guarantee of future performance. Actual results may differ materially from those anticipated in forward-looking or past performance statements. IC Markets makes no representation or warranty and assumes no liability as to the accuracy or completeness of the information provided, nor any loss arising from any investment based on a recommendation, forecast or any information supplied by any third-party.

Bearish reversal off pullback resistance?GBP/JPY is rising towards the pivot, which acts as a pullback resistance, and could drop to the first support.
Pivot: 198.91
1st Support: 196.94
1st Resistance: 199.71
Disclaimer:
The above opinions given constitute general market commentary, and do not constitute the opinion or advice of IC Markets or any form of personal or investment advice.
Any opinions, news, research, analyses, prices, other information, or links to third-party sites contained on this website are provided on an "as-is" basis, are intended only to be informative, is not an advice nor a recommendation, nor research, or a record of our trading prices, or an offer of, or solicitation for a transaction in any financial instrument and thus should not be treated as such. The information provided does not involve any specific investment objectives, financial situation and needs of any specific person who may receive it. Please be aware, that past performance is not a reliable indicator of future performance and/or results. Past Performance or Forward-looking scenarios based upon the reasonable beliefs of the third-party provider are not a guarantee of future performance. Actual results may differ materially from those anticipated in forward-looking or past performance statements. IC Markets makes no representation or warranty and assumes no liability as to the accuracy or completeness of the information provided, nor any loss arising from any investment based on a recommendation, forecast or any information supplied by any third-party.

Bearish reversal off 38.2% Fibonacci resistance?EUR/JPY is reacting off the pivot, which is an overlap resistance that aligns with the 38.2% Fibonacci retracement and could reverse to the 1st support.
Pivot: 173.26
1st Support: 171.97
1st Resistance: 174.11
Disclaimer:
The above opinions given constitute general market commentary, and do not constitute the opinion or advice of IC Markets or any form of personal or investment advice.
Any opinions, news, research, analyses, prices, other information, or links to third-party sites contained on this website are provided on an "as-is" basis, are intended only to be informative, is not an advice nor a recommendation, nor research, or a record of our trading prices, or an offer of, or solicitation for a transaction in any financial instrument and thus should not be treated as such. The information provided does not involve any specific investment objectives, financial situation and needs of any specific person who may receive it. Please be aware, that past performance is not a reliable indicator of future performance and/or results. Past Performance or Forward-looking scenarios based upon the reasonable beliefs of the third-party provider are not a guarantee of future performance. Actual results may differ materially from those anticipated in forward-looking or past performance statements. IC Markets makes no representation or warranty and assumes no liability as to the accuracy or completeness of the information provided, nor any loss arising from any investment based on a recommendation, forecast or any information supplied by any third-party.

AUD/JPY - Bearish Rejection from Key Zone📉 AUD/JPY Analysis 📉
Price is currently testing a key structure level after rejecting the upper zone. If bearish pressure continues, we could see a potential drop toward the highlighted Key Zones below. 🚨
🔑 Key Levels:
Resistance Zone: 96.10 – 96.30
Support Zones: 97.40 / 97.25
⚠️ Watch how price reacts around the resistance zone. A strong rejection could confirm the move toward the downside targets.
💬 Share your thoughts below – Do you expect AUD/JPY to continue bearish momentum or bounce back up?
#AUDJPY #ForexTrading #PriceAction #TechnicalAnalysis #FX #TradingView #ForexCommunity #ChartAnalysis #BearishSetup
✅ If you found this useful, don’t forget to LIKE 👍, COMMENT 💬, and FOLLOW 🔔 for more analysis!
📌 Disclaimer:
This analysis is for educational purposes only and not financial advice. Please do your own research before making any trading decisions.

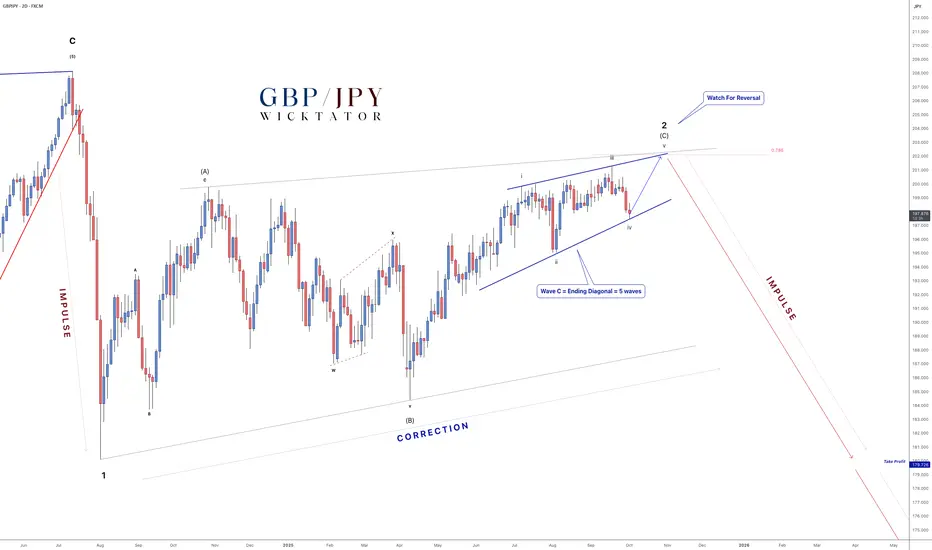
GBPJPY - 10,000pip Setup ALMOST Ready!In our last setup for GBPJPY, we identified a massive diagonal pattern, with price completing wave 4 and preparing for a multi-year drop into wave 5.
Since then, price has played out exactly as forecasted - we've seen a clean impulse lower for wave 1, followed by an ABC correction for wave 2, which is almost complete.
The Correction:
The correction is made out of 3 major waves = ABC. Wave C appears to be an ending diagonal, which is typically a reversal pattern consisting of 5 waves in the form of an ascending wedge.
We expect to see one final move higher, reaching the 78.6 fibonacci, thus completing the 5 waves of the ending diagonal.
Trade idea:
- Watch for wave 5 of the diagonal to develop
- Once we reach the fib, look for a trendline that we can use for entry
- once entered, stops above the breakout highs
- Targets: TP1: 192, TP2: 180, TP3: 175
- Final Target: Trail for extended move toward wave (3) lows (could be 10,000+ pips over long term)
This sets the stage for the next major leg - wave 3 of 5 - which historically carries the most power and momentum.
What do you guys think? Goodluck and as always, trade safe!
Bearish drop off?AUD/JPY has rejected off the resistance level, which is an overlap resistance and could potentially drop from this level to our take profit.
Entry: 97.26
Why we like it:
There is an overlap resistance level.
Stop loss: 98.26
Why we like it:
There is a swing high resistance level.
Take profit: 96.13
Why we like it:
There is a pullback support that is slightly above the 61.8% Fibonacci retracement.
Enjoying your TradingView experience? Review us!
Please be advised that the information presented on TradingView is provided to Vantage (‘Vantage Global Limited’, ‘we’) by a third-party provider (‘Everest Fortune Group’). Please be reminded that you are solely responsible for the trading decisions on your account. There is a very high degree of risk involved in trading. Any information and/or content is intended entirely for research, educational and informational purposes only and does not constitute investment or consultation advice or investment strategy. The information is not tailored to the investment needs of any specific person and therefore does not involve a consideration of any of the investment objectives, financial situation or needs of any viewer that may receive it. Kindly also note that past performance is not a reliable indicator of future results. Actual results may differ materially from those anticipated in forward-looking or past performance statements. We assume no liability as to the accuracy or completeness of any of the information and/or content provided herein and the Company cannot be held responsible for any omission, mistake nor for any loss or damage including without limitation to any loss of profit which may arise from reliance on any information supplied by Everest Fortune Group.

GBPJPY Make or break moment on the 1D MA100. Buy or sell?The GBPJPY pair has been trading within a 5-month Channel Up and yesterday hit exactly its bottom (Higher Lows trend-line). That is marginally above the 1D MA100 (green trend-line), which has been the market's Support since May 08.
As long as it holds, we expect the Channel Up to make another standard V-shaped rebound, similar to both previous ones, and target the Resistance level at 201.200.
A candle closing below the 1D MA100 though, would be a sell signal, targeting the 1D MA200 (orange trend-line) on the Support 1 level at 195.050.
The current price level at the bottom of the pattern offers low risk on a tight SL both in the event of a rebound and break-out to the downside.
-------------------------------------------------------------------------------
** Please LIKE 👍, FOLLOW ✅, SHARE 🙌 and COMMENT ✍ if you enjoy this idea! Also share your ideas and charts in the comments section below! This is best way to keep it relevant, support us, keep the content here free and allow the idea to reach as many people as possible. **
-------------------------------------------------------------------------------
💸💸💸💸💸💸
👇 👇 👇 👇 👇 👇
