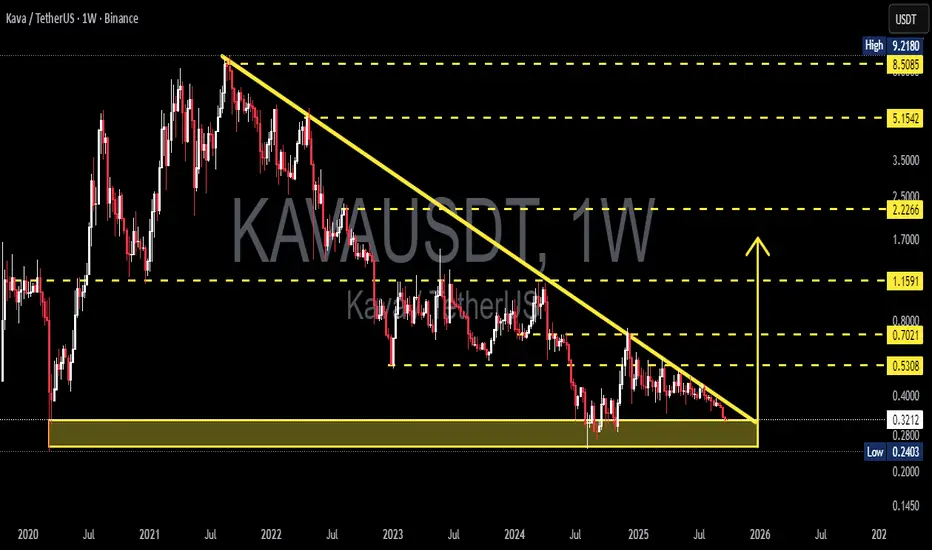
KAVA/USDT — Descending Triangle at a Major Decision Zone!KAVA is currently standing at a critical crossroads. After a prolonged downtrend from its all-time high, the price is now consolidating inside a descending triangle on the weekly timeframe. Lower highs keep pressing the price downward, while the historical support zone at $0.24 – $0.32 is still holding as the last line of defense.
The triangle is getting tighter (apex approaching), which often signals an imminent big move — either a bullish reversal or a bearish continuation.
---
🔎 Pattern Analysis
Main pattern: Descending Triangle
→ Traditionally seen as a bearish continuation, but if the support holds strong, it could act as a springboard for a major reversal.
Historical support: $0.24 – $0.32 (yellow box), a make-or-break area before entering uncharted lower territory.
Falling trendline: The multi-year descending line from 2021 remains the key resistance that bulls must reclaim.
---
🚀 Bullish Scenario
1. Breakout confirmation → A weekly close above the descending trendline.
2. Stronger signal → Break + retest above $0.53.
3. Upside targets:
$0.70 → first psychological barrier.
$1.16 → strong historical resistance.
$2.22 → mid-term breakout target.
4. Extra signals: Rising volume + RSI recovery from oversold would strengthen bullish momentum.
---
🐻 Bearish Scenario
1. Breakdown confirmation → A weekly close below $0.24 with strong volume.
2. Downside targets:
Below $0.24 → opens room for deeper lows.
Sustained breakdown would confirm the continuation of the multi-year bearish trend.
3. Risk factor: Watch for potential false breakdowns (bear traps) if price quickly reclaims the support.
---
🎯 Conclusion
$0.24 – $0.32 is KAVA’s do-or-die zone.
Holding this level → chances of a major reversal.
Losing this level → the bearish trend extends even further.
KAVA is in its final stage of accumulation or distribution. Traders should wait for clear breakout confirmation before committing, as volatility is likely to expand once price exits this structure.
---
KAVA/USDT is consolidating at historical support $0.24 – $0.32, trapped inside a descending triangle. The apex is near → a decisive move is coming.
Bullish case: Breakout above the trendline and $0.53 → targets $0.70 – $1.16 – $2.22.
Bearish case: Breakdown below $0.24 → opens the door for deeper lows.
This is a multi-year turning point for KAVA. Patience for confirmation could reward traders with the next major move.
---
#KAVA #KAVAUSDT #Crypto #Altcoins #PriceAction #DescendingTriangle #SupportResistance #CryptoAnalysis #BreakoutTrading
Kavausdc
KAVAUSD – Midpoint Retest with a Shot at a Daily Higher LowCOINBASE:KAVAUSD / COINBASE:KAVAUSDC
Watching KAVA here on the daily, and it’s at a key decision point that could define the next leg. We’ve got two sets of Fibonacci retracements drawn: the first from the March 2024 high to the August 2024 low, and the second from the August low to the December high. Right now, price is retesting the 50% level of the larger March–August move—aka the midpoint of the macro range—and it's still holding above the 50% retracement of the more recent August–December leg. We’re also sitting right on the 38.2% Fib of that second move, which tends to act as a key area for potential higher lows.
The idea here is simple: I’m playing for a daily higher low. We had a strong move off the December lows, followed by a healthy consolidation, and this is where bulls need to step in. Structure-wise, this is the ideal area for bulls to attempt a defense if the trend is going to continue. EMAs are curling up, and price is still holding above the 12 and 26 EMAs for now, which gives me confidence in a potential bounce.
If the Trade Goes as Planned (Bullish Case)
If buyers step in here and confirm a higher low—ideally somewhere between $0.48 and $0.50—we’d expect a continuation toward the recent high at $0.56. If that level breaks, then $0.64 becomes the next area of interest based on prior price structure and confluence with the upper Fib retracement levels. From there, we could even make a push toward the $0.74 area, where the last major rejection happened in late 2024.
A strong bounce here also sets up a potential inverse head and shoulders structure on the daily if we revisit that neckline around $0.56 again with momentum. In short, a higher low here gives the bulls the setup they need to retake trend control.
If the Trade Fails (Bearish Case)
If price fails to hold the $0.48–$0.50 region and breaks below the August–December 50% Fib level, then we’re likely heading back to the $0.44 zone. That’s where the 200-day SMA is sitting, and it’s also a major pivot from previous support. A loss of that zone opens the door to a full retrace toward $0.39 or even $0.37—last seen during the November-December basing structure.
In that case, the trend would flip neutral at best and would require a fresh base-building phase before bulls could even think about regaining momentum.
TL;DR
Thesis: Playing for a daily higher low above key Fib levels and EMAs.
Bullish Target: Reclaim $0.56 → push toward $0.64–$0.74 if momentum follows through.
Bearish Invalidator: Break below $0.48 = likely revisit of $0.44 or lower.
Not financial advice. Just sharing my thinking as I try to stack confluence and play the levels. Let’s see if this bounce gets legs.

KAVAUSDT - Resistance Breakout!KAVAUSDT (4h Chart) Technical analysis
KAVAUSDT (4h Chart) Currently trading at $5.2
Buy level: Above $5.1
Stop loss: Below $4.22
Target 1: $5.5
Target 2: $6
Target 3: $6.6
Target 4: $7
Max Leverage 2x / Spot Market
Always keep Stop loss
Follow Our Tradingview Account for More Technical Analysis Updates, | Like, Share and Comment Your thoughts.

KAVAUSDT Wedge Pattern breakout!KAVAUSDT (1H CHART) Technical Analysis Update
Wedge Pattern Breakout
kAVA/USDT currently trading at $7.88
Buy-level: Above $7.85
Stop loss: Below $7.39
Target 1: $8.20
Target 2: $8.55
Target 3: $8.90
target 4: $9.25
Max Leverage: 2X or buy it on spot
ALWAYS KEEP STOP LOSS...
