KERNEL/USDT — at the of the Wedge: Breakout or Sideways?🔎 Overview
KERNEL/USDT is currently trading inside a descending wedge pattern — a narrowing channel that often signals a potential bullish breakout. Price is consolidating around 0.2186 USDT, just below the key resistance zone at 0.239 – 0.2565 USDT.
This is a make-or-break area:
A successful breakout above could trigger a strong upward move.
A rejection may push price back to lower wedge supports.
---
🟢 Bullish Scenario
1. A daily close above 0.239 – 0.2565 with strong volume would validate a bullish breakout.
2. If confirmed, upside targets are:
0.3270 USDT (major resistance / wedge target).
Potential extension towards 0.35 – 0.40 USDT if momentum accelerates.
3. Safer approach → wait for a breakout and retest above 0.2565.
4. Potential gains:
From 0.2186 to 0.3270 ≈ +49.6%.
Risk can be limited with a stop loss below 0.238 (around -7% from breakout entry).
---
🔴 Bearish Scenario
1. Failure to break above 0.239 – 0.2565 and a bearish rejection could invite selling pressure.
2. A daily close below 0.18 would confirm bearish continuation.
3. Downside targets:
0.17 USDT (wedge support).
0.0931 USDT (historical low, worst-case scenario).
4. Bearish risk increases if candles close consistently below 0.18 USDT.
---
📌 Pattern & Sentiment
Descending wedge: often leads to a bullish reversal but requires confirmation.
Declining volume: indicates market participants are waiting for a strong catalyst.
Broader crypto market sentiment will also play a major role in determining breakout direction.
---
⚖️ Conclusion
Bullish Key Zone: Breakout above 0.239–0.2565 → target 0.3270.
Bearish Key Zone: Breakdown below 0.18 → downside to 0.17 or even 0.0931.
Neutral Bias: Price remains in consolidation until a decisive breakout occurs.
The best trading approach is to wait for confirmation — either a bullish breakout or a bearish breakdown — before committing to a larger position. This is a clear decision zone for KERNEL.
---
#KERNEL #KERNELUSDT #CryptoAnalysis #AltcoinUpdate #ChartPattern #TechnicalAnalysis #CryptoSignals #WedgePattern #SupportResistance
KERNELUSDC

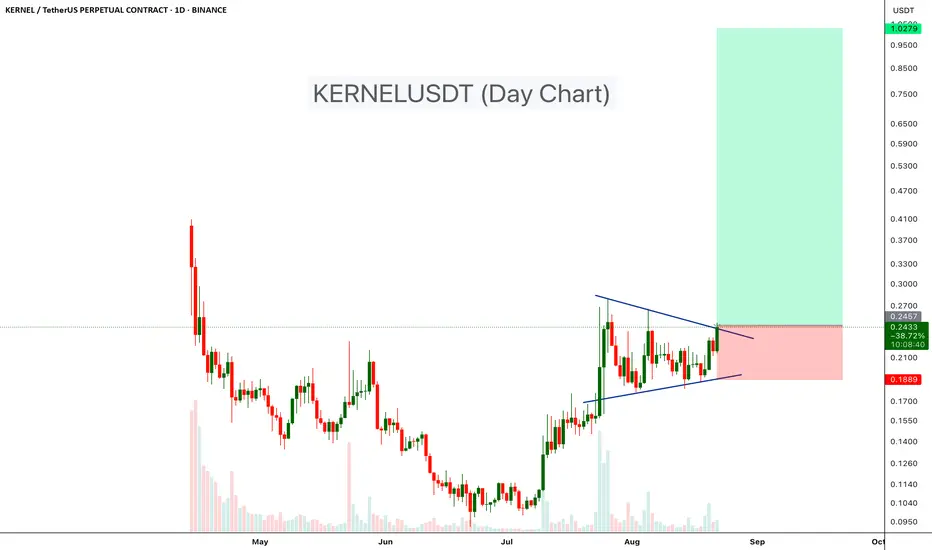
KERNELUSDT – Symmetrical Triangle Breakout!KERNELUSDT has been consolidating within a symmetrical triangle pattern on the daily chart, showing a battle between buyers and sellers after a strong uptrend. Recently, price has started breaking above the upper trendline, which could indicate the beginning of a fresh bullish move.
Pattern: Symmetrical Triangle
Entry Zone: Around current breakout levels (~0.24–0.25 USDT)
Target Zone: $0.5 - $1.00
Stop-Loss: Below 0.19 USDT (recent support)
Cheers
Hexa