KEY DOUBLE BOTTOM BULLISH SCENARIO - CryptoManiac101KEYBTC Enjoy this trade advice my Crypto Maniacs, but remember to invest only what you can afford to lose or you're going right back to poverty on drop. We are not your financial advisors.Kby CryptoManiac101Updated 14
Bullish Signal for #KEY #KEYBTC (10-09)#KEY (KEY/BTC) Buy : 84 Flash Sell : 85-86-87-88 Short Sell : 90-92-94-96-98 Long Sell : 100-105-110-115-120 Stop : 80 Follow me for more signals PM me if you need helpKby CryptoStation4
KeyCorp - Profit PotentialThe interesting situation I see at this chart, there are always two scenarios of the possible price movement to the trader. 1) This uptrend will continue to rise. 2) This uptrend can have the correction before the price will hit the new highs at the end of the year. The monthly TF looks very positive, merely because the price doesn't fall below 7EMA line since last pump at September 2016. the RSI > 50, a positive sign to buy and hold this asset, but the MACD indicator is trying to fall down and cross the signal line, but we don't make a decision with only one indicators. Also the bad thing is a possible resistance level, maybe it hasn't the power but in the theory it can stopped the uptrend on some time. 3 Months TF also has a positive sign to buy, the MACD is very bullish, the RSI >50. But the new 3 Month session starts at 1st October and we need to be ready for the price correction at October, November and December. A lot of investors buy shares to make a divi portfolio, and this stock is one of them, the dividend yield is 3.19% and other data as earnings and revenue rose at 2Q 2018. There is no doubt that Key could be a good investments for a long-term. I continue to follow the trend and update with TA every month. ENTER: $19, 20, 21 CLOSE: $26 Likes/Comments. Yes, please :) Longby LudwigStirner1
Bullish signals for #KEY #KEY/BTC (06-09)#KEY (KEY/BTC) Buy : 88-89 Flash Sell : 90-91-92-93-94 Short Sell : 95-97-99-101-103 Stop : 84 Follow me for more signals PM me if you need helpKShortby CryptoStation4
Low Risk On USDJPY Long - Soon at 114.500 ? Hey Traders hope everyone has a good start of the week, we are starting strong over here with a long trade on USDJPY. Pulling out our Fibonacci from the last low to the high we see price clearly bouncing back from the 0.61 key level. This is the level where we enter with a very low risk, because there is no level behind this. Another reason is that we are looking at a real longterm uptrend and price retraced the 2rd time (mentioned in the two blue boxes) at this point. First take profit for this trade will be the last high at 113.200 and another one even higher at 114.500. Lets start this week strong. Longby darian_fxUpdated 4
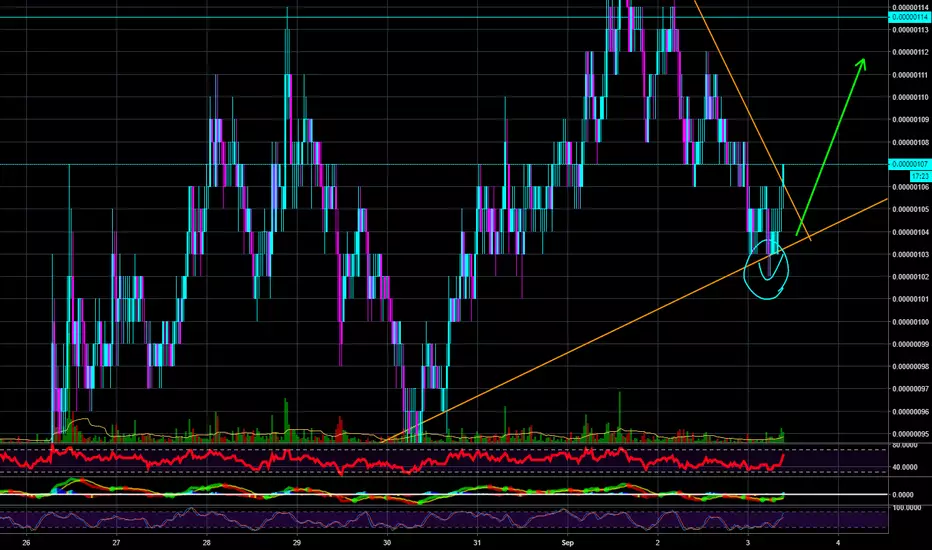
KEY breaking lines KEY breaking lines KEYBTC Look good for entry Love to hear your thoughts? This is for my own research Always Trade Safe KLongby mygroupcrypto1
Technical Analytic for #KEY #SelfKey (30/08) - CryptoStationLast call was finished successfully. Now we will make a new call #KEY (KEY/BTC) Buy : 94-96 Flash Sell : 97-98-99-100-101-102 Short Sell : 104-106-108-110-112 Long Sell : 115-120-125-130 Stop : 88 Follow me for more signals Inbox me for more and more signalsKby CryptoStation10
Tron – fireworks or busted flush?Hello, TRX is at a key-level at the moment, I think. Either the bulls break through the wall at 0.023/0.025 or the bears take over to drop TRX down to 0.005 as a final sell-off, or to kill it totally. If the bulls win, it will not be easy because there’s much resistance waiting at the upside for the bulls (blue levels in the chart). In Elliott-wave-Speech… We have seen a huge complex correction starting at the end of superordinate wave 1 at all-time-high (the correction is marked with abc in the chart). Now we are in the last wave, wave c of corrective wave 2 (blue in brackets). Wave c is a 5-wave down. So, we are in wave 5 of c of 2 to be precise. Scenario 1 (green line) The bulls will fight the bears down and hit through the blue trend channel. If that happens, we have to check how strong the uptrend will be, impulsive or corrective. And have to look out for an entry point then (the next 1-2 wave setup will make it). Scenario 2 (red line) The bulls will lose the battle of 0.023/0.025. TRX will drop down to earth – nearly (0.0075/0.0050). If that happens Tron may even never come back again. But: Also possible: we will see an epic turn around searching for new highs! It remains exciting! Please leave a comment or a message, if you have any questions! If you have any other ideas, please leave a comment here! Take care tgo by TV_ACC_02Updated 222
Good Entry (25-08) #KEY #SelfKey - CryptoStationBuy : 86-87 Sell : 89-91-93-95 Sell : 100-105-110-115 Stop : 81 Follow me for more signalsKby CryptoStation5
BNB goes up every time when the coin of the month is announced!Hello everyone! We have prepared something special for you. We made an analysis on BNB and found one particular thing about it. When Binance announce the coin of the month, then BNB goes up every single time. And it has already happened 3x times in a row. Not a joke! Check out the graph! 21. Feb. - 22 % 15. Jun. - 19 % 25. Jul. - 29 % BNB is one of our most popular coin. We like to trade it as it is not like the other coins. Not really. It is actually not dependent on BTC at all. There is built a lot of attractive positions that you can trade without checking out a smartphone every second and hope that bitcoin does not go down as BTC affects the most of altcoins. The next coin of the money is coming in a while. Be ready and and let's make some money! If you want to add some of your thoughts, use the comment section! Thank you for watching us! Your exclusive signals team!!Longby exclusive_signals445
BTC USD key levels to watch now (MAs & EMA S/R)BTC USD key levels to watch now (MAs & EMA S/R)by Martin_CZ2
GBPJPY Short after monthly level breakStill seeing bearish sentiment with a clean monthly level break, looking for a short bull run for a retest of this monthly resistance, trendline line, and 61.8%-71% retracement level, forming the 4th leg keeping in mind the rule "if wave 2 retraces a little, then wave 4 will retrace a lot" - before bearish continuation. 130 pip risk for a 640 pip reward. Shortby VoyceS5
KEY/BTCSELFKEY has hit the bottom, and now had a good push on 1H chart. Working with fib levels now.Kby lalayevUpdated 337
KEY/BTC 170% Profits OpportunityKey just listed on Binance on mid June and showed a very high prospect comparing to the other crypto markets. At the time of listing on Binance this coin increased almost 6.5x within 2 weeks period. This time it is creating a falling wedge pattern like most of the crypto currencies in the market. It might further go some down moves and if it can break the support at aroun 122 it might continue its downward move. But it seems its almost in its lowest dip and most likely to break the falling wedge resistance line. With the help of such indicators like RSI and the overall volume increment we might see a new impulsive elliottwaves trend to the upward. If it can close above the resistance at least short term uptrend reversal will be confirmed. Since Bitcoins flow is not yet confirmed this trade needs a strict risk management and trading must be done partially depending on the direction it moves. Entry Level : 121 sats - 131 sats Stop Loss : 110 sats Potential Profit Targets : Short Term Targets : T1 : 153 sats T2 : 168 sast T3 : 180 sats T4 : 192 sats T5 : 209 sats Mid / Long Targets : T1 : 239 sasts T2 : 307 sats T3 : 362 sats T4 : 417 sats T5 : 495 sats Risk/Reward Ratio : 11.35 Risk/Reward Ratio : 14 Good Luck. Legal disclaimer: Information on this channel is our team's analyst's "opinion" based on data available at this point in time. These opinions are not recommendations to buy or sell securities/commodities and cryptocurrencies. Trading and investing is a risk and you should not rely on this data to make any financial decisions. You must consult a financial advisory licensed by regulatory agencies in your legal jurisdiction. All information stated here and in our reports don't guarantee any possible profits or losses. Please do consider to do your own due diligence and research when making any kind of a transaction with financial implications. With Regards. TeamTWA.KLongby cryptotalk_et1111
Patientory VS Bitcoin Trending DownPatientory clearly trending downwards as price continues to move within the descending channel printing lower lows. Yesterday price spiked up and tested 1045 satoshis high, where it rejected the 200 moving Average and the upper trendline of the descending channel. But today, PTOY/BTC has rejected the 880 satoshis support, which could be the sign of a correctional wave upwards. Overall the trend is bearish and while price stays below the 1045 resistance level, PTOY is likely to decline wotards one of the Fibonacci retracement levels. First support is seen at 788 satoshis that is 127.2% Fibs, second support and the potential key level is seen at 227.2% Fibs, that is 440 satoshis. In order for the Patientory continue moving lower, closing price below 870 satoshis is required. On the upside. break and close above the 1045 resistance level, might send price towards 1247 resistance. Break and close above that resistance could be the first confirmation of an uptrend.Pby CryptoPAMMUpdated 2
SELFKEY - Trend Reversal? (Elliott Wave)Looking at a possible trend reversal for KEY. We've got a clean impulse wave up with a well defined sub-division for Wave 1. The 1st sub-wave of Wave 3 is currently and the next target is the 3rd sub-wave of Wave 3. Entry - 160-165 Satoshi or enter on the breakout of the resistance line. Target (Short term - sub-wave 3 of Wave 3) - 224 STOP LOSS - 145KLongby weevUpdated 3
KEY - Bearish View/Count ; Potential Head & ShouldersI'm currently Long on KEY with a STOP at 145 but here's a bearish look if we fail to break out on the upside of the wedge. A bounce off the resistance line would potentially form a H&S and if we break through support, the next line of support is around 120 sat. Kby weev116
keyLong-term deal When we talk about analysis, it is a perspective that holds true and wrong Therefore, capital management protects you from risk Always better enter gradually, sell gradually, keeping 25% for long-term goals And placing orders to buy or sell pending Here we note a strong resistance zone between 220 St and 255 St And an old and strong support area between 122 St and 141 St During this area, there is a 180 st separation line, which is a resistance (support) which was significantly increased on 29/6/2018 Now the night is moving up and down in that area and it is possible to complete several buying and selling trades at that border As I mentioned earlier, 25% of each transaction is held, you will notice find a good capital for the upcoming rallies When the price crosses the strong resistance zone and the stability above it will begin the journey to rise to the targets For those who want to trade on short term trades wait until the price reverses to 141 St and buys Or the price rises above 180 St and buys and sells at 220 St Long-term goals 300 st 380 st 470 st 600 stKLongby zomlot884
KEY BreakOutBuy Around 157-160 Targets: 167-180-188-226 Stop Loss: 145 My Main Target Is 180. I Will Update The Chart After That. Good Luck!Kby HyperProphitUpdated 5511
KEY about to make a leg-up!KEY is one of the coins which is extremely manipulated and you never know what to expect of it. Let's say this time it nicely accumulates and is waiting for a breakout which may come up very soon. TA - looks like there are double bottoms confirmed and from our view, it is nicely holding the two lines between 165 and 145 . These two are buy-zones but it is always better to choose the lowest price for more percentages. FA - great roadmap, good team! Enter: 0.00000148- 0.00000154 Sell: 1. 0.00000170 2. 0.00000183 3. 0.00000200 4. 0.00000220KLongby exclusive_signalsUpdated 5
Key short term tradeHello guys this is my 2nd TA Selfkey now good time for buy 4h chart rsi showing uptrend and candlstick showing downtrend. now you can buy key 150 to 155 stop loss. and you can order to sell 3 step . follow the chart . when you buy key in stop loss , after submite a order to your traget price . and after be patince. bcz this a short term trade . KShortby incomesourceUpdated 3
BTCUSD: Bitcoin Update and Key Trade Points this weekBitcoin Update 24th July 09:42 Bst 04:42 Est The break higher duly came at the rather strange hour of 05:00 Bst and midnight Est. Volume has been quite high though not spectacular. Not much follow through in London though. It's the first time Bitcoin has made such a small surge following a break-out higher and it hasn't reached any clear resistance level either. The rally is a little spooky so far, lacking real intent. The long shot from 7800 is going OK but not great so far. Raising the stop to 7924 for now and hoping it won't get taken before more buyers appear. Last Bitcoin Update 23rd July 15:23 Bst 10:23 Est ...Bitcoin had to break above 7350-7380 to follow long to 7500 minimum and ideally to 7741 where it was a sell again with a stop 20 or so above. But the call was ruined by raising the stop too high to 7389 - Bitcoin came back to a low at the 7347 line again then rallied to just above 7500 before falling away to retest the 7347 line once more before rallying hard to a high at 7764. In this case a stop of 25 points was needed (above the given level at 7741 here on Bitmex) to avoid getting stopped out - sorry about that. It was meant to rally over the weekend and then to come off from 7741 at tops....pretty hard too. But it hasn't, so far at least. Instead it's finding support off the uppermost parallel of the little continuation pattern it had spent most of the weekend inside....it's now outside of the pattern and using it as support. This is telling us that there is still a chance of a break to the upside from here. It's at mission critical for the bulls in this argument at this point. It's giving off mixed short term signals here - it should have met with pretty heavy rejection at 7741 through to 7800 at the uppermost parallel but so far has only been mild. Bull hopes are being faded from 7725 but not aggressively so as yet. Price action is telling us to revert to open mind-set from here....it should come off but it isn't doing, dammit. If still short suggest lowering the stop to 7725 for starters and to 7445 at lowest for rough break even if hit. Trade Points from Here if Flat Don't want to get sucked in if it can be avoided from this point but we need to be prepared for a break higher... If it comes and volume rises to back it up we could get a very good break too. It has to break above the 7780-7800 range and the uppermost parallel on Bitmex on rising volume to follow long again to 7948 initially and then 8576 and potentially back as high as 9995 on this feed over the course of this week. However, as usual, if we see a break higher but volume doesn't quickly build on its back we need to be ready to close out and then be ready to go again, depending on price action at that critical point... But if do get a break higher on volume it should be worth following it for significantly higher levels still this week. Returning to the downside a break below 7683 should force Bitcoin lower still to 7614-7610 for a small scalp at best. It's likely to bounce again from here in the near term though. It has to break below 7610 to trigger a more aggressive short back to 7347 again. * For fastest Bitcoin updates in real-time for more active traders please see link at top-left of main page Longby sumastardonUpdated 3324