ES (SPX, SPY) Analysis, Key Levels, Setups for Thur, Jan 22
GREENLAND CRISIS DE-ESCALATION
Trump announced "framework of a future deal" with NATO on Greenland/Arctic security. Feb 1 tariffs on 8 European nations CANCELLED. Market rallied immediately on de-escalation - tension that caused Tuesday's -1.3% selloff now reversing. NATO Secretary General Rutte confirmed deal focused on "Arctic security through collective efforts." Denmark welcomed the news, calling it "ending on a better note."
UKRAINE PEACE PROGRESS
US Envoy Witkoff: "We've got it down to ONE issue... I'm actually optimistic." Trump-Zelenskyy meeting TODAY in Davos (7:00 AM ET / 1:00 PM local). Witkoff & Kushner heading to Moscow to meet Putin (around 11:00 AM-12:00 PM ET). Trump floated "tariff-free zone" for Ukraine post-war reconstruction. Major diplomatic progress could spark additional risk appetite.
FED INDEPENDENCE PRESERVED
Supreme Court SKEPTICAL of Trump's attempt to fire Fed Governor Lisa Cook. Justice Kavanaugh: Trump's position "would weaken, if not shatter, Fed independence." Bipartisan pushback from conservative AND liberal justices. Market participants already adjusting Fed outlook - reduced betting odds of Cook removal. This removes a significant tail risk for monetary policy uncertainty. Court expected to rule by June 2026.
AI/TECH MOMENTUM
Nvidia CEO Jensen Huang: AI revolution "would require trillions of dollars." Global chip stocks performing strongly in premarket. Nasdaq 100 futures +0.8% overnight. AI infrastructure plays leading the rally.
WHITE HOUSE ECONOMIC OPTIMISM
WH Sr. Adviser Hassett: "We might get two quarters in a row above 5%"
Hassett: "Recent inflation data may have been very promising"
BEARISH CATALYSTS / RISKS
-------------------------
1. PCE INFLATION DATA (10:00 AM ET) - CRITICAL EVENT
Combined October & November release (unusual - due to prior government shutdown). Consensus: 2.8% YoY for both headline and core. Credit Agricole expects 2.9% YoY (above consensus) which could pare back Fed cut expectations. HOT print = hawkish repricing, potential selloff. COOL print = further rally fuel.
2. GEOPOLITICAL UNCERTAINTY REMAINS
Greenland deal is "framework" only - no concrete details yet. Denmark still says Greenland "not for sale" - fundamental disagreement persists. Ukraine talks down to "one issue" but resolution not guaranteed. Putin-related meetings later today could introduce volatility.
3. EXTENDED RALLY CONCERNS
Small caps outperforming S&P 500 for 13 straight sessions. S&P has yet to fully recover weekly loss. Gold on track for greatest weekly gain since October (flight to safety signal). Bitcoin below $90K showing crypto weakness.
TECHNICAL ANALYSIS
==================
MULTI-TIMEFRAME STRUCTURE
-------------------------
DAILY
Structure: Bullish, recovering from December lows. Recent CHoCH confirmed bullish continuation. Price trading in PREMIUM zone (above 50% fib). PQH resistance cluster near 6,988-7,000. Key Support: PML ~6,780, PQL ~6,600. Fib Extensions (upside targets): 1.272 @ 7,149.75 | 1.618 @ 7,226.75. LuxAlgo Oscillator Matrix: Momentum building but approaching overbought.
4-HOUR
Structure: Bullish swing established after Monday's LL at 6,791. Current position: Testing resistance in 6,940-6,960 zone. Premium Zone: 6,960-7,020 (heavy supply expected). PWL: 6,923.25 (key level to monitor). Fib retracement levels from recent swing: 1.272 @ 6,873.50 | 1.618 @ 6,834.50 | 2.0 @ 6,791.25
1-HOUR
Structure: HH-HL pattern intact. Recent BOS above 6,920 confirms bullish momentum. Premium zone: 6,950-7,050 (overhead supply). Discount zone: 6,830-6,865 (accumulation area). PML: ~6,780. Fib Extensions: 1.272 @ 7,077.50 | 1.618 @ 7,122.75 | 2.0 @ 7,172.75. Volume profile shows strong buying into Wednesday close.
30-MINUTE KEY LEVELS (from stats boxes)
ES Levels:
PDH: 6,904.75
PDL: 6,822.25
ONH: 6,916.50
ONL: 6,846.75
VWAP: 6,865.50
IB High: 6,897.00
IB Low: 6,865.75
Open: 6,886.00
Prior Close: 6,837.50
Y-VAH: 6,904.50
Y-POC: 6,886.00
Y-VAL: 6,841.50
NQ Levels:
PDH: 25,429.75
PDL: 25,098.00
ONH: 25,439.75
ONL: 25,095.25
VWAP: 25,279.00
Prior Close: 25,144.00
KEY ZONES
=========
RESISTANCE (Supply Zones)
-------------------------
6,916-6,920: ONH / Session High - first rejection level, partial profit zone
6,940-6,960: 4H resistance cluster - expect selling pressure
6,988-7,000: Daily PQH + Round Number - major psychological resistance
7,020-7,030: PMH Confluence - strong institutional supply
7,077-7,080: 1.272 Fib Extension - extended target if breakout
7,120-7,150: 1.618 Fib Extension - swing target
SUPPORT (Demand Zones)
----------------------
6,897-6,905: PDH / IB High confluence - first pullback watch zone
6,865-6,875: VWAP + IB Low - high-probability bounce zone
6,846-6,850: ONL - intraday support
6,822-6,830: PDL - critical intraday support
6,780-6,800: PML + Deep Discount - swing support zone
6,790-6,795: Week's LL + 2.0 Fib - invalidation level for bullish thesis
TRADE SETUPS
============
PRIMARY SETUP: LONG ON PULLBACK TO 6,865-6,905
----------------------------------------------
Thesis: Relief rally continuation after Greenland de-escalation and Fed independence preserved. Pullback to VWAP/IB zone provides optimal R:R.
Entry Zone: 6,865-6,905
Stop Loss: 6,818 (below PDL)
Targets:
T1: 6,916 (ONH) - take 50%
T2: 6,955-6,960 (4H resistance) - take 35%
T3: 6,990+ (runner) - trail BE
Confirmation Required:
- CVD divergence at support (selling exhaustion)
- Bid absorption
- Avoid entry if PCE comes hot (>2.9% YoY)
SECONDARY SETUP: BREAKOUT LONG ABOVE 6,920
------------------------------------------
Thesis: Clean break above ONH triggers continuation toward 4H resistance and daily PQH.
Entry: 6,920-6,930 (break and retest)
Stop Loss: 6,895 (below breakout)
Targets:
T1: 6,955-6,960
T2: 6,990-7,000
T3: 7,030
Confirmation Required:
- Volume surge on breakout
- NQ leading/confirming
- No negative headline flow
HEDGE SETUP: SHORT AT PREMIUM REJECTION (6,988-7,000)
-----------------------------------------------------
Thesis: If price spikes into daily PQH without consolidation, fade for mean reversion.
Entry: 6,988-7,000 (rejection candle)
Stop Loss: 7,025
Targets:
T1: 6,955
T2: 6,920
Only valid if:
- Aggressive spike into resistance
- CVD divergence (buying exhaustion)
- PCE already released and digested
- Clear rejection wick on 15m chart
SESSION GAME PLAN
=================
PRE-MARKET (6:00-9:30 AM ET)
- Monitor Trump-Zelenskyy meeting outcome (7:00 AM ET)
- Watch for headline risk from Davos
- Note any pre-PCE positioning in futures
PCE RELEASE (10:00 AM ET)
- Wait 15-30 minutes for initial reaction to settle
- Hot print (>2.9%): Look for short opportunities on failed breakouts
- Cool print (<2.7%): Aggressive long bias, buy dips
REGULAR SESSION
- Primary focus: Pullbacks to 6,865-6,905 for longs
- Take profits at resistance levels (6,916, 6,955)
- If price holds above 6,920, shift to breakout mode
- Late session: Watch for Putin meeting headlines (11:00 AM-12:00 PM ET)
RISK MANAGEMENT NOTES
=====================
1. Position Size: Standard - conditions favor continuation but event risk elevated
2. Max Loss: 10 points per scalp, 25 points per swing position
3. Avoid: Mid-range entries between 6,925-6,950 (no edge zone)
4. Headlines: Greenland/Ukraine headlines can cause instant 10-20 pt swings - use wider stops or reduce size
5. PCE Reaction: Don't fight the initial move; wait for exhaustion signals
SUMMARY & FORECAST
==================
NEAR-TERM (Today): Bullish bias with 65% probability of testing 6,955-6,990 if PCE comes inline or cool. 35% chance of pullback to 6,830-6,865 on hot inflation print.
WEEKLY OUTLOOK: Continuation of recovery rally targeting PQH at 6,988. Break above opens door to 7,050-7,080 (1.272 extension). Failure to hold 6,820 shifts bias back to neutral with potential retest of 6,780-6,800.
KEY LEVELS TO WATCH:
Bullish above: 6,905
Bearish below: 6,820
Breakout trigger: 6,920+
Target zone: 6,955-7,000
Keylevel

ES (SPX, SPY) Analysis, Key Levels, Setup for Tue (Jan 20)U.S. cash markets paused on Monday in observance of Martin Luther King Jr. Day, but trading on the Globex platform displayed pronounced volatility amid soaring U.S.-EU trade tensions focused on Greenland. The E-mini S&P 500 (ES) saw a decline of approximately 1.1% from Friday's close, while the Nasdaq-100 (NQ) lagged further, dropping 1.4%. In a shift towards safe-haven assets, gold prices surged to an all-time high of $4,660, driven by a weakening U.S. dollar and strong performance from the Swiss franc.
The catalyst behind the market's movement was President Trump’s announcement of a 10% tariff on eight European NATO allies specifically Denmark, the UK, France, Germany, the Netherlands, Norway, Sweden, and Finland set to take effect on February 1. This tariff is scheduled to escalate to 25% by June 1 unless an agreement regarding Greenland is reached. In response, the EU has activated an emergency protocol and is deliberating potential countermeasures.
Treasury Secretary Bessent, speaking at the World Economic Forum in Davos, expressed optimism about the U.S. economy, stating, “We expect investment to accelerate this year.”
FORECAST
BIAS: Neutral-to-Bearish (Short-Term)
OVERNIGHT THOUGHTS: The Asia and Europe trading sessions are anticipated to test recent overnight lows, with potential for unsuccessful dip-buying efforts at resistance levels.
TUESDAY NY SESSION OUTLOOK: As U.S. traders return to the markets, they will react to the weekend’s accumulated news. An initial attempt at short-covering is expected, likely followed by renewed selling pressure. Failed rallies in the 6920-6935 range may further exacerbate the downward trend.
BULLISH SCENARIO (30% likelihood): A retraction back to 6923 that holds could lead to a gap fill toward the 6950-6960 area.
BEARISH SCENARIO (50% likelihood): A failed rebound at resistance may signal a continuation down to the 6870-6850 discount zone.
CHOPPING SCENARIO (20% likelihood): The market may remain range-bound between 6887-6920 while awaiting clearer catalysts.
INVALIDATION POINT: A sustained break above 6950 would shift the bias towards bullish.
HIGH-IMPACT SCHEDULED ITEMS (ET)
09:30 - US cash equities reopen after MLK Day closure (gap-and-go risk; repricing of Greenland tariff headlines that built up while cash was shut)
10:00 - Supreme Court session begins. Oral arguments scheduled: Wolford v. Lopez (2A), M&K Employee Solutions v. Trustees (pension). Opinions possible but not guaranteed - the tariff case (Learning Resources v. Trump) ruling could drop any session. Court did not pre-commit which decisions will be released. Last courtroom session until Feb 20.
11:30 - Treasury bill auctions (supply event; can jolt front-end yields and spill into ES via rates):
6-week bill auction (announced Thu prior)
4-week/8-week bills settle Tuesday per standard pattern
52-week bill auction possible (every 4 weeks on Tues)
16:01 - Netflix (NFLX) Q4 earnings release - HIGH IMPACT
16:15 - Fed H.10 Foreign Exchange Rates (pushed from holiday)
16:45 - Netflix earnings interview begins
After the close (earnings beta into index futures):
Netflix (NFLX) - major index weight, sentiment driver
United Airlines (UAL)
Interactive Brokers (IBKR)
US Bancorp (USB)
Fifth Third (FITB)
KeyCorp (KEY)
Before the open (also relevant if you trade the open):
3M (MMM)
DR Horton (DHI)
Fastenal (FAST)
WHAT IS NOT ON THE CALENDAR (STILL IMPORTANT)
No top-tier BEA macro prints (GDP/PCE/Income) scheduled for Tue Jan 20 per BEA release schedule
No major BLS releases scheduled for Tue Jan 20 per BLS January schedule
No FOMC meeting - next meeting is Jan 27-28
Fed note: Daily/weekly statistical releases scheduled on the holiday (Mon) are pushed to Tuesday - H.10 at 4:15 PM, H.8 on Thu. Can nudge rates/liquidity expectations.
Trump v. Cook (Fed's Cook firing case) oral arguments are Wednesday Jan 21 - could create Fed-related headline risk heading into that session
WATCH LIST (UNSCHEDULED BUT HIGH PROBABILITY)
EU tariff retaliation announcement - emergency meeting concluded, response expected
Trump/Bessent comments from Davos
Any SCOTUS tariff ruling leak or rel
Good Luck !!!

ES (SPX, SPY) Analysis, Key Levels, Setup for Fri (Jan 16)
The S&P 500 futures market is signaling renewed optimism heading into Friday's session, buoyed by a powerful earnings report from Taiwan Semiconductor Manufacturing Co. and resilient labor market data that together have eased concerns about the durability of the artificial intelligence trade.
E-mini S&P 500 futures extended gains for a second consecutive session, settling Thursday near 6994, advancing 12.25 points, or 0.18%, from the prior close of 6981.75.
The catalyst proved to be TSMC's fourth-quarter results, which showed profit growth of 35% and a commitment to capital expenditures of $52 billion to $56 billion in 2026. The guidance dispelled fears that hyperscaler spending on AI infrastructure might be cooling, sending Nvidia Corp. shares up more than 2% and lifting the broader semiconductor complex.
"Taiwan Semi's results today, and more importantly, their capex spending plans, point to reassuring investors that the AI trade is not necessarily a bubble at this point," said Kim Forrest, chief investment officer at Bokeh Capital Partners.
The CBOE Volatility Index fell 5.43% to 15.84, its lowest level in weeks, suggesting options traders see diminished risk of near-term turbulence.
Trade Developments Add Tailwind
Taiwan's Vice Premier confirmed that a bilateral tariff agreement with the United States would be signed within several weeks. The arrangement includes $250 billion in company-led investment alongside $250 billion in credit guarantees a framework the official described as distinct from recent deals struck with Japan and South Korea.
The development carries implications for semiconductor supply chains that remain central to U.S. economic competitiveness. Taiwan emphasized that domestic investment would continue even as companies expand their American footprint, a signal that TSMC's Arizona operations will complement rather than replace its home-island capacity.
Bank earnings provided additional support. Goldman Sachs Group Inc. and Morgan Stanley both exceeded analyst expectations, capitalizing on a resurgence in dealmaking activity. BlackRock Inc. reported record assets under management of $14 trillion.
Labor market data reinforced the constructive tone. Initial jobless claims for the week ending January 10 totaled 198,000, well below the 215,000 economists had forecast—evidence that employment conditions remain firm despite elevated interest rates.
Technical Picture Favors Continuation
From a structural perspective, the daily chart maintains a pattern of higher highs and higher lows, with price holding above a significant volume concentration between 6880 and 6900. Fibonacci extensions derived from the recent swing project potential upside targets at 7149.75, 7226.75, and 7311.75.
The four-hour timeframe shows consolidation between a premium zone near 7025-7050 and equilibrium around 6900. A higher low established at 6923 earlier this week suggests buyers remain willing to defend pullbacks.
On the one-hour chart, a series of bullish momentum signals have confirmed the near-term uptrend. The 6900-6910 zone, representing the prior week's low, now serves as structural support. Overhead, resistance near 7050, where distribution activity would be expected.
Treasury yields present a modest headwind, with the 10-year note at 4.17% as of Thursday's close.
Key Levels
Resistance
7050 → Premium zone, Weak High 39%
7017.25 → PDH (primary target)
7000 → Psychological, PWH area
Pivot
6992.25 → VWAP
6981.75 → Prior Close
Support
6974.75 → PDL (range edge)
6949.50 → ONL
6920-6925 → 1H HL structure
6900-6910 → PWL, critical support
6860 → Strong Low 61%, 1.272 Fib extension
Primary Setup: Long ES at PDL Support
Bias: Bullish above 6992.25 VWAP
Entry Zone: 6974 - 6978 (PDL range edge)
Stop Loss: 6964 (below PDL structure)
Target 1: 6992.25 (VWAP) → Scale 50%
Target 2: 7017.25 (PDH) → Runner at breakeven
Risk: 10-14 points
Confirmation Checklist
- CVD divergence at 6974-6978 (selling exhaustion)
- Bid wall formation / absorption
- Hold above 6970 on retest
- Volume decline into the pullback
Alternative Setups
Long Breakout
Entry: Above 7020 (with retest)
Target: 7040-7050
Stop: Below 7010
Short at Premium
Entry: 7040-7050 (rejection only)
Target: 7020 / 7000
Stop: Above 7060
Long Deep Pullback
Entry: 6920-6925 (1H HL)
Target: 6975 / 7000
Stop: Below 6910
Economic Calendar - Friday Jan 16
8:30 AM ET → Business Leaders Survey (Low)
9:15 AM ET → Industrial Production & Capacity Utilization ⚠️ (High)
11:45 AM ET → NY Fed Staff Nowcast (Low)
Industrial Production is the main event. A beat confirms manufacturing strength and supports continuation toward 7017.25+. A miss could offer pullback opportunity toward structural support.

Gold and Silver (MCX)- updateGold and silver - follow the trend- key levels.
Trend update and key levels to watch.

EURUSD Key Levels: Failure vs Continuation Points Today's focus: Key structural levels that determine EURUSD's next move. No predictions—just price behaviour and structural points.
💡 Trading Philosophy:
"Trade what you SEE, not what you THINK."
This is the foundation of mechanical trading. Stop predicting. Start observing structure and reacting to what price actually does at key levels.
📊 Current EURUSD Structure:
Trading At: 1.17197 (Structural Point)
Key Observation:
We have NOT seen a failure at this level yet. Price is holding structure, which suggests selling continuation is the higher probability scenario.
🎯 Downside Levels (Selling Continuation):
Next Target: 1.17033
If 1.07197 holds as structure, this is the next downside objective.
Major Level Below: 1.16821 (Previous Momentum High - TURNCOAT)
This was former resistance that has now been tested and turned into support. This is a critical "turncoat" level—resistance became support, making it a high-probability bounce zone.
🔼 Upside Levels (If Structure Breaks):
If price fails at current structure and breaks higher, watch these levels:
Level 1: 1.1750
Level 2: 1.1762 (Momentum High)
Level 3: 1.1841 (Current Momentum High)
These become your upside targets IF the current structure fails to hold.
For Detailed Context:
Check my previous EURUSD posts for the bigger picture wave structure and how we arrived at these levels.
👍 Boost if this structural breakdown helps
👤 Follow for continued EURUSD level updates
💬 Are you trading what you SEE or what you THINK?

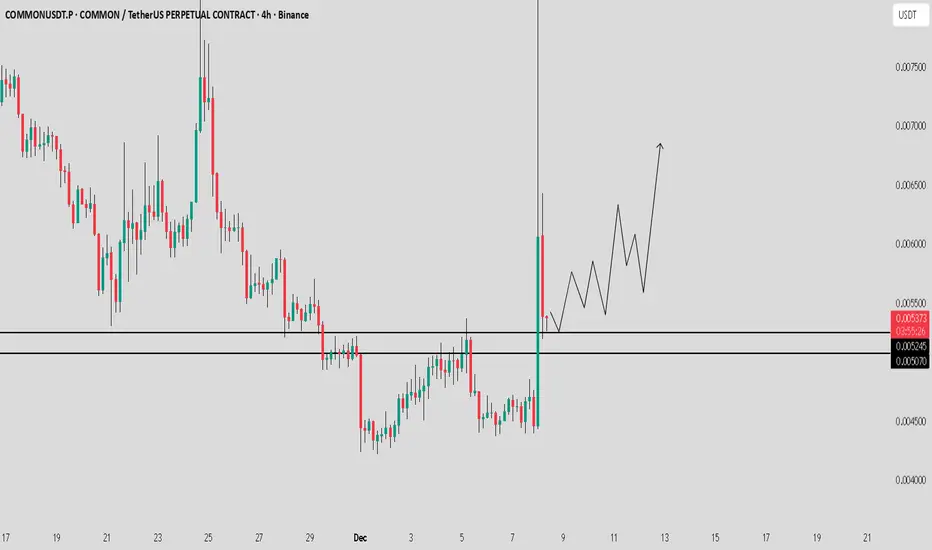
Common / USDT key zone ahead_ Expecting 15-20% upside moveKeep a close watch on this zone. If the price shows a strong reaction here, we could see a solid 15–20% move soon.
XAUUSD: Bearish Correction Targets $3822 amidst Uptrend.Scenario: Bearish Corrective Move within a larger Uptrend.
Current Price (Approx.): $4,218.81
Chart Context: Price has already retraced from the recent high of $4,381.73 and is currently hovering near the 0.236 Fibonacci Retracement ($4,249.74) and above the 0.4 Fibonacci Retracement ($4,158.02).
Key Levels
Key Resistance Zone (Potential Reversal): $4,338 (Close to the recent high/start of the pullback).
Primary Target (Take Profit): $3,822 (Coincides with the 1.0 Fibonacci Retracement level of the structure shown, indicating a full retracement of the move from $3,822.46 to $4,381.73).

NAS100 — 25,458 Liquidity Sweep, Target Revised to 24,989The NAS100 has completed a clear liquidity sweep at 25,458, taking out the previous swing high before rejecting the zone. This move confirms that the breakout above 25,458 was only a liquidity grab, not a structural shift. As long as price remains below this swept level, the bias stays bearish.
The rejection from 25,458 suggests that the market has collected buy-side liquidity and is now positioned to move toward the opposite side of the range. The first reaction zone is 25,054, but this level is likely to act only as an intermediate pause. The true downside magnet is now 24,989, where a deeper liquidity pool resides (lows + imbalance).
Key Level
25,458 — Sweep Liquidity Zone (bearish invalidation if reclaimed)
Targets
25,054 — Interim level
24,989 — Main target

MERL Correction LoadingWhat Goes Up Must Come Down. Waiting for one of the major resistances to hit and then short the correction towards VAH.

ES (SPX, SPY) Analyses, Key Zones, Setups for Wed (Nov 19th)Market Analysis: A Shift in Momentum for ES
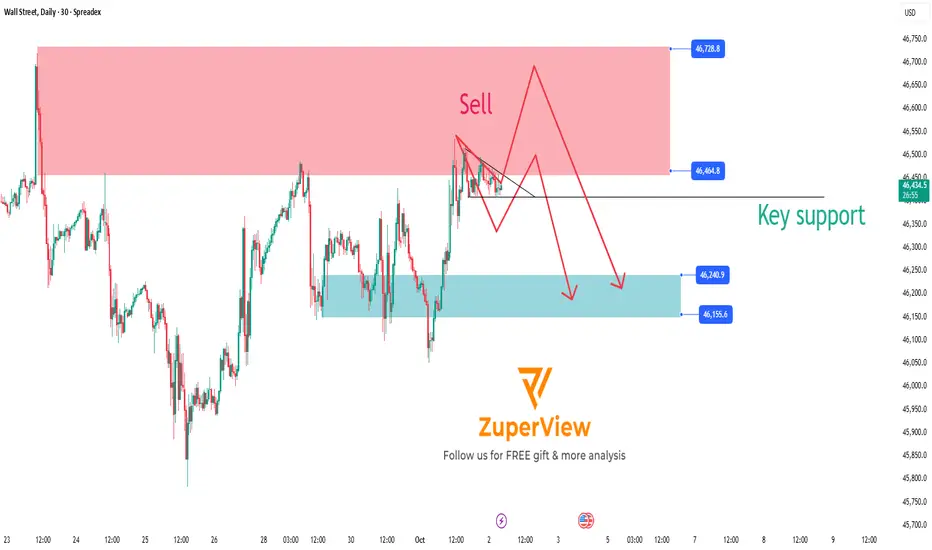
In today's market, the daily chart for the E-mini S&P 500 (ES) reveals a notable shift in momentum, characterized by a sequence of price action that signals a potential downtrend. Previously, we observed a high, followed by a lower high, and today's movement has decisively broken through the last remaining support at the higher-low shelf. This change comes after a rejection from the recent lower-high zone, situated just below the 6,900 mark, followed by a retreat through the crucial 6,700 threshold. What initially appeared to be a bullish uptick is now consolidating into a corrective downswing.
Today's significant drop marks the continuation of this emerging downward trajectory. Prices breached intraday support around 6,675 to 6,700, slid past the prior higher-low region near 6,635, and ultimately settled atop the initial daily demand zone. Notably, the selling volume during this decline expanded compared to previous sessions, underscoring that this movement reflects genuine market participation rather than mere fluctuations.
While the longer-term outlook remains bullish, reflected in the weekly trend, the daily and four-hour charts currently indicate a pronounced short-term downtrend. Key indicators include the formation of a lower high, the breach of the previous higher-low, and a liquidity run to the downside toward the extension cluster. As we move forward, this developing bearish scenario suggests potential for further declines in the coming sessions, though we are positioned within local demand territory, indicating that bounces and two-directional trading are likely in the near term.
Key Resistance Zones
Resistance 1: 6,637
This level represents today’s late-session swing high on the 30-minute chart, denoted as the S-session high (S.H 6,637). It serves as the initial resistance point above the current market price.
Resistance 2: 6,679.75 – 6,687.50
A cluster of highs, with NYAM.H marked at 6,679.75, LO.H at 6,685.75, and NYPM.H at 6,687.50, forms a critical intraday supply pocket. This region represents the primary A++ short zone should the price experience a bounce.
Resistance 3: 6,700 – 6,720
Above the NY session high band, the 4-hour chart highlights a previously broken support shelf and local supply just below 6,720. Any movement back into this area would likely be corrective within the ongoing downswing unless the E-mini S&P can close and hold a daily candle above this range.
Higher-Timeframe Cap:
Any price action remaining below the recent daily lower-high zone—situated near the last significant LH before the drop—maintains a bearish bias for the larger swing. A definitive daily close above this lower-high would be necessary to negate the current short-term downtrend.
---
Key Support Zones
Support 1: 6,627.50 and 6,614.75
The AS.L level is printed at 6,627.50, with the NL.L around 6,614.75 on the 30-minute chart. Together, these levels form the initial local support shelf just beneath the current price.
Support 2: 6,606.50 – 6,603.25
Marked by NYPM.L at 6,606.50 and NYAM.L at 6,603.25, this band serves as the next area of resting liquidity from today’s trading sessions. A clean break and sustained move below this range could pave the way for the Fibonacci targets below.
Support 3 (Major Fibonacci Cluster): 6,541.50 – 6,509.00
On the 1-hour chart, the 1.272 Fibonacci level is found at 6,541.50, while the 4-hour chart places it at 6,509.00. The daily chart marks the 1.272 at 6,521.25, creating a significant demand box from approximately 6,541 down to 6,509, with 6,521 serving as a mid-pivot. This is the pivotal "bounce or break" zone.
Support 4 (Deeper Extension Pocket): 6,501.75 – 6,458.00
The 1-hour chart identifies the 1.618 Fibonacci extension at 6,501.75 and the 2.0 extension at 6,458.00. The 4-hour chart aligns the 1.618 at 6,429.25 and the 2.0 at 6,341.50, with the daily chart placing the 1.618 at 6,418.00 and the 2.0 around 6,304.00. The initial focus for tomorrow is the 6,502–6,458 region. Should the 6,541–6,509 band fail, this area becomes a strong magnet where a more pronounced short-covering bounce is likely.
The definitive structural line on the downside is the cumulative daily 1.618–2.0 cluster, ranging from approximately 6,418 down to 6,304. A decline to this range could signify a major correction leg rather than a mere shallow pullback.
A++ SETUP 1 — REJECTION SHORT FROM NY HIGH BAND
Trigger:
15m: candle wicks into 6,680–6,688 and closes back below about 6,675.
5m/1m: a failed attempt to push higher (lower high) after that rejection.
Entry:
Aggressive: enter short 6,678–6,682 after the 15m rejection close and 1m fails to make new highs.
Conservative: limit sell in 6,680–6,685 on a controlled retest from below.
Stop (hard invalidation):
Around 6,698.00 above the band and intraday highs (about 16–20 points of risk if filled 6,678–6,682).
Targets:
TP1: 6,637.00 (session swing high). From 6,680 entry with 6,698 stop ≈ 2.3R.
TP2: 6,606.50 – 6,603.25 (NYPM.L / NYAM.L shelf), ≈ 4R from 6,680 entry.
TP3: 6,541.50 – 6,521.25 (top of fib demand cluster), campaign-style extension.
A++ SETUP 2 — EXHAUSTION LONG FROM FIB CLUSTER DEMAND
Trigger:
15m: price trades below 6,530, tags 6,521–6,509, then closes back above about 6,530 (wick through, body back up).
5m/1m: a higher low forms above roughly 6,520 after that reclaim; sellers fail to push back below the cluster.
Entry:
Aggressive: 6,525–6,535 on the first higher low on 1m/5m after the 15m reclaim of 6,530.
Conservative: limit buy near 6,525 on a controlled retest into the top of the cluster after the first reaction.
Stop (hard invalidation):
Around 6,497.00 under the bottom of the cluster and recent swing low (≈ 30–38 points of risk if entered 6,525–6,535).
Targets:
TP1: 6,595–6,600 (broken structure and local VWAP zone). From 6,530 entry with 6,497 stop ≈ 2R.
TP2: 6,637.00 (S-session high and first major resistance).
TP3: 6,679.75 – 6,687.50 (NYAM.H / LO.H / NYPM.H band), where a bounce can turn into a full squeeze.
Upcoming Economic Indicators
For tomorrow's trading session (Wednesday, U.S. time), traders should keep an eye on several key economic releases:
- At 8:30 AM ET, the U.S. will release Housing Starts and Building Permits for October, along with import/export price indices. These figures are vital for gauging growth, especially after a series of subdued permits and erratic starts.
- At 10:30 AM ET, the EIA Weekly Petroleum Status Report, alongside crude inventory data, is expected to influence energy markets and broader risk sentiment.
- Later in the afternoon, markets will be attentive to FOMC minutes and remarks from New York Fed President John Williams, both of which could impact rate-cut expectations based on the overall tone relative to recent communications.
Good luck !!!

ES (SPX, SPY) Analysis for Week Ahead (Nov 17th - 21st)Market Analysis: ES1 - Navigating Recent Price Action and Upcoming Economic Catalysts
Current Price Context:
The E-mini S&P 500 (ES1) is currently trading in the range of 6,755 to 6,785, following a sharp pullback from the 6,880 to 6,900 peak and a notable rebound off the 6,650 levels. While both the weekly and daily structures exhibit an overarching uptrend characterized by higher highs and higher lows, we are presently experiencing a mid-pullback phase, with prices resting below a newly established supply zone spanning 6,850 to 6,900. Importantly, we remain above the key demand shelf situated around 6,650 to 6,670.
Big Picture Overview: Weekly and Daily Trends
- Weekly Analysis: Over recent months, ES has ascended from approximately 6,000 to the 6,900 level. The past few weeks have seen a new high printed, followed by a red candle signaling a pullback towards mid-range levels. Despite this corrective move, we maintain a buffer above the preceding weekly low near the 6,500 to 6,550 range, affirming the uptrend. The current price action appears more as a corrective pause rather than a definitive peak.
- Daily Perspective: After reaching a new high just shy of the 6,900 mark, the market retreated into the mid-6,600s before bouncing back. Recent daily candles indicate a phase of consolidation within the 6,730 to 6,780 range, characterized by wicks on both ends and diminishing body sizes, alongside reduced volume compared to earlier volatility. Oscillator indicators are retreating from overbought conditions but appear to be stabilizing, suggesting a digestion phase rather than a full-scale momentum breakdown.
Shorter Timeframe Analysis (4-Hour and 1-Hour):
- On the 4-hour chart, a completed downward impulse from around 6,880 to the low 6,650s has been observed, with the price touching the 1.272 Fibonacci extension at approximately 6,653. Additional Fibonacci levels below include 6,597 (1.618) and 6,536 (2.0). The price action around the 1.272 extension has prompted a robust response, featuring significant green candles and increased volume, establishing a base between 6,700 and 6,800.
- On the 1-hour chart, the market exhibits a minor uptrend (from lower lows to higher highs) that has encountered resistance around 6,780. Currently, price action is consolidating near a pivot level of 6,750, leading to the establishment of a balance range between 6,720 and 6,780 as we head into Monday.
Summary: The broader context remains bullish on higher timeframes, with a corrective phase taking root on the medium timeframe, while the short-term landscape indicates balance. This scenario represents a classic "trend pullback parked on key support," with next week's developments likely steering us either back toward the highs or engendering a deeper test of 6,600 or 6,550, contingent on forthcoming economic data and Fed commentary.
Macro and Event Landscape: A Busy Week Ahead
The recent U.S. government shutdown has resulted in a considerable backlog of economic data releases. Market participants will be closely monitoring delayed payroll data, along with other significant indicators such as industrial production and housing metrics that are being released simultaneously. This aggregation of data is anticipated to introduce intraday volatility, particularly during the 8:30 to 10:00 AM ET windows.
Key Economic Indicators to Watch:
- Core Data Releases: In the week of November 17–21, critical releases include:
- Empire State manufacturing index
- Import and export price indices
- Industrial production and capacity utilization figures for October
- Housing starts and building permits scheduled for mid-week
- Additional delayed labor data later in the week as agencies address the backlog.
- FOMC Minutes and Fed Commentary: The release of the FOMC minutes from the late October meeting will communicate the Fed's confidence in the recent improvements in inflation and its openness to potential rate cuts in December. A lineup of Fed speakers is set to take the stage, likely influencing market sentiment and causing price reactions based on their comments.
- Corporate Earnings: Noteworthy earnings reports from Nvidia and major retailers, including Walmart, are on the calendar. Nvidia's performance will be scrutinized as a barometer for the AI segment, while insights from retail giants will provide a glimpse into consumer health as the holiday season approaches. Strong results coupled with optimistic guidance tend to buoy ES, while any disappointments could weigh on index futures, especially given the concentrated leadership from a handful of major tech stocks.
Market Sentiment and Positioning: Rate-cut expectations for December have decreased to about 40%, leaving investors cautious but not overly alarmed. This environment allows for potential relief rallies if data and Fed sentiments tilt favorably, while a series of negative reports may trigger a notable risk-off sentiment.
Conclusion: The upcoming week is poised to be event-driven, lacking a singular "mega" release like CPI but rather presenting a series of medium-to-large catalysts (Fed minutes, late payrolls, industrial production, housing statistics, Nvidia, and Walmart). Traders should be prepared for choppy conditions and liquidity fluctuations around the release times, with clearer directional moves anticipated between these events.
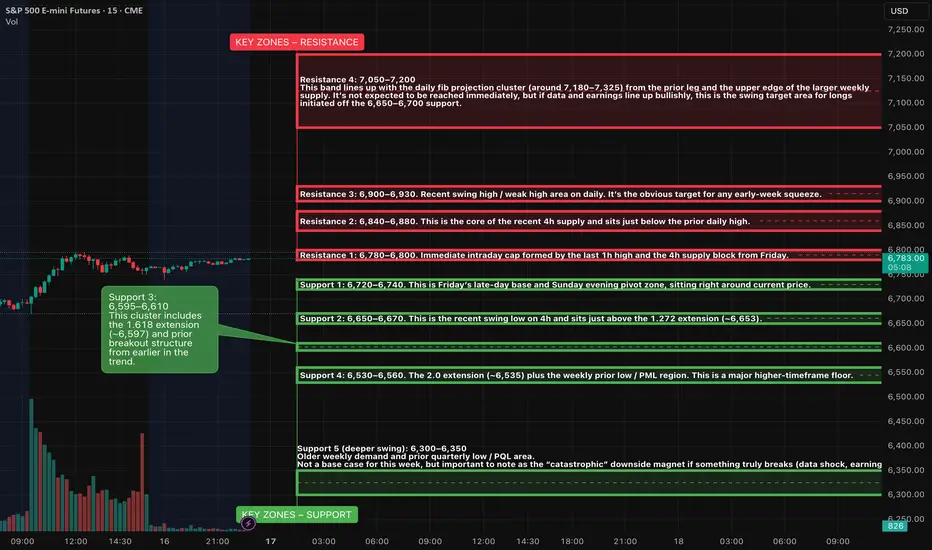
KEY ZONES – RESISTANCE
Resistance 1: 6,780–6,800
Immediate intraday cap formed by the last 1h high and the 4h supply block from Friday. This is the ceiling that has repeatedly turned price in the last session. A 1h or 4h close above 6,800 would confirm that buyers are back in control and likely aim for 6,850+ fairly quickly.
Resistance 2: 6,840–6,880
This is the core of the recent 4h supply and sits just below the prior daily high. It’s where the last strong sell program launched. If price trades into this pocket on light volume and stalls, that favours a lower-high top and another rotation back toward 6,720–6,700. If the tape pushes through decisively, shorts will be forced to cover.
Resistance 3: 6,900–6,930
Recent swing high / weak high area on daily. It’s the obvious target for any early-week squeeze. If this zone gets cleaned out and holds on the retest, the uptrend resumes and we can start talking about higher fib extensions and a run toward the 7,000 handle. A sharp rejection here, especially around Fed minutes or Nvidia earnings, would fit a double-top pattern and could kick off a deeper pullback leg.
Resistance 4: 7,050–7,200
This band lines up with the daily fib projection cluster (around 7,180–7,325) from the prior leg and the upper edge of the larger weekly supply. It’s not expected to be reached immediately, but if data and earnings line up bullishly, this is the swing target area for longs initiated off the 6,650–6,700 support.
KEY ZONES – SUPPORT
Support 1: 6,720–6,740
This is Friday’s late-day base and Sunday evening pivot zone, sitting right around current price. It lines up with the 1h equilibrium where price has been rotating. As long as ES holds above 6,720 on closing basis, buyers are defending the immediate balance and can make another push toward 6,780–6,800.
Support 2: 6,650–6,670
This is the recent swing low on 4h and sits just above the 1.272 extension (~6,653). It’s the first real higher-timeframe demand pocket of this pullback. A clean tag and strong bounce here would look like a classic trend-pullback low forming. A sustained break under 6,650 would suggest the market isn’t done repricing and opens the door to the deeper fibs.
Support 3: 6,595–6,610
This cluster includes the 1.618 extension (~6,597) and prior breakout structure from earlier in the trend. It’s the “deeper but still healthy” retrace area; if ES flushes into this band on bad data then snaps back, it can still preserve the weekly uptrend. Failing here would start to threaten the bullish structure and invite a test toward the prior weekly low.
Support 4: 6,530–6,560
The 2.0 extension (~6,535) plus the weekly prior low / PML region. This is a major higher-timeframe floor. If ES ever gets here this week, the tape is likely under stress, but it also becomes the zone where large buyers usually test the waters for a bigger swing entry. A weekly close below ~6,530 would be the first real warning that the uptrend is morphing into something more corrective or even distributive.
Support 5 (deeper swing): 6,300–6,350
Older weekly demand and prior quarterly low / PQL area. Not a base case for this week, but important to note as the “catastrophic” downside magnet if something truly breaks (data shock, earnings disaster, geopolitical flare-up).
SETUPS – WEEK AHEAD IDEA PACK
1. Trend-pullback continuation long from support
Location: 6,650–6,670 primary, 6,595–6,610 secondary.
Trigger idea:
Look for an overnight or early-week sweep into 6,650–6,670 that quickly rejects (long lower wick on 1h / 4h, strong reclaim back above 6,680). Ideally, this happens outside the heaviest data windows so it’s more order-flow driven than headline noise.
If that fails and price drives into 6,595–6,610 instead, repeat the same logic there: washout, strong reaction, then a reclaim of 6,620–6,630 as confirmation that buyers stepped in.
Upside path from this setup:
First target is the 6,780–6,800 cap. If that gives way, next magnet is 6,840–6,880, then a possible extension run at the 6,900–6,930 recent high area. Later in the week, if macro tailwinds show up, this move can stretch toward 7,000 and, in an optimistic case, into the 7,100+ fib cluster.
Risk management conceptually:
From a swing perspective, the “line in the sand” for this idea is under 6,595. A clean daily close below that level would invalidate the shallow-pullback idea and suggest we are heading toward 6,530–6,560 or lower.
2. Short-term fade from the 6,840–6,880 / 6,900 pocket
Location: 6,840–6,880 first, 6,900–6,930 as extension.
Trigger idea:
If ES trades up into 6,840–6,880 ahead of Fed minutes or the Nvidia/Walmart prints and shows tired price action (long upper wicks on 15m/1h, loss of intraday momentum, failure to hold above 6,860), that area is attractive for a tactical short aiming back toward the 6,780–6,750 pivot.
A more aggressive fade is possible into 6,900–6,930 if the first test breaches 6,880 but immediately stalls at the prior high.
Downside path from this setup:
First magnet is the 6,780–6,800 band, then the balance base at 6,720–6,740. If that gives way on a macro shock, sellers can push for a retest of 6,650–6,670.
Risk management conceptually:
For shorts initiated at 6,840–6,880, a protective stop makes sense above 6,910–6,920. Fades taken into a full sweep of 6,900–6,930 should respect a hard stop above ~6,950; above that, risk of a proper breakout toward 7,000+ increases sharply.
3. Range-trade scalps inside 6,720–6,780
While ES is stuck inside this intraday box, there is room for mean-reversion trades: buying dips into 6,720–6,730 and selling pushes into 6,770–6,780 with tight intraday stops. This is a lower-quality idea compared to the bigger levels, but it’s relevant if Monday and early Tuesday stay choppy while everyone waits for the meat of the calendar mid-week.
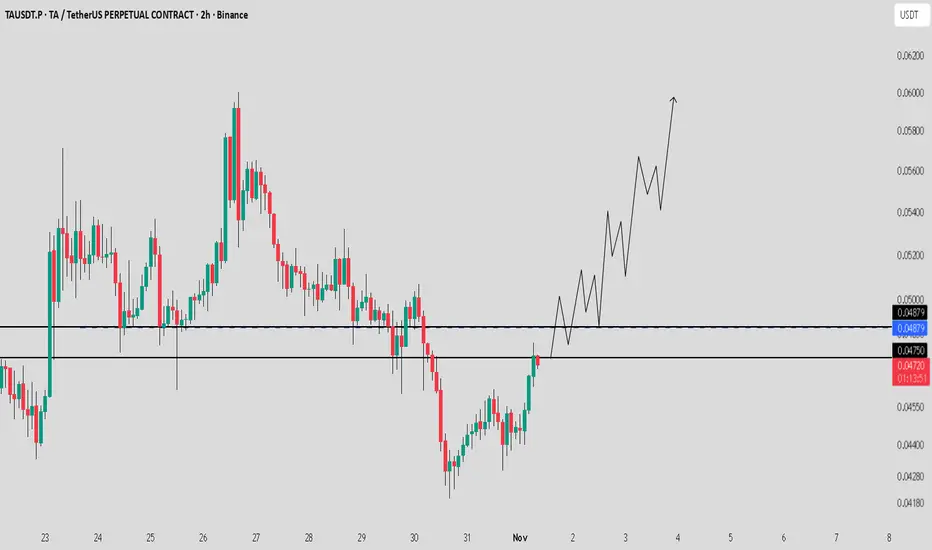
TA / USDT : Breakout setup loading / Target $0.55 - $0.60TA / USDT is showing strength and currently testing a key resistance zone.
If price breaks out with strong momentum, we may see a bullish move toward $0.55 – $0.60.
Manage risk wisely and always wait for clear breakout confirmation before entering.
Resistance Cracked, GBP/JPY Targets 202.65 and 203.25Price has successfully broken above the key resistance zone around 202.200, confirming a bullish break of structure (BOS). This marks a potential shift in momentum after a period of consolidation and minor bearish pressure.
With this breakout, GBP/JPY is now positioned for a possible continuation toward the upside.
Key Upside Targets:
Target 1: 202.655
Target 2: 203.248 (previous strong high & supply zone)
Market Structure Notes:
Multiple BOS confirmations
Breakout above resistance with strong bullish intent
Clean liquidity zones above that price could seek
Outlook:
As long as price holds above the breakout zone and does not fall back into the previous range, we remain bullish toward the stated targets.

9 Weeks Bull Run Is Over, $4000 In Sight Gold has officially broken out of its 9-week bullish rally, marking a shift in market structure. The recent breakout below the ascending channel signals the end of the strong upward momentum.
Now, price is clearly respecting key support levels on its way down. Each level is acting as a temporary pause in the move, but momentum remains bearish.
If this structure continues to hold, we anticipate a continued correction toward the $4000 zone, which aligns with previous demand and technical confluence.
Bearish Outlook
Bullish channel broken
Price respecting lower support zones
Correction likely to extend to $4000
Note: A clean break below each support zone increases the probability of reaching the $4000 target.

Xau/Usd - Smart Money Setup, Targeting Liquidity Above Weak HighMarket Structure & Key Levels:
The chart shows a clear bullish trend with consistent Breaks of Structure (BOS) to the upside.
Change of Character (CHoCH) occurred after a bearish move, indicating a shift in market sentiment.
Price reclaimed the Important Key Level (highlighted in grey), showing it now acts as a strong demand zone.
Current Price Action:
Price has formed a Weak High near the 4,128.210 level, which is likely to be targeted and taken out.
Market structure remains bullish with consistent higher highs and higher lows.
Projected Move:
Expecting a short-term pullback into the demand zone (previous structure area).
Anticipating bullish continuation afterward with the target being the liquidity sweep above the Weak High.
The area around 4,150 appears to be the TARGET for this next impulsive move.
Key Zones to Watch:
Demand Zone: Between 4,050 – 4,075 (watch for bullish confirmation if price pulls back).
Liquidity Target Zone: Above 4,128.210 (Weak High), aiming for a stop-hunt/liquidity grab.
Strategy: Smart Money Concepts (SMC)
Watch for bullish price action at the demand zone.
Wait for confirmation (e.g., BOS on lower timeframes) before entering long positions.
Timing:
Setup likely to play out within the next 24–48 hours based on current 1H structure.

ES (SPX, SPY) Analyses, Key-Zones, Week (Mon 10/13 → Fri 10/17)Macro drivers to watch (ET)
Powell (NABE) — Tue 10/14 ~12:20. Markets will parse tone on growth/inflation. (Fed official calendar confirms time & venue.)
PPI (Sep) — Thu 10/16 8:30. First major U.S. inflation print of the week. (BLS “Next Release”.)
Advance Retail Sales (Sep) — Thu 10/16 8:30. Key read on demand into holiday season. (Census “MARTS” note; FRED release calendar.)
CPI (Sep) — not this week; rescheduled to Fri 10/24 8:30 due to the shutdown. (BLS reschedule notice; CPI schedule.)
Earnings kick-off (could move ES): JPM Tue 10/14, BAC Wed 10/15. (Company IR pages/press.)
Market conditions: U.S. bond market closed Mon 10/13 (liquidity thinner); NYSE equities open. (SIFMA; NYSE hours.)
Options expiration: standard monthly Fri 10/17. Expect pinning flows. (Cboe 2025 calendar.)
Setups (Level-KZ Protocol — 15m→5m→1m; NY kill-zones preferred)
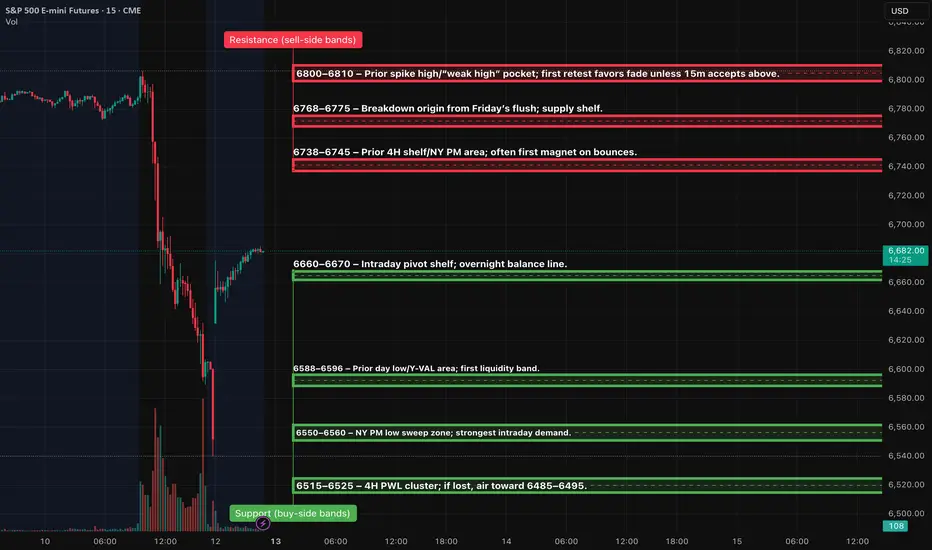
TIER-1 (A++) — Rejection Short at 6790–6810 (NY AM)
Trigger: 15m full-body fails to hold above 6790–6810 → 5m prints a lower-high and re-closes back inside → 1m first pullback “pop-and-fail”.
Entry: 6796–6803 on the 1m failure.
Invalidation: Hard SL above the 15m fail-wick (guide 6814).
TPs: TP1 6738–6745, TP2 6690–6700, TP3 6625–6635.
TIER-1 (A++) — Quick-Reclaim Long at 6550–6560 (Asia/London → carry to NY)
Trigger: Liquidity sweep into 6550–6560, immediate 15m re-close back above 6600, 5m holds ≥6620, 1m higher-low entry.
Entry: 6602–6610 on the first pullback that holds.
Invalidation: Hard SL below the 15m sweep-low (guide 6544).
TPs: TP1 6690–6700, TP2 6738–6745, TP3 6768–6775.
TIER-2 (A+ Bounce) — 6590–6596 fast reclaim
Trigger: Wick through 6590–96 that immediately reclaims ≥6620 on 5m.
Entry/SL: Enter 6615–6622; SL below sweep-low −0.5pt.
Targets: 6690 then 6738–45. ¾ size.
TIER-3 (A Bounce) — 6515–6525 exhaustion flush
Trigger: Capitulation into the 4H PWL band with 15m reversal signal.
Entry/SL: Scale inside the band; SL below the 15m reversal wick.
Targets: 6590–96 then 6690. ½ size; only first touch.
US30: Key support breakdown signals potential sell opportunity
1. Current Market Overview 🌐
The SPREADEX:DJI index is approaching a significant resistance zone where selling pressure is expected to be strong. The price is currently consolidating and moving sideways around this area, preparing for a major move.
2. Technical Signals and Momentum Indicators 📊
Momentum indicators such as MFI, RSI, and Stochastic have all entered the oversold territory, while also showing signs of price compression (consolidation), indicating the market is waiting for the next breakout.
The strong resistance zone and the Overbought/Overextended (OB/OS) signals suggest that buying pressure is weakening, which is favorable for sellers.
3. Sell Scenario on Key Support Breakdown 🔻
If the price breaks below the important Key Support level shown on the chart, this will confirm the beginning of a downtrend.
Traders can consider opening sell positions as soon as the breakout occurs to take advantage of the downward momentum.
The price target is expected to move toward lower support zones where buying interest may emerge to cause a price correction.
4. Risk Management ⚠️
Place stop-loss orders above the resistance zone or the nearest recent highs to protect against unexpected market moves.
Adjust your position size according to your risk tolerance.
5. Conclusion 🔑
The sell setup on US30 is very clear with a strong resistance zone and momentum signals indicating a potential upcoming downtrend.
Main scenario: Breaking the Key Support will trigger a strong decline, providing a profitable trading opportunity for sellers.
Wait for a confirmed support break before entering the trade to ensure safety and effectiveness.
Please like and comment below to support our traders. Your reactions will motivate us to do more analysis in the future 🙏✨
Harry Andrew @ ZuperView
ES (SPX) Weekly: Levels & Setups - Sep 8-12, 2025Price is camped under a higher-timeframe supply/“weak-high” band. Trend remains constructive on the Weekly/Daily, but 4H/1H are coiling beneath resistance. I’m neutral into mid-week inflation data and will only engage on clean acceptance above the prior-high band or a rejection back into range.
Event stance: Two inflation releases hit 08:30 ET mid-week. I’ll be flat into the prints and wait for the first qualifying 15-minute close before arming anything
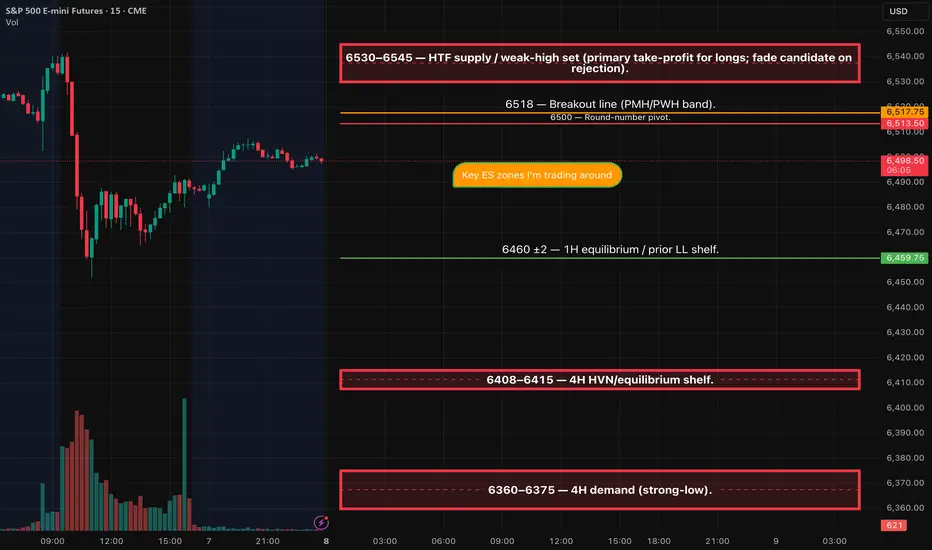
Key ES zones I’m trading around
6530–6545 — HTF supply / weak-high packet (primary take-profit for longs; fade candidate on rejection)
6518 — Breakout line (PMH/PWH band)
6500 — Round-number pivot
6460 ±2 — 1H equilibrium / prior LL shelf
6408–6415 — 4H HVN / equilibrium shelf
6360–6375 — 4H demand (strong-low)
Setup 1 — Breakout-Acceptance LONG
Trigger: 15m close > 6518, then two 5m bodies hold above.
Entry: 6520.5–6523.0 on the retest or break of bar-2 high.
Stop: tighter of (i) below the 15m trigger candle low, or (ii) below the last confirmed 5m swing; cap ≤ 6–8 pts.
• If neither option fits ≤ 8 pts from your fill, pass and wait for a cleaner micro HL.
TP1 (dynamic): first hard band (e.g., any workable print inside 6530–6545) that yields ≥ max(15, 2.5×SL) from your fill (front-run 0.25–0.5 pt if 2.5R is tight).
TP2/TP3: 6550, then 6570; trail by 15m/30m closes.
• Disqualifiers: any 5m body back ≤ 6518 before TP1; visible liquidity wall ≤ 5 pts beyond trigger; news window.
Setup 2 — SRR Rejection SHORT (Sweep → Recapture → Reversal)
Trigger: Sweep 6518–6530, fail, then 15m bearish close < 6518.
Entry: 6515.0–6518.0 on the retest from below.
Stop: tighter of (i) above the 15m trigger candle high, or (ii) above the last confirmed 5m LH; cap ≤ 6–8 pts.
• I f the correct structural stop is > 8 pts from your fill, skip until a micro LH tightens risk.
TP1 (dynamic): first hard band below that gives ≥ max(15, 2.5×SL) from your fill—usually 6500; if 2.5R isn’t met to 6500, promote to 6482, then 6460.
TP2/TP3: 6482, then 6460 (extend toward 6410 if momentum).
• Disqualifiers: no 15m bearish confirmation; any 5m body ≥ 6518–6522 after entry (use your exact line); news window.
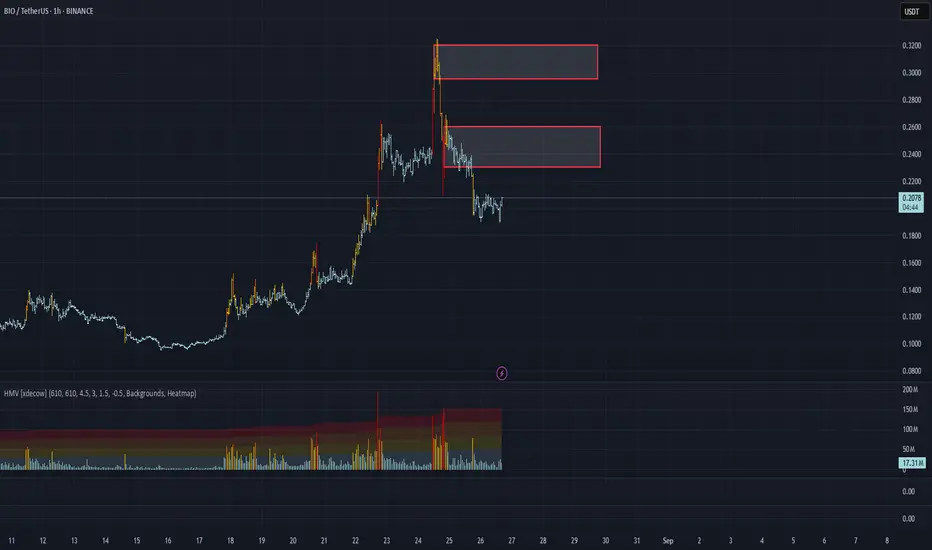
BIO/USDT Analysis. Short Setup
This asset has shown a trend break. Above the current price, there are volume zones that have already received positioning. If one of them is tested and we see a reaction, we consider short entries. Target potential — ~$0.17.
Sell Zones:
$0.23–$0.26
$0.295–$0.32
*This post is not financial recommendation. Make decisions based on your own experience.
XAUUSD Update | Gold Builds Energy Ahead of FOMCGold continues to consolidate within a tight range, with selling pressure becoming more visible. With just over a day left until the FOMC meeting – a key event that could set the tone for the next major trend – the market seems to be loading up for a liquidity sweep.
👉 While price action may look messy and indecisive, for KeyLevel traders, this is the perfect hunting ground. Liquidity zones are being respected with precision, offering clean setups for those who understand MMFLOW structures.
📉 Market Outlook
Primary Bias: Short-term corrective downside.
Possible Play: Liquidity grab into the 331x area before a strong rebound higher.
🔑 Key Trading Levels
Sell Zone: 3340 – 3345 | Tight SL: 4 – 5 pts
🎯 Targets: 3325 → 3317 → stretch 3310
📌 Note: Stay disciplined around these KeyLevels. One sharp BreakOut post-FOMC could trigger the next big directional move.
✨ As always with MMFLOW: KeyLevels = Profits ✅
🔥 Follow MMFLOW TRADING to catch daily setups, smart money footprints, and precision KeyLevels.

DXY Market Outlook: Eyes on 99.392Hello Traders,
DXY found buyers at the 97.921 level we tracked last week and managed to close daily candles above this level. We can now refer to this area as a rejection block (D + RB). This week, the block was retested and encountered rejection from buyers.
With this buyer reaction, our target is the peak level of the consolidation that brought the price here (99.392).
There's a minor level to watch along the way: 98.586. However, considering the key level where the price reacted and the weekly chart showing no major obstacles ahead, we believe that targeting the peak of the consolidation that initiated the last decline (99.392) is the more suitable approach.
Taking news data into account—and more importantly, geopolitical factors and unexpected developments—we still acknowledge the possibility of the price sweeping the low again. However, we don’t expect this to invalidate the overall scenario. With news catalysts, we anticipate the price reaching the target within the week.
Until the next update, wish you many pips!

Stuck in the Zone: DXY Tests Balance Between 98 and 99Hello Traders,
After a sharp and uninterrupted decline in the DXY, price found support at the 97.921 level. Sellers then regained control from the weekly bearish Fair Value Gap (W-FVG), pushing price back into the 99 zone.
In this zone, neither sellers nor buyers have managed to assert dominance—suggesting that these levels may act as a pause or balance point. Given the extended drop, a temporary correction could follow if buyers gain traction after one last push.
For now, the bearish USD narrative remains intact. With upcoming catalysts like China/US talks and tomorrow’s CPI release, a renewed move toward 98 is likely to accelerate.
Whether this leads to further selling or a corrective phase will be assessed afterward.

NQ KEY LEVELS - 22nd APRIL 2025Key levels marked by using low volume nodes for potential key levels where we may see price react.
