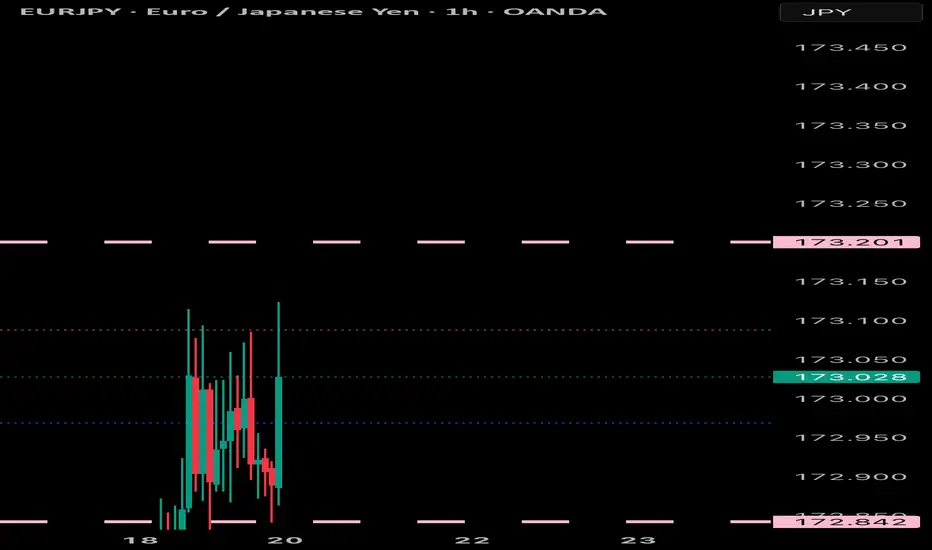
Keylevels

ES (SPX, SPY) Analysis, Key Zones, Setups for Wed, Jan 21
Today was the worst session since April - S&P 500 dropped 2.1%, wiping out 2026 gains. The catalyst? Trump's Greenland tariff escalation ahead of Davos. 10% tariffs on 8 EU countries starting Feb 1, rising to 25% by June 1. Supreme Court declined to rule on tariff authority today, extending uncertainty at least another month.
Critical Event Tomorrow: Trump's Special Address at Davos runs 8:30-9:15 AM ET - directly overlapping cash open. This is the primary catalyst. Any headline could swing markets 50+ points.
ECONOMIC CALENDAR - JAN 21
- 8:30 AM ET: Housing Starts & Building Permits
- 8:30-9:15 AM ET: TRUMP DAVOS SPEECH
- 10:00 AM: Pending Home Sales
Housing data releases simultaneously with Trump's speech - expect it to be overshadowed entirely.
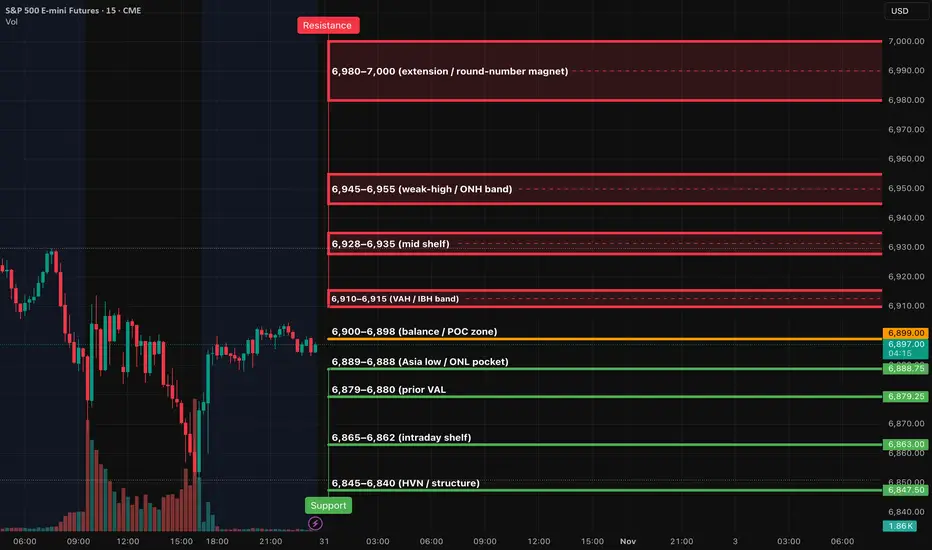
TECHNICAL STRUCTURE
Daily: Price at 6,848.50 holding above 1.618 fib (6,834.50). Premium-to-discount transition in progress after rejection at HH near 7,040.
4H: CHoCH+ triggered at 6,923 confirming bearish shift. Price trading in discount below Equilibrium (6,923.25). Key fibs: 1.272 (6,873.50) | 1.618 (6,834.50) | 2.0 (6,791.25). PWL at ~6,923.25.
1H: Clear LH → LL sequence. PWH at 7,020 (premium trap). BOS confirmed. PML at 6,764.75.
KEY ZONES
RESISTANCE (Shorts):
- 6,865-6,875: VWAP + 1.272 Fib - first rejection zone
- 6,896-6,905: NYAM.H (6,904.75) + Asian resistance
- 6,920-6,935: CHoCH+ origin + Equilibrium - strong supply
- 6,960-6,975: Major liquidity wall (Davos relief rally target)
SUPPORT (Longs):
- 6,834-6,843: 1.618 Fib + AS.H - first bounce zone
- 6,815-6,822: NYPM.L (6,822.25) + 1.272 extension
- 6,791-6,800: 2.0 Fib - psychological confluence
- 6,764-6,780: PML (6,764.75) - STRONG BID expected
SCENARIOS
BEARISH CONTINUATION (60%)
Trump hardlines, no diplomatic progress, EU threatens retaliation.
- Break below 6,834 → 6,791 → 6,764
RELIEF BOUNCE (30%)
"Constructive dialogue" headlines, Feb 1 deadline pushed.
- Squeeze to 6,905-6,920, potential 6,960 extension
CHOP (10%)
Markets await clarity, range 6,820-6,880.
TRADE SETUPS
SHORT @ Premium Rejection
- Entry: 6,896-6,920
- Stop: 6,940
- T1: 6,865 (31-55 pts)
- T2: 6,834 (62-86 pts)
- T3: 6,791 (105-129 pts)
- Confirmation: CVD divergence, absorption failure
LONG @ Discount
- Entry: 6,791-6,800
- Stop: 6,764
- T1: 6,834 (34-43 pts)
- T2: 6,865 (65-74 pts)
- Confirmation: CVD divergence, institutional absorption
RISK NOTES
1. Headline risk EXTREME - size 50-75% of normal
2. Cash open = speech overlap (8:30-9:15 ET)
3. Watch EUR/USD as leading indicator
4. VIX elevated - mean reversion could fuel squeeze
WATCHLIST
- NFLX: Beat earnings, pausing buybacks for Warner deal
- 10Y: 4.29% - above 4.35% = pressure, below 4.20% = relief
- Gold: $4,700+ record - risk-off barometer
- Bitcoin: Cracked $90K
Bearish bias with headline optionality. Structure says lower but Davos = binary risk. Focus 6,920 resistance for shorts, 6,791-6,800 for longs. Let order flow confirm. NOT a session to overtrade.
Good Luck !!!


Key Breakout Setup: #ZEC Eyes $475-$530 RallyIn this technical analysis, I break down the current price action using a multi-timeframe approach. Starting with the 4-hour chart, I then zoom out to capture the broader market structure and identify how price recently broke above local highs before pulling back to retest that level as new support—a classic bullish confirmation pattern.
Zooming back in, I outline the critical $400 level that's keeping the near-term outlook bullish. As long as price holds above this support, we're positioned for a potential breakout toward the $475 target area, which could then open the door to the $530s.
I also cover downside risk management, including the key levels to watch that would signal weakness and potentially trigger a move to new lows. Whether you're looking for entry opportunities or managing existing positions, this video provides the technical levels you need to navigate the current setup.


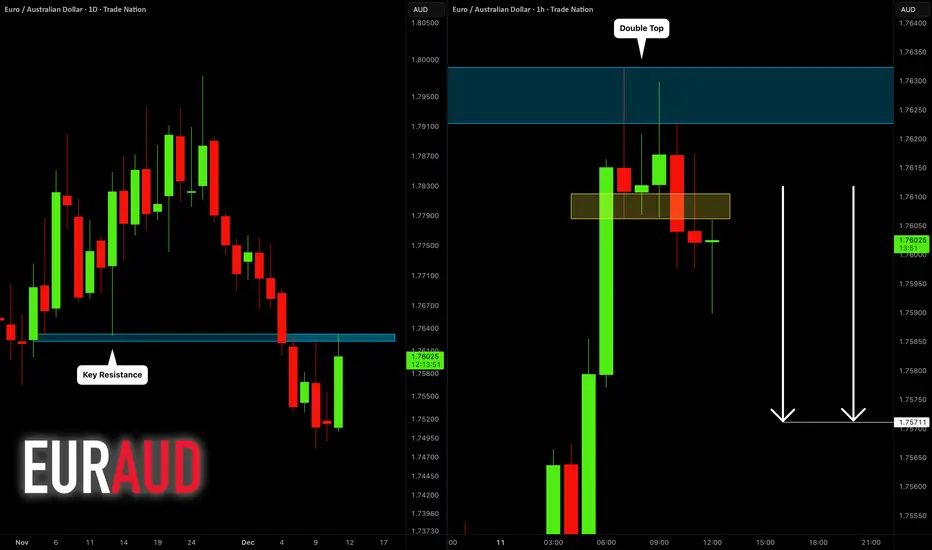
EURAUD: Bearish Move From Key Level 🇪🇺🇦🇺
EURAUD will most likely drop from a key daily resistance level.
I opened my short position on a retest of a broken neckline of
a double top pattern on an hourly.
Goal - 1.7571
❤️Please, support my work with like, thank you!❤️
I am part of Trade Nation's Influencer program and receive a monthly fee for using their TradingView charts in my analysis.
XAUUSD — Long-Term Bullish Structure Toward 4708.76Market Structure
Gold remains in a strong long-term bullish trend, supported by higher-timeframe momentum and repeated accumulation phases. The current price action is consolidating above major structural supports, keeping the long-term upside target 4708.76 valid.
Key Support Zones
Key Support Zone 1 — 3839
This is the primary structural floor. As long as price holds above 3839, the bullish trend remains intact and the path toward the higher target stays open.
A clean bounce from this zone would reinforce the bullish continuation.
If 3839 Breaks — Key Support Zone 2 — 2775
A decisive breakdown below 3839 would signal a deeper correction toward the secondary support at 2775.
This zone represents a major historical demand area, where large-scale buying interest is expected to reappear. A hold above 2775 would maintain the long-term bullish macro outlook.
Main Target
4708.76
This is the projected long-term extension target based on the broader impulse wave. As long as gold stays above 3839, the probability of reaching this upper target remains high.

GBP/USD — Bearish Outlook Toward 1.26867GBP/USD remains under sustained bearish pressure after failing to hold above the key structural levels at 1.34825 and 1.33906. These two resistance zones now define the upper boundary of the broader downtrend, confirming that sellers remain in control.
Price is currently moving within a corrective phase, and any recovery attempt below these key levels is expected to face renewed selling interest. The bearish continuation scenario remains valid as long as the pair stays capped below 1.33906.
The next major objective for bears is the downside target at 1.26867, corresponding to the 1.0 Fibonacci extension and the final completion zone of the current corrective wave.
A break below intermediate supports—1.31642, 1.30846, and 1.29907—will accelerate momentum toward the target.
Key Levels
Major Resistance: 1.34825
Secondary Resistance: 1.33906
Intermediate Supports: 1.31642 • 1.30846 (50%) • 1.29907 (0.618)
Final Downside Target: 1.26867

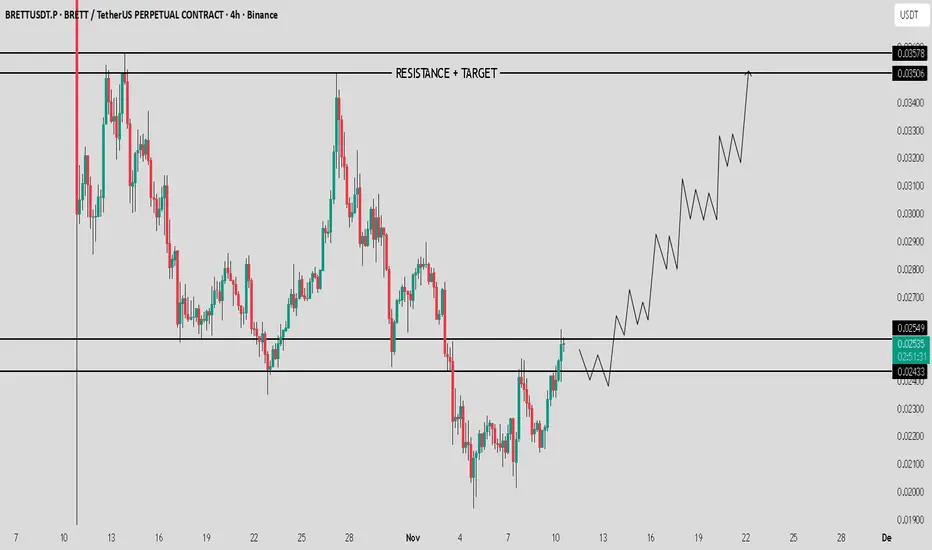
BRETT / USDT : 30-40% move ahead if breakout confirmsBrett / USDT is showing strong momentum and currently testing key zones.
A confirmed breakout from this level could trigger a 30-40% bullish move.
Wait for confirmation and manage risk wisely.
ES (SPX, SPY) Analysis, Key Zones, Setups for Fri (Oct 31st)Kill-zones (ET): NY AM 09:30–11:00; manage 12:00–13:00; NY PM 13:30–16:00.
Event (Fri): 9:45 ET Chicago PMI (unaffected by shutdown).
Upside continuation (LONG):
6,910 flips to support with a 15m close above → 5m pullback holds → 1m HL entry.
SL: 15m trigger-wick ±0.25–0.50.
TP1 6,928; TP2 6,945–6,955; TP3 6,980–7,000.
Quick-reclaim bounce at 6,889–6,888: sweep and instant reclaim → ride to 6,898 → 6,904–6,910.
Pop-and-fail shorts (SHORT):
Reject 6,904–6,910 then 15m closes back under 6,904 → 5m LH entry.
SL: 15m wick.
TP1 6,898; TP2 6,889; TP3 6,879.
Clean breakdown of 6,889 with a 15m close ≤6,887 → 5m LH entry.
TP1 6,879; TP2 6,865; TP3 6,845.
Management & risk
Viability gate: only take a trade if TP1 ≥ 2.0R using the 15m-wick stop.
At TP1: close 70%, set the 30% runner to BE; runner aims TP2→TP3.
Max two attempts per level per session.
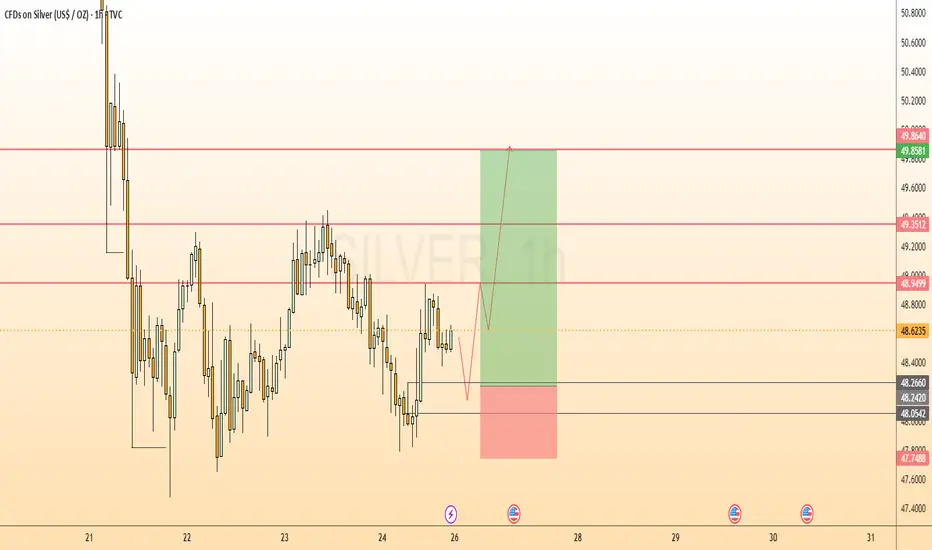
SILVER UpdateNext move on the way, focus on proper risk management & stay disciplined. Wishing you successful trades..!
Key Reason:
1. 1H Bullish OB formation.
2. BISI still in pending.
3. From this zone possible bullish move expected.
Let's see how it will work.
Support and Resistance VS Supply and Demand Explained
In the today's post, I will compare support and resistance levels with supply and demand zones.
I will explain to you the difference between them and share important tips and examples.
What are support and resistance levels?
We also call them key levels. These are particular levels on a price chart from where in the past we saw significant bullish or bearish movements.
Key support will be a one single level, that has a historical significance and from where a bullish reaction will be anticipated.
The all-time low on USDCHF will be a perfect example of a key support.
It is one single level that was respected one time in the past and from where a bullish reversal initiated.
Key resistance will be a one single level on a price chart that has a historical significance and from where a bearish movement will be expected.
The all-time high on Gold will represent a key horizontal resistance.
That level was respected one time in the past and from that level exactly the market dropped heavily.
What are supply and demand zones?
In comparison to support and resistance levels, supply and demand zones are the areas on a price chart. The zones that are based on multiple touches and consequent strong bullish or bearish reactions.
Demand zone will be the area that was tested at least 2 times in the past, and the price should strictly respect different price levels within that area.
A similar reaction will be anticipated from the demand zone in the future.
The yellow area above will a good example of a demand zone.
You can see that the price tested that area 3 times, and each time the market respected different levels lying within that.
These 3 tests compose the demand area.
Supply zone will be the area that was tested at least 2 times in the past and the price should strictly respect different price levels within that area.
A similar reaction will be anticipated from the demand zone in the future.
In this example, a supply area on EURUSD is based on 2 touches of key levels, lying very close to each other.
On the chart above, I underlined 2 horizontal support levels - the single levels that were respected by the market multiple times, and a supply zone - the area that is based on tests of multiple levels lying close to each other.
Support and resistance levels give you SINGLE levels from where you can look for trading opportunities. While supply and demand zones represent the areas . After a test of a supply and demand zone, the market may react to a RANDOM level within that.
For newbie traders, it is highly recommendable to trade single key levels, while experienced traders can broaden their strategies and trade supply and demand zones as well.
❤️Please, support my work with like, thank you!❤️
I am part of Trade Nation's Influencer program and receive a monthly fee for using their TradingView charts in my analysis.

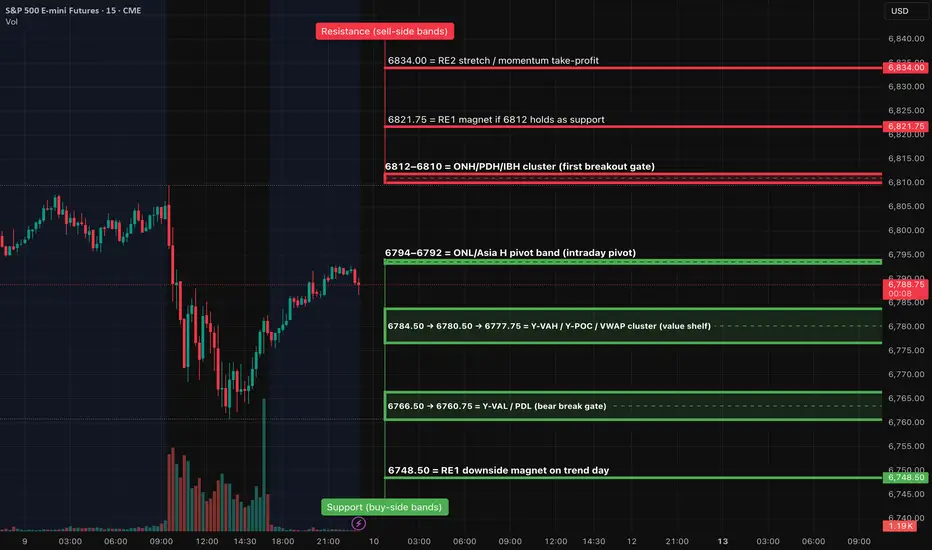
ES (SPX, SPY) Analyses, Key Zones, Setups Fri (Oct 10)Session Roadmap (London → NY)
London (02:00–05:00 ET): Expect balance 6792–6807. A sustained London hold above 6802–6805 increases odds of a pre-NY probe into 6809–6812. A London slip below 6784.5 shifts risk to a VWAP check 6777–6780 and potentially 6766–6761 into NY AM.
NY AM (09:30–11:00): Two-way opening likely unless 6812 converts rapidly; watch 9:45–10:05 for the sentiment print impulse.
NY PM (13:30–16:00): If morning sets a trend, expect continuation toward RE1/RE2; otherwise back-to-value rotations inside 6780–6795.
TIER-1 (A++) — Breakout LONG above PDH/ONH
Trigger: 15m full-body close above 6810–6812, then a 5m hold/re-close with HLs.
Entry: 6810.75–6812.25 on the first clean retest/hold.
Invalidation (hard SL): 6804.75 (below retest & today’s open region).
TPs: TP1 6821.75 (RE1), TP2 6834.00, TP3 6841.25.
TIER-1 (A++) — Breakdown SHORT through Y-VAL/PDL
Trigger: 15m full-body close below 6766.5 and then 6760.75, with a 5m retest 6764–6766 that fails.
Entry: 6764.00–6766.00 on the rejection.
Invalidation (hard SL): 6772.50 (back above value shelf).
TPs: TP1 6748.50, TP2 6736.50, TP3 6729.00.
TIER-2 (A+ Bounce) — Quick-reclaim LONG at Value Shelf
Trigger: Fast flush into 6777–6780 with a 1m reclaim of 6780.5 and 5m re-close above.
Entry: 6778.00–6780.50 after the reclaim.
SL: 6771.25.
TPs: TP1 6792.75 (Asia H pivot), TP2 6805.50 (today’s open/nearby shelf), runner eye 6810–6812 if momentum.
TIER-3 (A Bounce) — Exhaustion-flush LONG at PDL
Trigger: Liquidity sweep 6758–6752 that reclaims 6761 on 1m and 5m holds.
Entry: 6754–6756 on the reclaim.
SL: 6750.75.
TPs: TP1 6777.75 (VWAP), TP2 6789–6792 (pivot band).
===
Price-Path Scenarios (most to least likely)
Balance → Break Probe: Early churn inside 6792–6807; successful lift through 6810–6812 post-10:00 unlocks 6821.75 (RE1).
Fade to Value: Early rejection at 6809–6812 leads to a drift back into 6784/80 → 6777.75; buyers defend value and keep the range intact.
Bear Extension (data-shock needed): Clean 15m close below 6766.5/6760.75 opens 6748.50 with potential follow-through to 6736.50.
Learn the Significance of Psychological Levels and Round Numbers
When traders analyze the key levels, quite often then neglect the psychological levels in trading.
In this article, we will discuss what are the psychological levels and how to identify them.
What is Psychological Level?
Let's start with the definition.
Psychological level is a price level on a chart that has a strong significance for the market participants due to the round numbers.
By the round numbers, I imply the whole numbers that are multiples of 5, 10, 100, etc.
These levels act as strong supports and resistances and the points of interest of the market participants.
Take a look at 2 important psychological levels on EURGBP: 0.95 and 0.82. As the market approached these levels, we saw a strong reaction of the price to them.
Why Psychological Levels Work?
And here is why the psychological levels work:
Research in behavioral finance has shown that individuals exhibit a tendency to anchor their judgments and decisions to round numbers.
Such a decision-making can be attributed to the cognitive biases.
Quite typically, these levels act as reference points for the market participants for setting entry, exit points and placing stop-loss orders.
Bad Psychological Levels?
However, one should remember that not all price levels based on round numbers are significant.
When one is looking for an important psychological level, he should take into consideration the historical price action.
Here are the round number based levels that I identified on AUDUSD on a weekly time frame.
After all such levels are underlined, check the historical price action and make sure that the market reacted to that at least one time in the recent past.
With the circles, I highlighted the recent reaction to the underlined levels. Such ones we will keep on the chart, while others should be removed.
Here are the psychological levels and proved their significance with a recent historical price action.
From these levels, we will look for trading opportunities.
Market Reaction to Psychological Levels
Please, note that psychological levels may trigger various reactions of the market participants.
For instance, a price approaching a round number may trigger feelings of greed, leading to increased selling pressure as traders seek to lock in profits.
Alternatively, a breakout above/below a psychological level can trigger buying/selling activity as traders anticipate further price momentum.
For that reason, it is very important to monitor the price action around such levels and look for confirmations.
Learn to identify psychological levels. They are very powerful and for you, they can become a source of tremendous profits.
❤️Please, support my work with like, thank you!❤️
I am part of Trade Nation's Influencer program and receive a monthly fee for using their TradingView charts in my analysis.
5 Elements of the Best Key Level in Forex, Gold Trading
What are the best key levels to trade?
This year I analyzed more than 1500 key structures on Forex, Gold, Crypto and Indexes.
In the today's article, I prepared for you a list of 5 elements of a perfect support and resistance for trading.
As always, remember that the best key levels are always on a daily time frame . So all the structures that we will discuss will be strictly on a daily .
Also, all the structures that I analyzed and traded are available on my TradingView page, so you can back test them by your own.
1. Clear historical significance
The structure that you spotted should act as a significant historical support or resistance.
Here are the important historical support and resistance that I spotted on USDCAD on a daily time frame.
2. Psychological significance
The structure that you identified should match with round numbers.
All the structures that we spotted on USDCAD match with psychological numbers.
3. Confluence with other technical tools
The best structure should align with other trading tools such as trend lines or Fibonacci levels , strengthening its significance.
After adding fibonacci levels and a significant falling trend line on the chart, the confluence was found in Resistance 6, Resistance 3, Resistance 2, Resistance 1, Support 2. Other structure does not match with technical tolls.
4. Volume
The level experiences high trading volumes, indicating strong participation and interest from market participants, especially smart money.
All the structures that we underlined show significant volume spikes. By volume spike, I mean a volume being higher than the average volume - a blue curve on volume.
5. Multiple touches
The more, the better. There are numerous instances where price has respected and reacted to the structure, confirming its strength (at least 2).
Only these 3 structures were confirmed by the multiple touches. These resistances will be considered the strongest ones.
That checklist will help you to identify the most significant structures from where you will be able to catch impulsive movement and make nice profits.
❤️Please, support my work with like, thank you!❤️
I am part of Trade Nation's Influencer program and receive a monthly fee for using their TradingView charts in my analysis.
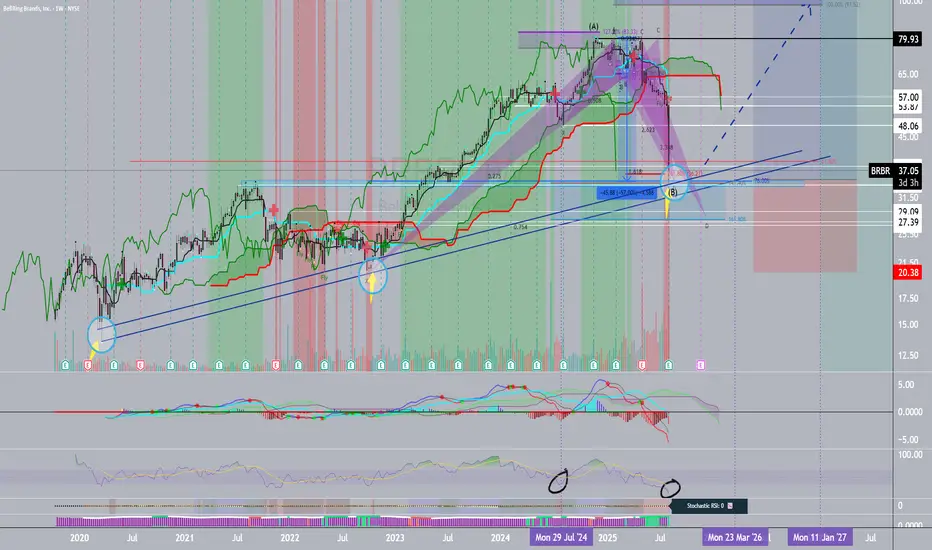
Bellring Brands Bounce from Huge Key Levels & Motived ManagementFundamentals:
In today's earning's call (August 5, 2025, the management was excited about the future outlook of the company. Their expected negativity from the start. The questions by the banks (JP Morgan and Morgan Stanley and others) were answered thoroughly and professionally...and positively.
Technicals:
I discuss the quick fundamentals and technicals of this stock in this video here:
Monthly:
hidden bullish divergence
2021 horizontal key level of support
Weekly:
diagonal and horizontal level of support
with indicators:
30-Minute Chart:
HAMMER TIME!
Morning Star!
Volume confirmation!
GBP/USD: Following the Bearish Trend to a Key LevelSharing my perspective on a potential short setup in GBP/USD.
This view is based on a combination of weakening UK fundamentals and a clear bearish technical structure.
📰 The Fundamental View
The main driver here is the growing difference in monetary policy. The Bank of England is signaling a more dovish stance due to recent soft economic data out of the UK. In contrast, the US economy is showing more resilience, which may keep the Federal Reserve on a less aggressive easing path. This fundamental divergence puts downward pressure on the Pound versus the Dollar.
📊 The Technical Picture
The chart supports this bearish bias. We can see a clear downtrend in place, defined by a series of lower highs and lower lows. Price is currently trading below its key moving averages, which often act as dynamic resistance. The critical level to watch is the 1.34377 price zone, which was a previous area of support and could now be tested as resistance.
🎯 The Strategy
The plan is to watch for bearish price action as we approach the 1.34377 key level. A rejection from this zone would provide a good opportunity to enter a short position, aiming to ride the next leg of the established downtrend.
As always, this is my own perspective. Manage your risk carefully and trade safe.

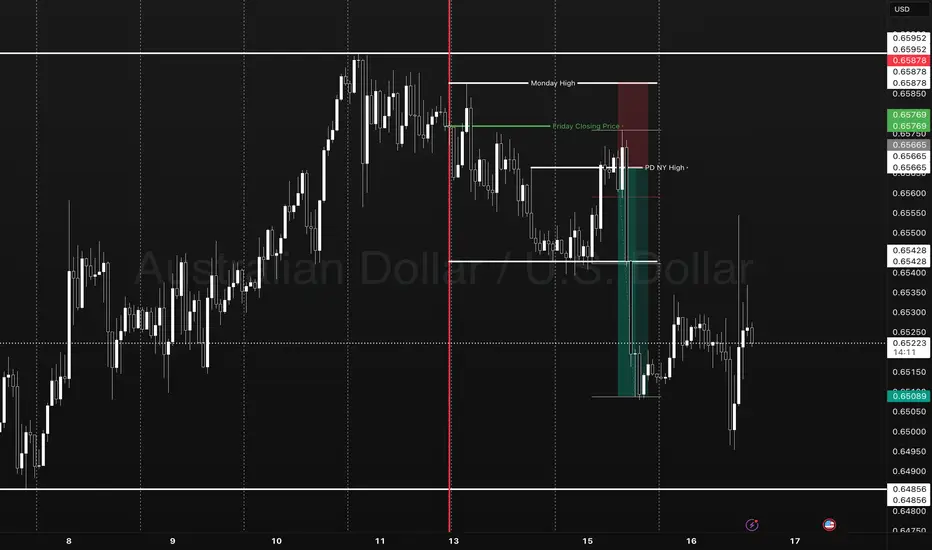
The only key levels you need - DITCH THE INDICATORS- Previous day high/Low
- Weekly high/low
- Session high/low
- Closing Price
In this specific example on OANDA:AUDUSD we have a day 3 Tuesday breakout fail reversal setup on the backside of a previous weeks expansion.
Fridays closing price was plotted going into Monday day 2 on the backside of a new week. Once the initial high low was set on day 2 below the previous weeks high and closing price we than look for short opportunities going into day 3 Tuesday.
In this case day 2 Ny session high acted as the reversal point staying below Friday closing price below the high of the previous week. The Asia/London session printed a beautiful high/low range reversing at near the midpoint of the previous days range (50% retrace.)
A great opportunity for a projected range expansion presented with confluence at a previous days low giving a solid set and forget trade with little to no stress or heat. This parabolic opportunity took place in the NY session below Fridays closing price to a previous weeks LOD level.
- Mondays High (Stop)
- NY session High, Fridays Close (Entry)
- Wed Low, Range expansion (Target)
KEY NOTES:
It is very important to keep your trading simple. As a newer trader I filled my chart with as many indicators as possible trying to find a "signal" because I lacked the patience for the market to give me a setup over multiple days. Now as a more experienced trader I sit back on higher time frames (1H/15M) TO WAIT FOR THE DAILY LEVELS TO PRINT. Avoiding trading inside a range on a low time frame. Lower time frames are only to decrease risk and increase position accuracy already derived from higher time frames. It is key to understand when higher time frame traders are triggered into a market and to understand there are only two main plays from key levels. Keep it simple, find the scalable setups, AND PUT THE SIZE ON WITH CONFIDENCE.
NQ KEY LEVELS - 2nd MAY 2025Key levels marked by using low volume nodes for potential key levels where we may see price react.

NQ KEY LEVELS - 29th APRIL 2025Key levels marked by using low volume nodes for potential key levels where we may see price react.

NQ KEY LEVELS - 28th APRIL 2025Key levels marked by using low volume nodes for potential key levels where we may see price react.

USDJPY Outlook – Bearish Continuation or Bullish Reversal??In this analysis, I'm breaking down the USDJPY structure starting from the 4H to identify the overall market direction (Bearish/Sells), then zooming into the 1H to fine-tune potential trade setups.
On the 4H timeframe, we’re assessing whether the recent bearish momentum is likely to continue or if price action is showing early signs of a bullish reversal. The LOW created at 141.800 level is our first target IF we continue to sell as its creating that LowerLow.
IF price closes bullish above 142.500, I will switch sides and look for potential buys.
On the 1H timeframe, I’m watching for a bullish liquidity sweep below141.888, followed by a clear break of structure to the upside on the 15m or 1H for more confirmation. That would indicate smart money accumulation and a potential shift in market sentiment—giving me confirmation to start looking for long setups.
🚀 Give me a boost and follow for upcoming $niper entries this week! 🦇🔥
CMCMARKETS:USDJPY
