LTC good for shortHi guys!
I think LTC looks good for short. Take short in supply zone.
Stop - 82.50
Take profit in buy zone in chart or earlier. Will look for situation.
Trade in profit.
Kraken

LTC Where to buy?Hi everyone!)
Previous idea have worked out exactly like others) Congratulations for everyone who used the idea and took profit.
Now I will waiting to buy LTC in next demand zone you can see on chart. I advice you to buy it a little higher than demand zone....63.50 or 64.
Wish you profitable trading!


My resistance levels if Ripple continues its breakoutThere is no bullish pattern confirmation, nor supper bullish volume movement...
But, there is a rapid moving RSI, increasing positive volume and an big breakout in its bearish triangle to the upside.
You can see how I confirmed that by my previous idea:
However there can be more volume. I don't think it will get loads of attention now immediately, but it will come.
In my eyes it is very healthy to have a correction towards 0.252 but anything much below that with a weekly close will call a fakeout imo.
Also on daily chart the 50EMA is very close to crossing the 200EMA...
My updates such as entries and targets come on my other idea as mentioned.

Slangin Shi.. I mean Altcoins Long ICXETHICXETH on the 6H may be preparing for a move up. Nice double bottom support, holding above the 50 simple while dipping into the bottom Donchian Channel. Stoch has a fresh bullish flip with plenty of room to run. I have a limit order in place and will let it come down to meet me at my price. If I miss it, I miss it. Scale out 50% at 2atr to lock in some profit and then trail the running half with a stop of 2atr.

BT/EUR Possible Trajectory For New All Time HighI was just playing around.
I suppose it will not happen this way, but if we do follow this trajectory and never break the 10 SMA on the 3D time frame we should hit the new all time high price of BTC by June.

Kraken DASHUSD chart eyeing goldencross by tomorrow! Target=$220Haven't checked dashusd on other exchanges yet for confluence but on the Kraken exchange it looks ready to blow! *not financial advice* . We see here a symmetrical triangle in an uptrend attached to a flag pole= bullish pennant. If it reaches the pennants breakout target we are looking at a target of around 200-220, if it only reaches the triangles target it will be considerably lower but with the inevitable impending golden cross I anticipate it will reach the full breakout target.

(I'm a newbie) Analysis of LTC EUR - Kraken - Renko - DailyJust learning and sharing so I can get some constructive feedback on what I am seeing and what I am not seeing in my chart analysis. If you think I am insane, that's cool. Just be sure to tell me why so I can learn :)
I am doing my best to keep things simple and follow solid trends and retracements keeping trading/market psychology in mind.
I made this analysis using Renko bars to get stronger trends on average price action. I used the green time span circles to get an idea of how the price action moves the market along and better understand where I might be able to find buy-in and take profit points. On the main chart, I pulled the time cycle from the beginning of the first large wave to the centre of the peak to get my estimated time frame for when I can expect the peak of the following wave.
In the RSI, I pulled a fib retracement from the all time high in the RSI around the beginning of 2018. This showed me that all subsequent peaks in the RSI "uptraces" to the .5 on the fib. On the most recent wave in the RSI, I pulled a fib from the peak to the newly formed low - this showed me a that all previous peaks lined up with the .618. Using the time cycles tool, I identified that the predicted peak I created on the chart lined up exactly with the predicted peak on the RSI.


BAT in Symmetrical triangle, Could reach new ATH!BAT is currently trading in a symmetrical triangle on Kraken which is very clear on 4H chart.
BAT recently followed other coins with an uptrend and BAT has alot of positive volume compared to negative volume.
13EMA is also very well tested. This is nice opportunity to trade with buying on support in the triangle.
If it breaks it's previous all time highs which is around €0,25 it could very well reach much higher.
Previous high was tested around 3 times but very weak.
What also is very clear to see it that it could be a double bottom pattern as seen on 1D and 1W chart.
Since it opened very recently before the first bottom it isn't a very secure and reliable pattern.


Can QTUM break this resistance?It tested it's support very well recently. 200EMA is only coming down more and putting pressure.
Also ALOT of pressure of the upper resistance of its downward channel...
It'll break but slowly, the only think QTUM now needs is positive volume.

Imminent Drop Ahead? Bitcoin Showing Bearish Signals |Short-termLooking at Bitcoin (XBTUSD) short-term (1H) we can see that prices are now trading below EMA10 and EMA50 while the two indicators have a bearish cross.
The MACD and RSI are trending down and volume is really weak after multiple lower highs.
If XBTUSD fails to move back above $8093, prices are very likely to drop.
What's your take?
Feel free to share with us in the comments section.
Thanks for reading.
Namaste.

Short REP/XBTGot both of my confirmations to enter a short position on Augur/Bitcoin.
Entered short at .001181
SL at 1X ATR from the swing high .001227
1st TP at 2x ATR .001139
I will buy 50% back to close, move SL to break even and let the other half run with a trailing stop of 1x ATR.

DASH still mainly bearish + Key resistance targetsI noticed that DASH recently broke through one of its main resistance trendlines (diagonal one) and retested it kinda but not strongly yet.
Also if you can see volume is increasing and it's mostly the upward movements that are made by lots of volume (seen on lower timeframes).
Still however the volume is currently in bearish triangle pattern and will need to be pushed through.
Keypoints of this analysis
There hasn't been this much volume in 1D since 1 of april '19.
ATL on Kraken was recently hit. (34EURO)
314EURO is the biggest resistance target to watch out for
Volume is still in downtrend
There's also alot of longterm resistance between 62-79EURO
Weekly timeframe also shows DASH is quit underbought, also the convergence line on the MACD indicator crossed the divergence line with a bit of velocity and shows since first in longtime positive movement. (not on chart)
It's too early to say that the bulls are coming back but if they do so, they will have a very hard time breaking through...

Cardano on it's way to break through big resistance! Bullish!Cardano is currently at a level which has relatively large resistance.
I think the bulls are going to take over soon. If this happens the uptrend could be huge.
Very cryptos are showing similar moves in similar patterns currently.
If you look at CHAINLINK, it has the same pattern and broke trough.
Also DASH and LITECOIN already broke trough such similar pattern.
This is GREAT to put a stoploss above the current channel.


Golden cross about to form in BTCUSD Regardless of the so many positive news happening in the market we can see so many negative sentiment in crypto twitter. In about one hour we are going to see a golden cross in the weekly chart of BTCUSD KRAKEN:XBTUSD

Kraken Lists LSK at 14:30 UTCIf LSK's history rhymes with NANO's Kraken listing then we should expect a 10-15% pump and dump. Expect price to drop just as quickly once arbitragers get their bags filled and Kraken's price reaches equilibrium with other exchanges. Happy Trading...
Please hit the like button if you'd like to see my sell targets.
This is not financial advise. Trade at your own risk and peril.


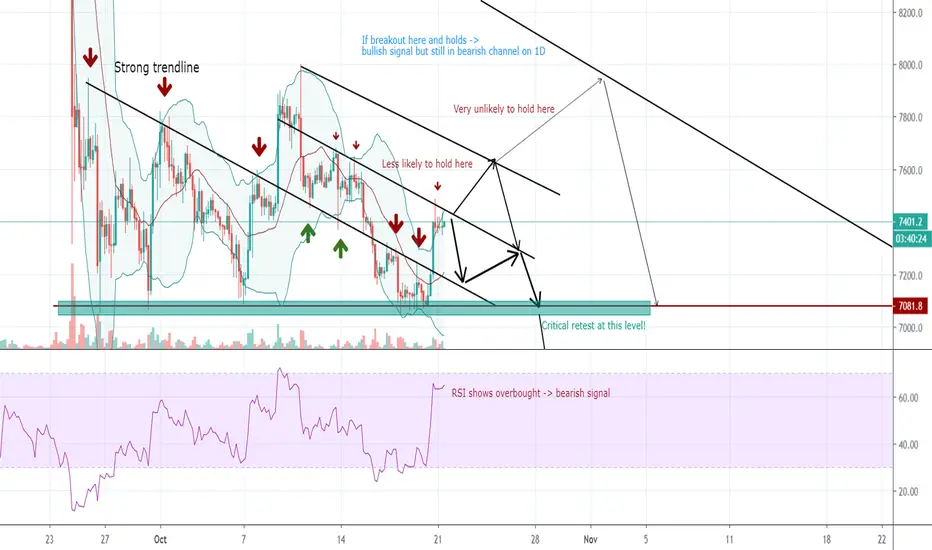
Bitcoin to stay above 7000 EUR till 28-30 octBitcoin is currently hanging around a resistance trendline.
I think it will struggle to hold above it.
If it breaks the resistance it will get stopped at around 7660EUR.
If it breaks the 7660EUR target it is not yet in a new bullish run.
As seen on the 1D chart and 3D chart there's a much stronger resistance trendline waiting to get tested.
There's a nice opportunity to go short at 7960EUR.
If it breaks the 7960EUR and holds it with nice volume it could sign into a new bullrun.
What is more likely is that 7050EUR gets tested and may have one jump from it.
Volume is slowly lowering and the bulls are slowly dissapearing.
probability to 7050EUR around 70%
probability to test 7650EUR around 30%
probability to test 7960EUR around 15%
BTCUSD Bitcoin - Double coil breakout - Long Target 9337 USD Candles : Daily
Wedge Duration : 23 Days
Double coil/pennant breakout shown on BTC (XBT Kraken) Looking for price target of around 9337 resistance level.
Within the month.
LONG live Bitcoin!

$XBT short @8585.9usd. closing@8192 before the breakout to 8500self explanatory in title. dm me for question @Insider_Young
