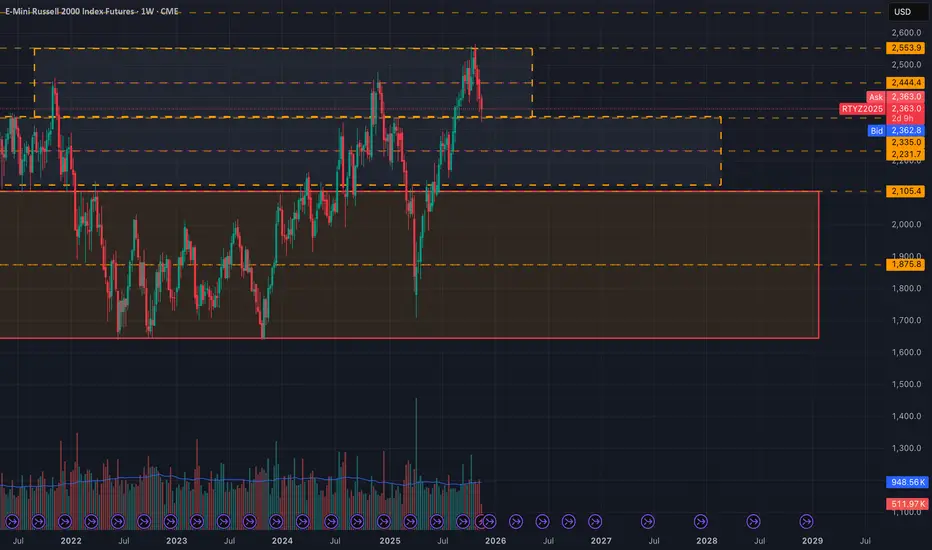
RTY Box LevelsI've taken some time to chart the Russell 200, and I have to say the box is looking quite excellent.
Nice and clean levels, makes a fella wanna put a bid in.
I am not used to trading this name(literally traded it the first time on Monday), but it seems like a good time so far.
I'll be on the look out for LBAFs and LAAFs, no directional bias just trading what is seen atm.
If a look below and fail occurs and is sustained at the upper box, then it is objectively a long (especially if we trade lower first w/a failure to go lower), otherwise if we trade through the level w/ continuation or trade higher first and fail, then a LAAF would take us within the middle box's range.
Trading higher first and failing is more bearish than trading lower first.
Trading lower first and failing to go lower is more bullish than trading higher first.
I like to keep these concepts in mind as I wait for the opening and initial balance ranges to form intraday, and from there, I can form an opinion and initiate a trade.
Laaf
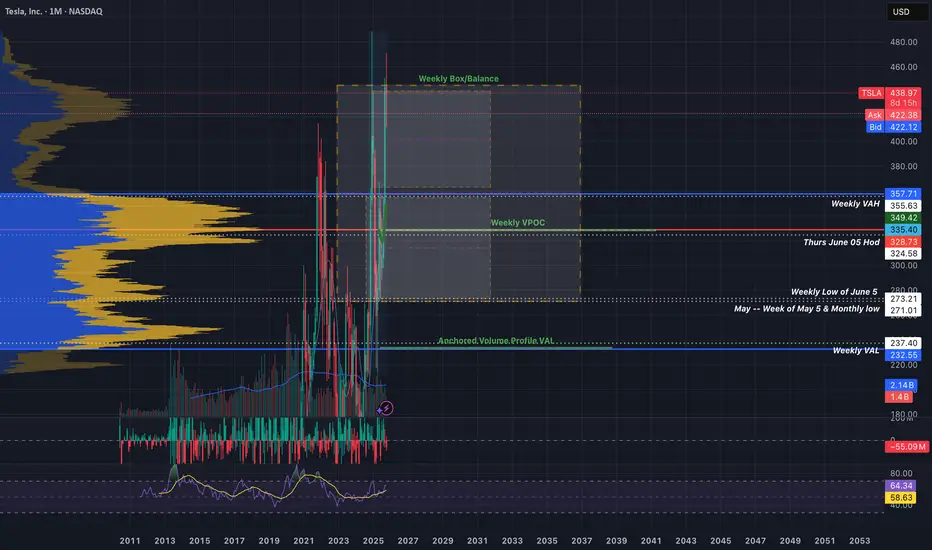
Tesla Macro ChartSharing my Macro Chart.
Use this as a reference for the levels of interest mentioned in my previous tesla post. Added a 30 minute box within the weekly balance box.
I like to personally use this chart to monitor levels intraday on the 30 minute or to plan major shorts or buys.
Some of these levels were drawn a year ago probably but I hope you'll find them useful.
~The Villain

Tsla - Box is Box?I have what seems like a thousand tesla charts now...and they are all telling me tesla needs to have a seat soon.
Tesla has been consolidating on the daily timeframe for quite a while now.
What happens if we continue to see presistent failures at the top of box or a look above and fail on the weekly? I'd put my money on a return to value.
At some point, tesla should revert back to the mean and I will be there waiting to LEAP at the opportunity(get it?).
I would love tesla around the weekly volume point of control around $245 area (this may shift as the days go by). If tesla retests the weekly value area high around $314 and is rejected then we may take a trip down to VPOC town.
Granted, for any of this to happen, we would need technicals to cooperate, meaning a LAAF of box and failure to hold the midpoint($384ish), as well as a turn in sentiment.
This could happen this fall or next march, who knows, but I'll be there when it does.
~The Villain
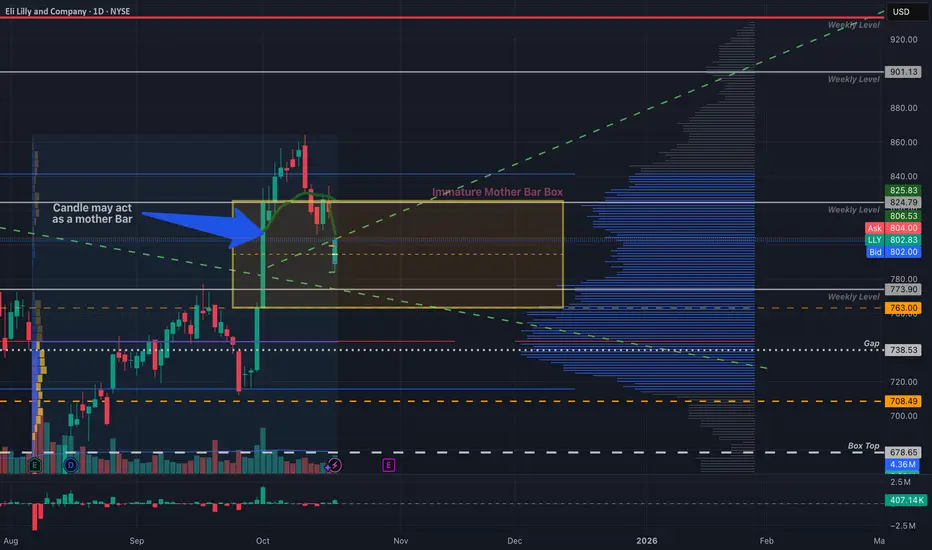
LLY - Beware the MotherbarTaking a closer look at the Eli Lilly chart and noticed that there is a box setup forming on the daily time frame. Specifically this box is the product of a mother bar.
If you take a look the last 4 daily candles have more or less traded within the body of the XXL green candle on the left.
I would be mindful of this mother bar/box in the coming week. Don't get too bulllish at the top or two bearish at the bottom.
I suggest also taking a look at SPY's chart as there is a similar pattern forming, albeit a much more defined motherbar.
A look above and fail of $824 could make a great short, or a look below and fail of $763(A+) or $773(B+) is a great long.
The trendline also sits near that low so if the LBAF plays out that is another supporting confluence for this trade.
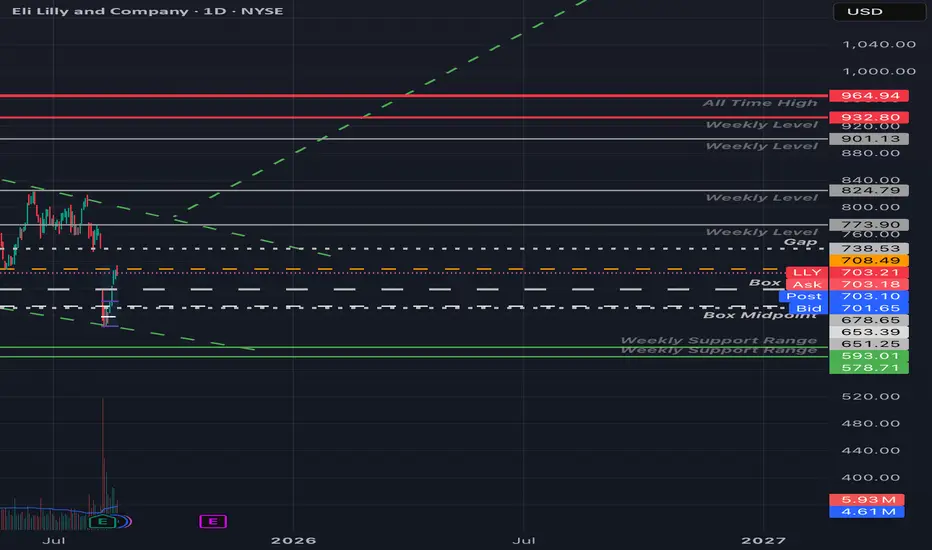
LLY - Clean Levels UpdatedEli Lilly's hit those 708.49 and 711 levels I mentioned in my previous LLY post.
I've added some weekly levels, and a couple relevant spots from my boxed LLY chart.
If LLY loses steam up here we could easily see a retest of that box top area in the $680 - $678 range. Otherwise if we see a market wide reversion from today's liquidation, and LLY clears today's high(~714) and firmly holds that high volume area, that gap($738) fill would be a no-brainer.
Personally leaning on the side of a short continuation(in the near time at least), didn't really trust the low volume float up over the last few trading days, and definitely don't like the decreasing volume into that $711 - $714 area (I'd consider it a Look above and fail).
Regardless of bias, we trade what we see.
~ The Villain.