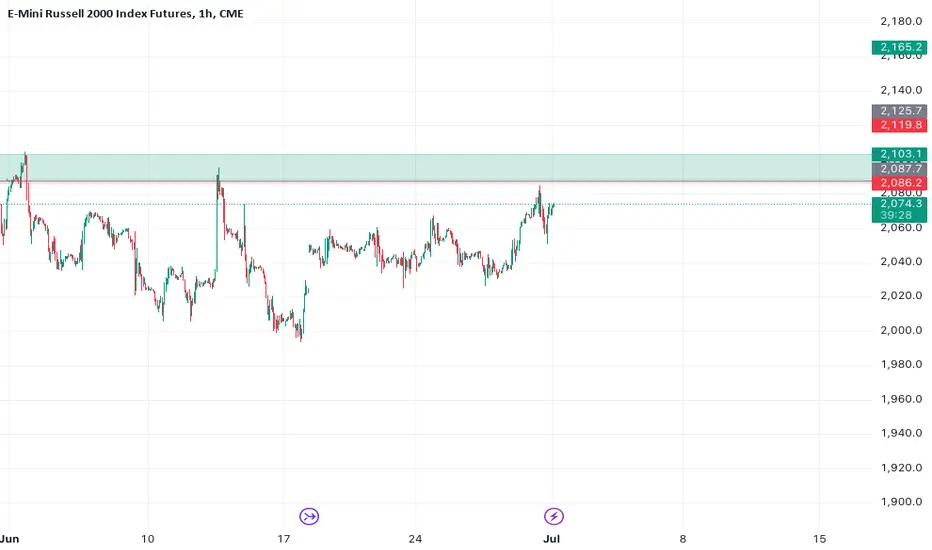
E-Mini Russell 2000 Index Futures
No trades
No trades
Compare with Russell 2000
Momentum Shift with Nova Flow FreeNova Flow Free uses a clean color‑based momentum logic to highlight early trend rotations and structure shifts.
This is the basic version of the tool, designed for clarity and non‑intrusive analysis.
For traders who need more precision, filtering and multi‑mode logic, advanced versions (Core & Snip
RTY: Decision Point Approaches at 2860RTY continues to rotate lower from resistance near 2940 while holding above key support at 2860.
The current pivot zone around 2890 remains the immediate battleground. A break below 2860 would expose the next objective near 2820, while a successful defence of support could allow buyers to reclaim t
RTY1! · Russell 2000 FuturesFalse break below the 4H low — CRT long trigger
Price swept the 4-hour session low before the open, engineering a liquidity grab on resting sell stops. The move activated a bullish CRT (Candle Range Theory) setup: entry on reclaim, stop protected beneath the prior 4H structural low.
RTY: Daily_ Up Channel_+1,156 Ticks from Fibonacci TargetRTY Daily time frame is in an up channel. The
market is near the top blue level. A short term
pull back is expected but long term will expecting
the market to push bullish towards the daily up
Fibonacci extension price point 3026.4 about
+1,156 ticks above
Russell | Pullback Into Demand Within Higher Timeframe Uptrend Russell has pulled back into a key demand area following a strong impulsive advance. The broader trend remains constructive while price holds above the 2860 failure level.
Key Levels:
• Major Demand: 2890-2900
• Failure Level: 2860
• Reclaim Zone: 2925-2945
• Upside Objective: 3000
As long as dem
Russell 2000 Surges to Record High, Launches Fresh Bull CycleRussell 2000 Futures (RTY) has broken to a new all‑time high, initiating a fresh bullish cycle. The rally from the March 30, 2026 low concluded with wave (1) at 2918.4. Afterward, the Index corrected in wave (2), which ended at 2728.3, as shown in the one‑hour chart. The internal subdivision of wave
RTY Daily_Close to bullish Fibonacci target_+194 Ticks to goThe RTY one hour time frame is in an up trend.
The market is making higher highs and higher
lows. The market has an up Fibonacci with an
extension price point 2941.3 about +194 Ticks
above the market. As long as the market does not
take out the one boundary price point 2591.8. It
is expected the
RTY Short — RTY breaking down through key 2832 support — weakestSetup: On the 4h, RTY peaked near 2916 on May 6 and has been printing a series of lower highs — 2896, 2887, 2874 — while the May 12 gap-down session confirmed distribution with ~35k volume bars. The 1h shows price failing at the 2860-2870 supply shelf repeatedly over May 13-14 before rolling over ha
See all ideas
Summarizing what the indicators are suggesting.
Neutral
SellBuy
Strong sellStrong buy
Strong sellSellNeutralBuyStrong buy
Neutral
SellBuy
Strong sellStrong buy
Strong sellSellNeutralBuyStrong buy
Neutral
SellBuy
Strong sellStrong buy
Strong sellSellNeutralBuyStrong buy
A representation of what an asset is worth today and what the market thinks it will be worth in the future.
Displays a symbol's price movements over previous years to identify recurring trends.
Frequently asked questions
The current price of E-Mini Russell 2000 Index Futures is 2,994.0 USD — it has fallen −0.48% in the past 24 hours. Watch E-Mini Russell 2000 Index Futures price in more detail on the chart.
The volume of E-Mini Russell 2000 Index Futures is 121.74 K. Track more important stats on the E-Mini Russell 2000 Index Futures chart.
Open interest is the number of contracts held by traders in active positions — they're not closed or expired. For E-Mini Russell 2000 Index Futures this number is 397.45 K. You can use it to track a prevailing market trend and adjust your own strategy: declining open interest for E-Mini Russell 2000 Index Futures shows that traders are closing their positions, which means a weakening trend.
Buying or selling futures contracts depends on many factors: season, underlying commodity, your own trading strategy. So mostly it's up to you, but if you look for some certain calculations to take into account, you can study technical analysis for E-Mini Russell 2000 Index Futures. Today its technical rating is buy, but remember that market conditions change all the time, so it's always crucial to do your own research. See more of E-Mini Russell 2000 Index Futures technicals for a more comprehensive analysis.