Types of Orders In Trading | Trading Basics 🤝💱
Hey traders,
In this post, we will discuss types of orders that we use in Forex trading.
➖ Market order.
Trading position is opened at a current price level.
Buying the asset, you will open a trading position at a current ask price.
Selling the asset, you will open a trading position at a current bid price.
Even though market order is the most preferable type of orders among newbie traders, I highly recommend not to use that, especially if you are a day trader.
❗️The main problem is that prices constantly fluctuate and there is a certain delay between order execution and position opening. For these reasons, the position will be opened from a random price level within the range where the market is currently staying, affecting a risk to reward ratio.
➖ Limit order.
Trading position will be opened only from a desired price level.
With buy limit, you will buy the asset from a certain level.
(current price remains above the order)
With buy stop order, you will buy the asset from a certain level.
(current price remains below the order)
With sell limit, you will sell the asset from a certain level.
(current price remains below the order)
With sell stop, you will sell the asset from a certain level.
(current price remains above the order)
That is the order type that I prefer. Limit order helps you to trade from a desirable level, automatically executing the order once it is reached, letting you preliminary set it.
❗️However, remember that there is one big disadvantage of that order type: there is no guarantee that the price will reach the desired price level to activate a trading position. For that reason, occasionally you will miss the trades.
Try these order types on a demo account to learn how they work in practice.
Which order type do you prefer?
❤️If you have any questions, please, ask me in the comment section.
Please, support my work with like, thank you!❤️
Learntotrade

Long EURGBP 100 PIPS INCOMING! Nice long move do not even think about selling! First take profit 0.8570! Check my previous idea below for the big MOVE 350 PIPS! CALLED THIS LONG MOVE ON THE 7TH JULY!
Like share follow if you want nice clean ideas!

What is Forex and How Big It Is?💱
Forex - foreign exchange market, is a location where international currencies are bought and sold by economic participants at various exchange rates.
Forex market is the biggest market in the world, reaching on average 6 trillion dollars trading volumes daily.
Forex market is a vital element for a global economy because it provides capital exchanges between the countries.
The main market participants of forex market are central banks, commercial banks, commercial companies, hedge funds and investors.
🕰In order to grasp how big is that market, take a look what is happening on that just in 60 seconds:
📎Total transactions value reaches 3.52 billion US dollars.
📎 1.15 billion dollars of spot transactions.
📎 1.65 billion dollar of exchange swaps.
📎 Total transactions value involving USD reaches 3 billion US dollars.
📎 Total transactions value involving EURO reaches 1.1 billion US dollars.
📎 Just one single EUR/USD pair accumulates 812 million US dollars transactions value.
It is hard to imagine how such big amounts are rolling with such a frequency and how insignificant are the orders of individual traders.
❤️If you have any questions, please, ask me in the comment section.
Please, support my work with like, thank you!❤️

LONG EURGBP BUY! HUGE MOVE 350 pips!Do not sell!
HUGE LONG MOVE COMING UP ENTER AROUND 0.8407 long all the way to 0.8740
No nonsense approach simple clean price action trading all info in idea apart from the strategy (use your own SL according to your OWN RISK MANAGEMENT)
Not financial advice my own analysis for personal use ONLY!
FOOLOW SHARE LIKE FOR MORE CLEAN IDEAS
82FX

Are You Ready to Trade Full Time? 4 Essential Signs ⭐
Hey traders,
Once you mature in trading and become a consistently profitable trader, the question arises: are you ready to trade full time?
Becoming a full time trade is a very significant step and my things must be taken into consideration before you make it.
✨Becoming a full time trader implies that you quit your current job, that you give up a stable income - your salary.
In contrast to classic job, trading does not give guarantees. Please, realize that such a thing as stable income does not exist in trading.
Trading is a series of winning and losing trades, positive and negative periods. For that reasons, remember that in order to become a full time trader, your average monthly trading income must be at least twice as your monthly expenses.
✨Moreover, even if your trading income is sufficient to cover two months of your life, that is still not enough. You must have savings.
Trading for more than 8 years, I faced with quite prolonged negative periods. One time I was below zero for the entire quarter.
For that reason, supporting a family and living a decent life will require savings that will help you not to sink during the losing periods.
✨Another very important sign is your correct and objective view on your trading. Please, realize that if you bought Bitcoin one time and made a couple of thousands of dollars, it does not make you a consistently profitable trader. Please, do not confuse luck with the skill. Your trading must be proven by many years of trading.
✨You must be emotionally prepared for the living conditions that full time trading will bring you.
Being a full time trader implies that you are constantly at home,
you work from home from Monday to Friday.
You do not see your colleagues, your social life will change dramatically.
I know a lot of people who started to trade full time and then realized that they can not work from home for different reasons.
⭐So what are the necessary conditions for becoming a full time traders:
you should have savings that will cover the negative trading periods,
your average monthly trading income should be at least twice as your monthly expenses,
your trading efficiency must be proven by objective, consistent results,
and you must be psychologically prepared for working from home.
When these conditions are met, you can make a significant step and become a full-time trader.
Are you ready to become a full time trader?
❤️If you have any questions, please, ask me in the comment section.
Please, support my work with like, thank you!❤️

3 Types of Charts You Must Know 📈
Hey traders,
In this post, we will discuss 3 most popular types of charts.
We will discuss the advantages and disadvantages of each one, and you will decide what type is the most appropriate for you.
📈Line Chart.
Line chart is the most common chart applied by analysts. Reading financial articles in different news outlets, I noticed that most of the time the authors apply line chart for the data representation.
On a price chart, the only parameter that the one can set is a time period.
Time period will define a time of a security closing price. The security closing prices overtime will serve as data points.
These points will be connected with a continuous line.
Line charts are applied for displaying an asset's price history, reducing the noise from less volatile times.
Being simplistic, they can provide a general picture and market sentiment. However, they are considered to be insufficient for pattern recognition and in depth analysis.
📏Range Bar Chart.
In contrast to a line chart, a range bar chart does not consider time horizon. The only parameter that the one can set is a price range.
By the range, I mean a price interval where the price moves. A new bar will be formed only once the prices passes the desired range.
Such a chart allows to completely ignore time variable focusing only on price movement and hence reducing the market noise.
The chart will plot new bars only when the market is volatile, and it will stagnate while the market is weak and consolidating.
Accurately setting a desired price range, one can get multiple insights analyzing a range bar chart.
🕯Candlestick Chart.
The most popular chart among technicians and my personal favorite.
With just one single parameter - time period, the chart plots candlesticks.
Each candlestick is formed as a desired time period passes.
It contains an information about the opening price level, closing price, high and low of a selected time period.
Candlestick chart is applied for pattern recognition and in-depth analysis. Its study unveils the behavior of the market participants and their actions at a desired time period.
Of course, each chart has its own pluses and minuses. Choosing its type, you should know exactly what information do you want to derive from the chart.
What chart type do you prefer?
❤️If you have any questions, please, ask me in the comment section.
Please, support my work with like, thank you!❤️

CUP & HANDLE. How the pattern works☕️
✅This pattern is not as popular among traders as "Head and Shoulders", "Double Top" and other classic patterns of technical analysis. However, this does not mean that it is not so effective. In fact, the "Cup & Handle" pattern is in no way inferior to the above patterns in its reliability and, if used correctly, can bring considerable benefits to the trader.
✅Below we will look at how the "Cup & handle" is formed, what are the signs of authenticity of the formed pattern, and the trading strategy for it.
⚠️How the "Cup & Handle" formation is formed
The formation of this pattern occurs on an uptrend and is a sure sign of its continuation (subject to the conditions of authenticity of the pattern). In essence, it is a cup - an uptrend correction. The price reaches a strong resistance level, cannot overcome it, and smoothly rolls back, forming the left wall of the cup. Then it smoothly unfolds along the bottom and rises to test the level again. Having reached the level, it rolls back down again. This rollback should be much smaller than the previous one, and it forms a handle. The handle of the cup is very often formed in the form of a "Flag" pattern.
The "Cup & handle" pattern is considered fully formed when the price, having formed a "handle", returns up and breaks through the resistance level from which the pattern formation began
⚠️Confirmation of the truth of the "Cup & handle" pattern
There are several conditions, without which the formed pattern cannot be considered true. These are the conditions:
1️⃣To begin with, as mentioned above, for the formation of this pattern, it is necessary to have an uptrend. Without a trend, there is no point in looking for this formation on the price chart, because even if you find a drawing of an ideal cup with a handle, it will be just a drawing that has no meaning.
2️⃣The depth of the forming cup should not exceed 2/3 of the height of the previous uptrend. The optimal depth of the cup is within 1/3 - 2/3 of this value.
The depth of the forming handle should not exceed a value equal to ½ of the depth of the cup.
3️⃣The most reliable is the "Cup & Handle" pattern formed on daily or weekly timeframes. Of course, it can also be formed on hourly charts, but where the probability of its triggering is somewhat lower.
4️⃣The "Cup & handle" pattern should be confirmed by the indicators of the volume indicator. Volumes should grow at a time when the price is moving in the direction of an uptrend and fall when it decreases. Also, a sharp surge in volume should accompany the moment of breaking through the price level at the end of the formation of the figure.
🟢Trading strategy based on the "Cup & handle"
The entry into the position is carried out after the completion of the formation of the figure. It is recommended to wait for the price to close above the resistance line. To do this, you must constantly monitor the schedule in anticipation of the right moment.
There is also a strategy for opening a position on a pending order, in which case there is no
need to sit and wait for the completion of the figure. A pending order is placed at a level slightly above the resistance level (approximately 10 points) and is triggered if the figure is completed.
The target level for this pattern is the height of the cup, laid up from the resistance level. Therefore, we set the profit-taking level of TAKE PROFIT either at the target level or 10-15 points below it.
As for the STOP LOSS limit order, it should be placed at the level of the bottom of the handle (or slightly lower).
❗️In conclusion, I will say once again how important it is to correctly identify the "Cup and Handle" formation before you start trading on it. Carefully re-read the rules confirming this pattern. Try not to mess with the patterns formed on small timeframes. Take your time, be patient, and remember that the absence of open positions can also be considered an excellent position.
❤️ Please, support our work with like & comment! ❤️

Improve your trading skills with PTAHey Traders!
In this video we talk about Post Trade Analysis which we believe it probably the best way to develop your trading skills, trading system and general instinct of trading.
Today we traded the DAX for 2 hours with complete focus, focus is a vital requirement for trading success as it allows you to be present and disciplined to follow your trading rules and system.
The video explains some things we did good and some things we did bad, of-course the good should be repeated in the next trading session, the bad either improved or removed!
Do you do post trade analysis? - Let us know in the comment section below!
Have a fab day!

Markup of CADJPY resultsEarlier markup of CADJPY cashes. Projected last night that price to buy towards TP.

185 pip SHORT TRADE EURGBPSHORT TO 0.8400 VERY NICE 185 DROP COMING UP LET THE TRADE PLAY OUT
No nonsense approach simple clean price action trading all info in picture apart from the strategy (use your own SL according to your OWN risk management
THIS IS NOT FINANCIAL ADVICE, MY OWN ANALYSIS FOR PERSONAL USE)
FOLLOW SHARE LIKE IF YOU WANT MORE clean ideas
82FX

EURGBP SHORT TO 0.8516 VERY NICE 120 PIPSSHORT TO 0.8516 AS FIRST TP
DO NOT BUY DO GO LONG!
No nonsense approach simple clean price action trading all info in picture apart from the strategy (use your own SL according to your OWN risk management
THIS IS NOT FINANCIAL ADVICE, MY OWN ANALYSIS FOR PERSONAL USE)
FOLLOW SHARE LIKE IF YOU WANT MORE clean ideas
82FX

Learn What is U.S. Dollar Index (DXY) 💵💲
Hey traders,
I share my analysis, signals and forecasts on Dollar Index occasionally. Quite often I receive questions from you asking me to explain what exactly that index means and why it is so important.
Dollar Index (DXY) is a measure of the value of the United States Dollar against a weighted basket of major currencies.
This basket consists of 6 following currencies:
🇪🇺Euro (EUR) - 57.6% share
🇯🇵Japanese yen (JPY) - 13.6% share
🇬🇧Pound sterling (GBP) - 11.9% share
🇨🇦Canadian dollar (CAD) - 9.1% share
🇸🇪Swedish krona (SEK) - 4.2% share
🇨🇭Swiss franc (CHF) - 3.6% share
The selection of the following basket of currencies and their weight is determined by the significance of a trading partnership between the countries.
The index value is calculated with the formula:
USDX = 50.14348112 × EURUSD ^ -0.576 × USDJPY ^ 0.136 × GBPUSD ^ -0.119 × USDCAD ^ 0.091 × USDSEK ^ 0.042 × USDCHF ^ 0.036
The index was launched in 1973 and had an initial value of 100.
When the U.S.D is gaining strength against the above-mentioned currencies, the index is growing, while its weakness against them leads to a decline of the index value.
To conclude, the Dollar Index reflects a fair value of the Dollar and its dominance in global markets. Its analysis may help to make more accurate predictions of the future direction of the dollar related instruments.
Do you analyze DXY?
❤️If you have any questions, please, ask me in the comment section.
Please, support my work with like, thank you!❤️

GBPCHF: Classic Bearish Setup 🇬🇧🇨🇭
GBPCHF recently broke a strong horizontal support area.
Retesting that structure, the price formed a double top formation.
I believe that we will see a bearish movement soon.
Initial goal for sellers - 1.1814
❤️If you have any questions, please, ask me in the comment section.
Please, support my work with like, thank you!❤️

5 MUST READ TRADING BOOKS 📚
Hey traders,
You frequently ask me to share a list of trading books that I personally recommend.
In this post, I gathered 5 books every trader must-read.
Please, note that in that list I included the books that changed my perception of trading. Most of them focus on the psychological aspects of trading and do not teach any particular trading strategy.
📕Trading in The Zone by Mark Douglas.
Douglas uncovers the main fallacies of newbie traders. He focuses on the psychological aspect of trading and its tremendous role in this game. Relying on studies of the human psyche the author teaches readers to beat the ingrained mental habits.
📔The Black Swan by Nassim N. Taleb.
Even though that book is not about trading, it uncovers the aspect of probabilities in life and our perception of them. Especially, Taleb focuses on very rare and extremely low probability events that humans frequently neglect in their predictions and the impact of their occurrence in our lives.
📘The Disciplined Trader by Mark Douglas.
One more book from Douglas. This paper describes the mindset of a successful trader, useful habits and traits. It is looking for reasons why most of the traders fail. The author teaches how to properly react to losing and winning trades and changing market conditions.
📙Market Wizards: Interviews with Top Traders by Jack D. Schwager.
Best traders of the entire world share useful insights of trading. Top experts in the industry talk about their journey, about their path to success and share their valuable experience.
📗Trend Following by Michael W. Covel
Trend is our friend. That is the axiom no one doubts. The only problem is that it is not that simple to follow the trend.
In this book, Covel describes a profitable and efficient trend-following trading strategy adopt.
Of course, reading these 5 books does not guarantee that you will become a consistently profitable trader but I consider them to be very impactful. I always said that a proper mindset is one of the most important things in trading and these books will help you to build it.
Did you read these books?
❤️If you have any questions, please, ask me in the comment section.
Please, support my work with like, thank you!❤️

COMPOUND INTEREST | Time is on your side📚
❗️As it turned out, not all traders are familiar with such an important concept as compound interest. Meanwhile, the use of compound interest in trading can be a very effective tool for making a profit. In short, compound interest is the accrual of interest on interest, and if in detail, then read on.
✅The formula for calculating compound interest has the form:
Compound percentage = (P (1 + g)^ n) – P, where
P – the amount originally invested;
r – interest rate;
n is the investment period.
Let's say you invested an amount of $ 10,000, every year the interest received is added to the principal amount, and new interest is accrued for a larger amount. If the investment period is 5 years, and the interest rate is 10% per annum , then after the specified period, taking into account the compound interest, you will receive a profit in the amount of:
(10000(1+0.10)^5)-10000=6105.1$
And without taking into account the compound interest, the profit for the same period will be:
1000050,10-10000=5000$
As you can see, using compound interest (or in other words reinvesting profits) brought additional income in the amount of: 6105.1-5000 = 1105.1 $.
✅It seems that the figures presented above are not impressive, but the use of compound interest in trading can truly work wonders. In what way? Let's take another look at the compound interest formula described above. It is obvious from the formula that you can increase profit by increasing any of its components. Let's not touch the amount originally invested, but play with the value of the investment period and the interest rate.
To begin with, let's imagine that we will reinvest the profit not every year, but every month. Then the investment period will be 12 5 = 60 months. The interest rate corresponding to this investment period will be equal to: 10%/12=0.833%. Let's substitute these values into the formula for calculating the compound percentage:
(10000(1+0.00833)^60)-10000=6449,8$
As you can see, under the same conditions, but with monthly reinvestment of profits, the income will already be $ 6449.8- $6105.1 =$344.7 more.
Well, if the trader's income is not 0.833% per month, but, for example, 5% monthly, then under the same conditions and for the same period, the profit will already be:
(10000(1+0. 05 )^60)-10000=176791,86$
Felt the difference, impressive, isn't it? And what if you reinvest profits not monthly, but daily? Let's figure it out. With an average yield of 5% per month, the average daily yield will be 5%/21= 0.238% (here 21 is the number of working days in a month). The investment period will be 5360=1800 days. Let's substitute the data into the compound interest formula:
(10000(1+0.00238)^1800)-10000=711617,5$
This is already 711617.5-176791.86 = 534826 $ more than with monthly reinvestment of profits. More than half a million dollars (and this with an initial investment of only ten thousand)! That's impressive. That's what compound interest is in action.
⚠️This is about theory. In practice, it is impossible to achieve a constant percentage of profit every day. Some days a trader inevitably ends up with a loss, some with a profit, and the size of these losses and profits is always different. So it is unlikely to substitute the value of the percentage of profit per day in the above formula. However, the very essence of compound interest, clearly shown above in figures, gives the trader a fairly powerful tool for earning. A trader can and should use compound interest when creating his own money management system.
❤️ Please, support our work with like & comment! ❤️

PRICE ACTION TRADING | THREE TYPES OF TRIANGLES YOU MUST KNOW 📐
Hey traders,
In this post, we will discuss 3 simple and profitable types of a triangle pattern.
1️⃣The first type of triangle is called a descending triangle.
It is a reversal price action pattern that quite accurately indicates the exhaustion of a bullish trend.
Setting a new higher high the market retraces and sets a higher low, then bulls start pushing again but are not able to retest a current high and instead the price sets a lower high and drops to the level of the last higher low setting an equal low.
The price keeps trading in such a manner setting lower highs and equal lows till the price sets a new lower low.
Most of the time it gives a very accurate signal of a coming bearish move.
Please, note that a triangle formation by itself does not give an accurate short signal. The trigger that you should wait for is a formation of a new lower low.
2️⃣The second type of triangle is called a symmetrical triangle.
It is a classic indecision pattern. It can be formed in a bullish, bearish trend, or sideways market.
The price action starts contracting within a narrowing range setting lower highs and higher lows.
Based on them, two trend lines can be drawn.
Breakout of one of the trend lines with a quite high probability indicates a future direction of the market.
3️⃣The third type of triangle is called an ascending triangle.
It is a reversal price action pattern that quite accurately indicates the exhaustion of a bearish trend.
Setting a new lower low the market retraces and sets a lower high, then bears start pushing again but are not able to retest a current low and instead the price sets a higher low and bounces to the level of the last lower high setting an equal high.
The price keeps trading in such a manner setting higher lows and equal highs till the price sets a new higher high.
Most of the time it gives a very accurate signal of a coming bullish move.
📍Please, note that a triangle formation by itself does not give an accurate long signal. The trigger that you should wait for is a formation of a new higher high.
Learn to recognize such triangles and you will see how accurate they are.
Let me know what pattern do you want to learn in the next post?
❤️If you have any questions, please, ask me in the comment section.
Please, support my work with like, thank you!❤️

Three pillars of trading success 📈💲It's time for my mid week educational post.
Today I want to talk about the three pillars needed by all traders for success in the markets.
This isn't just the forex market either this applies to trading all financial markets.
Be it forex, crypto or stocks, so lets get into the the three pillars of success.
PILLAR NUMER ONE- STRATEGY
You MUST have an edge before entering the markets.
When will you enter the market?
When will you close?
What % per trade will you risk?
What pairs will you trade?
What timeframes will you trade?
If you don't have any answers to the above you are entering the markets blind and it will end in tears.
In trading, edge is your ability to select trades that perform better than random.
You can think of edge as the process used to generate and execute entry and exit signals.
Do not enter the markets until you are working a strategy with a proven edge.
The stronger your edge, the more profitable you’ll be.
PILLAR NUMBER TWO- RISK MANAGEMENT
We can't avoid the white elephant in the room on average 80% of trader lose money or fail in the markets.
Some say its even more and you will become one of the stats if risk management isn't applied to your trading.
Some of the reasons losses like these exist in trading is down to the fact that aspiring traders don’t put any thought into their risk management tolerance.
We only ever see the upside when we start out and many never do anything to protect themselves from potential losses.
If you never made any money as a trader before or entered the markets before ask yourself the question below before starting out.
How much money am I comfortable losing?
Your first priority with trading is to stay in the game
So manage your risk per trade and total risk at anyone time.
Understand probability and ensure you are comfortable with your maximum exposure at any one time.
Understand the maximal draw down in your testing when finding your edge.
That way it will help you see what a potential losing run you could experience.
PILLAR NUMBER THREE- TRADING PSYCHOLOGY
We need good trading psychology to keep a balanced mind whilst trading, this stops your emotions leading the trade.
The trade outcome cannot be controlled and you MUST detah yourself from each trade outcome.
You will know when your trading emotions are nailed on when you do not 'FEEL ' anything when trading.
If you have 'emtions' with your trades or when trading simply reduce your risk further.
Two emotions that need particular attention are GREED and FEAR.
You need discipline in controlling these two emotions or you are going to end up making losses as a trader.
We all been there we make a few profits confidence kicks in and then greed before you know it your in whole world of pain.
We all be there at some point with fear to and not executing trades due to a fear being in our trading game say from a poor run of form.
Emotions will always be there we are emotional beings, but they will need controlling in order for you to be a successful trader.
Practice developing the emotional control needed to trade successfully.
FINAL THOUHGHTS
Trading requires 100% commitment most see it as a hobby to start with but this can be costly hobby if commitment to trading is lacking.
The sole reason most get into trading is to make money. One purpose of a business is to make money.
Treat trading as a business at the end of the day it's your personal money that's on the line.
Every trader needs to have a disciplined approach to the markets. Following these three steps will help you.
In order to be a successful trader and run a profitable account, it is essential that you have these three pillars in your trading.
Thanks for taking the time to read my idea.
Darren 👍

Moving Average | Two Profitable Ways to Use 📊
Hey traders,
In this post, we will discuss two efficient ways to apply the moving average(s) indicator in your trading.
Please, note that the settings for a moving average depend on many factors and can not be universal. Time frame, your style of trading and many other factors should be taken into consideration when you define the settings.
1️⃣The first very efficient way to apply moving average is to consider that to be a strong support/resistance. Such a method is appropriate for trend-following traders.
A very important condition to note applying MA as the structure is that the market should be trending: it should trade in a bullish or bearish trend, not in sideways.
📍In a bullish trend, a moving average will provide you a relatively safe point for buying the market after a pullback. Quite often after a test of MA, the price tends to bounce all the way up to a current high and even go higher to the next highs.
📍In a bearish trend, a moving average will serve as a strong resistance and quite often will indicate a completion point of a retracement leg after a strong bearish impulse.
2️⃣The second way to apply moving average is to apply a combination of 2 MAs with different settings (one with a bigger and one with a smaller length). Such a method is usually applied by counter-trend traders.
And again, a very important condition to note, is that if you want to apply this method efficiently, remember that the market must be trending, it should be bullish or bearish.
Your task will be to track an intersection of two MAs.
📍In a bullish trend, a crossing of two moving averages with a high probability will indicate a trend violation and initiation of a new bearish trend.
Such a signal usually serves as a trigger to open a short position.
📍In a bearish trend, a crossing of two moving averages will signify a violation of a bearish trend and the start of a new bullish trend.
The intersection by itself will be a signal to open a long position.
Your task as a trader is to find the most accurate inputs for MAs. With backtesting and experience, you will find the settings applicable to your trading style.
What indicator do you want to learn in the next post?
❤️If you have any questions, please, ask me in the comment section.
Please, support my work with like, thank you!❤️

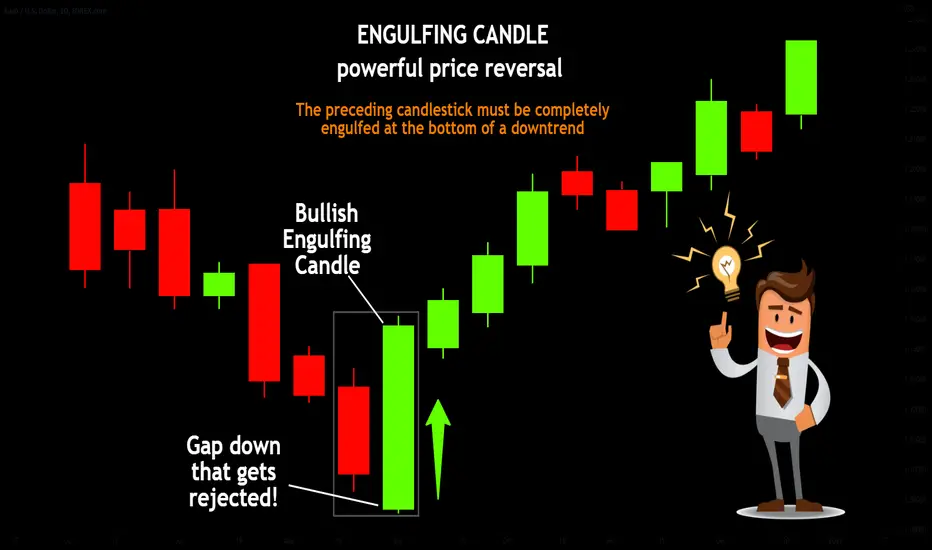
ENGULFING CANDLE | powerful price reversal📚
✅The engulfing model (external bar) is mainly a reversal pattern (although in rare cases it may indicate a continuation of the trend). It looks like two candles, the first of which is small, and the second is large, with a body larger than the entire previous candle, and directed in the opposite direction.
✅From the point of view of crowd movement, such a pattern means that the strength of the current trend is drying up (this is evidenced by the small size of the first engulfing candle). The crowd does not know in which direction to move and, figuratively speaking, is marking time. The appearance of a powerful candle that absorbed the previous one and closed in the opposite direction marks the beginning of a new, strong trend.
⚠️There are several mandatory conditions that the pattern must meet in order for its signal to provide the maximum probability of working out:
1️⃣Before the pattern itself, there must be a downtrend or an uptrend in the market. The movement may be small, but its presence is mandatory;
2️⃣The body of the second candle should be of a different color and orientation (bearish after bullish and bullish after bearish). Shadows may not be absorbed, but then the signal is considered weaker;
3️⃣The body of the second candle should have a contrasting color with respect to the body of the first. The exception is when the body of the first candle is very small (doji or close to it).
❤️ Please, support our work with like & comment! ❤️
CADJPY Analysis and Trade IdeaThe 4H TF is bearish.
There may be a sweep of the weak highs into that supply zone, but I believe price will resume the bearish trend.

3 Important Terms Every Trader Must Know | Trading Basics📚
Hey traders,
In this post, we will discuss 3 very important market situations that every trader must be able to recognize: breakout, retest, and fakeout.
❗️Please, note that the essential element of all these terms is structure: vertical and horizontal key levels.
📍Breakout is a situation when the market breaks the identified horizontal support or resistance, or a vertical trend line.
Breakout is a very important event that signifies the willingness of buyers/sellers to violate the structures. Violation of support signifies a strong selling pressure while a violation of resistance signifies a high buying momentum.
Usually, the structure breakout is confirmed with a candle close.
For confirmation of a breakout of support, a candle close below that is needed.
For confirmation of a breakout of resistance, a candle close above is required.
📍Retest is the situation when the price returns back to broken horizontal support or resistance, or a vertical trend line after a confirmed breakout.
For a structure breakout, high trading volumes are needed. Usually, after a breakout, the market participants are locally exhausted and a correctional movement follows. That may lead to a retest of a broken structure.
Most of the time, after a retest a strong impulse follows. For that reason, for many traders, the retest is applied for trading entries.
📍Fakeout or false breakout is the situation when the price has not enough strength to maintain its direction after a retest of a broken structure. Instead, the market returns back below/above the broken resistance/support.
Fakeout is one of the main reasons, why structure traders lose money.
One of the ways to avoid fakeout is to monitor trading volumes during a structure breakout. A volume spike is needed to confirm the strength of the market participants while low volumes most of the time signify a manipulation.
Learn to spot breakouts and false ones, and try to trade on a retest.
Let me know what do you want to learn in the next post?
❤️If you have any questions, please, ask me in the comment section.
Please, support my work with like, thank you!❤️

Candlestick Action | How Candles Are Formed🕯
❗️Japanese candlesticks as a technical analysis tool were invented earlier than others, but they were not widely used immediately. By the name, it is easy to guess that Japan became the "homeland": local rice traders used this method already in the 18th century. However, due to the geographical remoteness and closeness of the country from external "visitors", this type of chart gained popularity much later, when exchange life was already actively boiling in Europe and the USA.
✅What is hidden behind the candlestick chart?
🟢A candle is formed from 4 prices: opening, closing, high and low for a certain period of time. If we take a timeframe of a minute, then each candle will indicate the price movement within this minute, if an hour is inside an hour, if a day is inside a day. The distance between the opening and closing price is the "body" of the candle, and the tails show to what lows and highs the price reached. If the opening price was higher than the closing price, then the candle will be black; and vice versa: if the opening price is lower than the closing price, then the candle will be white. It turns out that candles are, in fact, the psychology of the market, they most accurately reflect the fears and hopes of its participants.
🟢The charts of Japanese candlesticks themselves are valuable for analysis: the resulting models are interpreted as models of reversal or continuation of the trend. It is also important to understand: each individual candle or a combination of candles is just a way of depicting the actions and moods of all bidders for the period we have chosen (day/week/ month, etc.). The fact is that human behavior is quite formulaic in the same situations, and that is why various methods of chart analysis are so popular with investors and traders.
🟢Looking at only one or several candlesticks, a "savvy" viewer can easily understand whether the market is set to rise or fall, change the current trend or its continuation, increase the momentum of movement or its attenuation.
⚠️It is important to understand that the behavior of individual bidders develops into a general market movement, which can be "read" using charts of Japanese candlesticks and their basic models. Therefore, your optimal investment decisions will be supported by the most effective moments of entry or exit from the position, which will significantly improve the financial result.
❤️ Please, support our work with like & comment! ❤️

Trading the bleeding markets with a winning mindset ;)There's a great struggle going from profit to loss.
A burst of a bubble, which in it's essence is hope.
But this is false.
The odds are, that your profits were on paper, so how does a loss on paper differ from a profit on paper?
Truth is - It doesn't.
But what it does do is play with your emotion.
Our mind has a tendency of expecting the worst once things start rolling in that direction.
Take a step back and think about what life threw at you so many times in the past, think about the times you thought things are going to end up the worst but actually didn't.
It could be you planned a nice day outside with your partner in the park but it started to rain.
But instead of crying about the day wasted and how this is just awful, you ended up cooking together a nice lunch and drinking wine while finding a new great TV show to watch, ending up being one of the best days in a while.
Not let's roll back to trading.
And let's cut out negative thinking completely just for 3 minutes and look only at the positive.
Positive points -
1) Cheap instruments all around to invest in
2) Great practice of mental skills while trading, which truly is the most influential aspect of mastering trading
3) It reminds you the very basics of trading that we lose track of once markets start flying up - Buy low, sell high.
4) Opportunity, opportunity, opportunity - Every time you would have bought into the stock market, over a few year period you would make great returns, same thing goes even for people who bought Bitcoin after the decline of 2018 and pretty much any other pop financial instrument.
5) You're a day trader? Great! Volatility is amazing if you have a strategy which is disciplined and consistent as well as based on risk management.
See how bright the light shines at this very moment?
Keep it. Be positive. Be hopeful. Be practical.
The negative quotes such as -
I can lose everything!
It's never going to rally back!
This is taking too long!
I don't have patience for this!
This is turning out to be so not fun!
I didn't expect to hold this trade this long!
How will any of this benefit you in any way? Where's the logic? Where's the gain? Where's the analysis? Where's the market view? Where's the money management?
Only look at what is relevant to your success. Block the negative, ignore it completely as much as you can and eventually always.
------------------------------------------------------------------------------------------------------------------------------------------------------------------------------------------------------------------
Thank you so much for reading! I hope you found my idea useful, if you did, please like and follow! It would mean the world to me.
-------------------------------------------------------------------------------------------------------------------------------------------------------------------------------------------------------------------
