Lilly (NYSE: $LLY) Jumps as FDA Expands Jaypirca UseEli Lilly and Company (NYSE: NYSE:LLY ) received a major regulatory boost after the U.S. Food and Drug Administration approved an expanded indication for its non-covalent BTK inhibitor, Jaypirca (pirtobrutinib). The drug is now approved for adults with relapsed or refractory chronic lymphocytic leukemia (CLL) or small lymphocytic lymphoma (SLL) who have previously been treated with a covalent BTK inhibitor, broadening its therapeutic reach and transitioning its earlier accelerated approval into full approval.
Jaypirca remains the first and only FDA-approved non-covalent BTK inhibitor, uniquely positioned for patients who no longer respond to ibrutinib, acalabrutinib, or zanubrutinib. The expanded indication is supported by the BRUIN CLL-321 trial, a Phase 3 head-to-head study showing Jaypirca’s superior clinical benefit compared to idelalisib plus rituximab or bendamustine plus rituximab in previously treated patients.
Lilly, now valued near $928 billion and trading just below its 52-week high of $1,111.99, continues to strengthen its biotech leadership with a rapidly expanding oncology pipeline. With a PEG ratio of only 0.42 and a 55-year dividend history, the company offers a rare blend of growth and income stability—attributes that have fueled consistently bullish analyst sentiment. Major firms including Guggenheim, BofA Securities, and BMO Capital have recently raised their price targets, citing strong performance across Lilly’s GLP-1 weight-loss and diabetes portfolio, as well as upcoming late-stage trial catalysts.
Technical Outlook
LLY remains in a strong long-term uptrend after printing an all-time high near $1,111. Price is currently retracing, with the $970 region emerging as a potential support zone aligned with prior structure and rising trend momentum. If this level holds, bulls may regain control and push the stock back toward the $1,080–$1,110 zone. A breakdown below $970 could trigger a deeper pullback, but overall sentiment remains firmly bullish.
Lilly

Eli Lilly’s $1T Breakout at 1060 | End of the Supercycle?Eli Lilly (LLY) – Macro Elliott Wave, Fibonacci & Historic $1 Trillion Milestone
LLY has now reached a critical long-term inflection point, advancing directly into the 2.618 Fibonacci extension , completing the projection of a full five-wave Elliott Wave cycle. This precise alignment establishes the 1060 region as a high-confidence macro top zone.
At today’s high of 1060 , LLY also achieved a historic milestone - crossing the $1 Trillion market-cap threshold , becoming the first medical company in history to reach this valuation. This achievement underscores the extraordinary scale of the preceding multi-year impulse and reinforces the significance of the current structural level.
With price holding at these unprecedented highs, the market is operating deep within a premium zone , where long-cycle reversals typically begin. While the bullish structure remains intact for now, the confluence of Fibonacci exhaustion, wave completion, and valuation extremity creates a strong, affirmative expectation that LLY is entering its macro topping phase.
The broader corrective roadmap follows a classical A–B–C structure , with downside levels anchored to key long-term Fibonacci retracements:
• The 0.236 retracement at ~245 forms the primary target for the anticipated Wave A leg, aligning with prior institutional accumulation and structural demand.
• The 0.382 retracement at ~98 represents the major macro demand zone and the high-probability destination for full cycle re-pricing via Wave C.
Taken together - the completed Elliott Wave structure, extreme Fibonacci extension, and the unprecedented $1T milestone - LLY stands at one of the most significant macro levels in its history. The next major move is expected to guide the market from its expansionary phase into a multi-year structural correction, with clearly defined downside objectives.
What do YOU think happens next?
Breakout or fake-out? Drop your prediction below!
👇 We are replying to every comment - let’s talk charts .
Smash the 👍 if this helped, hit 🔔 to catch the next setup,
and FOLLOW for more high-probability wave + SMC plays.
⚠️ Disclaimer
This content is for educational and informational purposes only and does not constitute financial, investment, or trading advice. All analyses reflect personal opinions based on publicly available data and chart structures. Markets involve risk, and you should always perform your own research or consult a licensed financial professional before making any trading decisions. Past performance does not guarantee future results.

Eli Lilly Drug Shows New Potential in Curbing Food CravingsEli Lilly’s GLP-1 weight-loss drug tirzepatide — sold as Mounjaro and Zepbound — may do more than suppress appetite. A new Nature Medicine report shows that in one patient with severe binge-eating behavior, the drug appeared to silence food-craving signals in the brain’s reward center. This is the first direct recording of brain activity in a person receiving tirzepatide, offering rare insight into how GLP-1 drugs may reduce “food noise.”
Researchers from the University of Pennsylvania monitored the brain activity of four patients undergoing deep-brain stimulation for loss-of-control eating disorders. Only one was already taking tirzepatide. During electrode monitoring, her nucleus accumbens — the core craving region — showed no binge-triggering activity, and she experienced no food preoccupation. The other three patients showed the usual spikes in brain activity before cravings. While the findings cannot be generalized due to the small sample size, researchers believe this opens a door for exploring GLP-1 drugs as potential treatments for certain eating disorders.
Technically, Eli Lilly’s stock continues its strong bullish structure. Price recently broke above a major resistance zone at $960, pushing into new all-time highs. With this breakout, the market may wait for a clean retest of former resistance — now support — before another upward continuation. The next psychological levels to watch remain $1,100 and $1,200, which could act as future resistance zones if momentum continues.

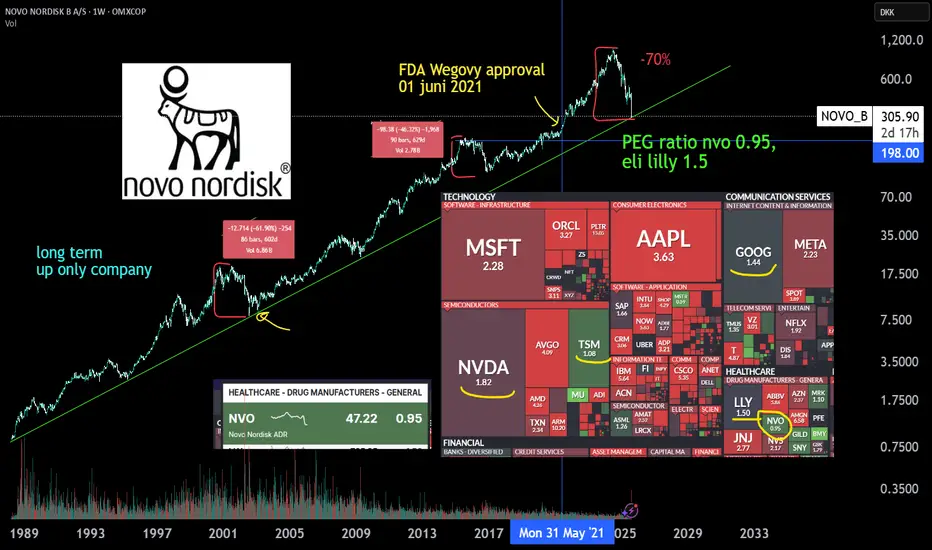
$NOV: Lot of loss in weight loss. Is it in buy zone? Currently the weight loss drugs are having a severe loss of weightage in the corresponding indices. The poster child of weight loss and diabetes drugs XETR:NOV and NYSE:LLY are seeing some of the worst drawdown in their history. Today we look at the worst of the 2 in this space which is $NOV. Novo Nordisk had a lot of missed steps in the current year, and the stock price has lost almost 70% from its peak of 148 $ in June of 2024. It has a long and painful drawdown of almost 70% from its ATH.
The downward sloping pattern is so prominent that it is hard to ignore the drawdown in this stock. But the question comes will there me more loss and pain this weight loss pioneer or there is a visible buy zone for this stock. I did some unorthodox chart today plotting the downward slopping Fib retracement by joining the tops of the recent lower highs and on the lower bound of the lower lows. We see the clear levels provided by the Fib levels. Currently the stock is at 0.786 level with price at 49 $. I think once the key psychological level of 50 $ is broken the stock can go below the 0.786 level and may touch the 1.0 Fib level which is @ around 40 $. And with 0.618 being the upper limit with price 52 $. This range was also in play during 2021 and 2022 when the stock did a year long consolidation before moving higher.
Verdict: XETR:NOV is within the accumulating zone with 52 $ as top and 40 $ as the bottom. 70 % drawdown from the top is a tempting discount on the price and a good entry point for long term.

NovoNordisk, LT dirt cheap | GLP-1 a misunderstood growth marketNovo Nordisk stock has lost quite some weight since the release of Eli lilly's drug Zepbound and Mounjaro and since the rise of compounded, or generic copycat GLP-1 alternatives. The growth of the company has slown down a bit, but the overall GLP-1 market growth is still impressive and misunderstood. Both Lilly and NVO have become some of the cheapest PEG stocks in the markets and compettitors, of which most known, Hims en hers health also took a slice of growth of this market by telehealth GLP-1 descriptions.
The copycat descriptions could be dangerous due to unvalidated low quality GLP-1 or agonist GLP-1 substances. Therefore a lot of law suits have been initiated by NVO.
Where Oral Wegovy still has to be FDA approved withinin ~4, 7 months in USA, the company also has new medication approvals awaiting in the pipeline, medications like Cagrisema. (Phase 3 clinical trials, approval in late 2025 or early 2026)
Amycretin - a unimolecular long-acting GLP-1 and amylin receptor agonist.
Where investors have already praised Lilly for the better drug, GLP-1 demand is surging harder than production for both companies.
Where Wegovy and Ozempic are approved by The FDA to sell, many costs for the patients themselfs aren't covered by the health insurance yet. Wegovy or Zepbound isn't covered for mainstream when prescribed by your physician yet. it's only covered for severe obisty for example. Therefore penetration rates of the drug aren't very high yet and will get higher where it will be coverd for more people. Also due to the high cost many copycat GLP-1 agonist market have arisen.
There is some improvement in cost coverage for these types of medicine Which will boost the revenue due to prescribtion sales.
Next these facts, there are still new markets for GLP-1 to be approved like in india and Japan where worldwide demand is much greather than production capacity. Both Lilly and NVO are expanding fast. Many new production volume is created and Needed!, NVO is expanding production sites in brazil and china.
I'm exited for the earnings today. NVO has had many dumps before but has proven to be a up only company. The profits of the company have doubled from $7B to >$14B since Wegovy FDA approval. from the top shares have dumped 70% where there is still >10% growth. Since the FDA approval (june 2021), other markets excluded the share is just +40% up. The stock is much cheaper now with double the profits and revenue, and still >10% growth.
Let's see what happens with earnings. Good luck.
LLY, LILLY IS THIS STOCK PRICE SILLY?I hope you appreciated my rhyme.
So what to say about this.
One main trend line at the moment.
Big support incoming at 580 to 560 range.
Really big support at 108.
The lines in the middle (light green and red) are fairly weak and more likely short term targets.
I assume the long term targets will line up well with the gaps which are marked in orange.
Orange also on RSI, which is saying be careful.
Short term can take it up to 980 or so but I think the lower targets are more likely and we'll see the higher targets after trend breaks and before it starts to really drop.
However, there are a lot of possibilities that can occur.
The main possibility looks to be a chance of a move to 980, but more likely won't get there and might stick around 780.
I really have a hard time saying what this will do and when it will top out, I could tell you more if I watched this daily, but I don't.
This chart is long term price targets for the downside and the upside.
Given the single trend, you'll need a new chart as more develop, feel free to message if I haven't updated after some time.
I think that covers most everything.
Summary.
I think this stock is overvalued big time, but still has potential to keep seeing more upside in the short and mid term.

LLY rides its success against obesity and diabetes LONGLLY shown on a daily chart has doubled in the past year with the introduction of new FDA
approved drugs into the market. It has but out a series of favorable earnings reports with
optimistic realistic guidance and glowing analysts' forecasts. It has done so without any volume
pumps and just keeps grinding higher. This is because it is in the shadows of big technology
stocks. Revenues consistently beat analysts' forecasts quarter after quarter.
Institutions add small lots trying to preserve the price for future buys without any
run-ups. I have done the same thing and I will continue to do so. While day trading
biotechnology penny stocks, LLY along with UNH, PFE, and AZN is where the profits are
parked for growth and compounding.

i think so i am new from crypto i watched past histroy so i predict this i dont know iam bigginer also wait and watch

Eli Lilly, Bear Divergence and a Repeat Head & Shoulders PatternEli Lilly Oversold on the Monthly RSI.
RSI and MacD are both indicating bearish divergence.
Repeat on Head & Shoulders Pattern
Stock trading at 50x of earnings (forward P/E is 20), PEG ratio of 3.50! Price is 9x book value.
High Risk to Reward Ratio
3.8 to 1 with a large stop of $5.50
6:1 or better with a stop above the swing high
Target 1: $96
Target 2: $90
You could open a short now with a 5.5% stop loss, or you could wait for the H&S to complete itself.
