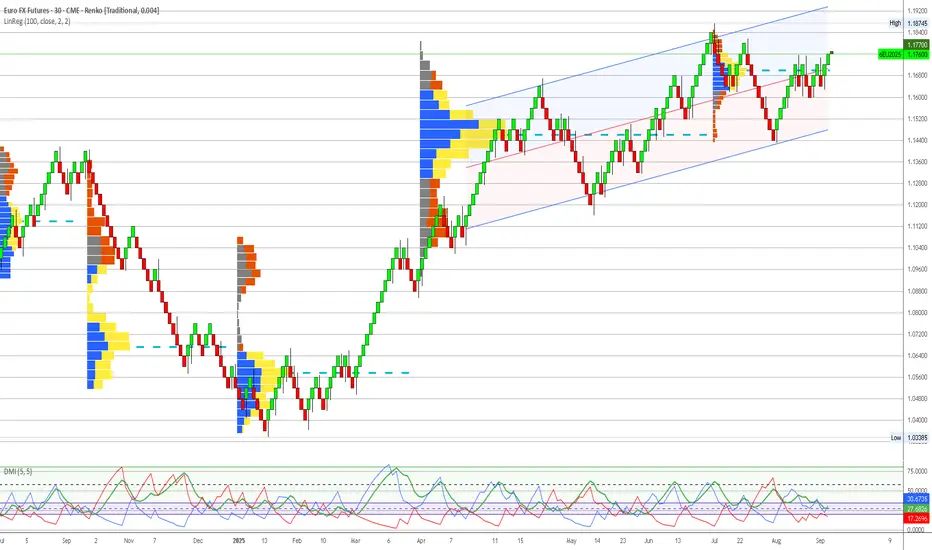
Euro Futures (6E) - Technical Analysis Report - 20250908Analysis Date: September 8, 2025
Current Price: 1.1742
Market Session: Post-Market Analysis
---
Executive Summary
Euro Futures presents the strongest technical setup among analyzed markets, with exceptional execution chart alignment despite moderate institutional positioning. The currency pair has emerged from a major bottoming pattern with validated bullish momentum signals across all timeframes. While institutional accumulation is less pronounced than in commodity markets, the technical breakout quality and central bank policy divergence create compelling risk/reward opportunities.
---
Quarterly Volume Profile Analysis
Institutional Positioning Intelligence
The quarterly volume profile (Q3 2025) reveals moderate but strategically positioned institutional activity in the Euro:
Primary Institutional Activity Zone: 1.1550-1.1700
Moderate blue volume concentration representing institutional positioning during major low formation
Current price (1.1742) trades at upper boundary of institutional accumulation zone
Volume profile shows classic bottoming pattern with accumulation at major support levels
Institutional activity concentrated around key technical support levels from previous cycles
Volume Profile Architecture:
Core Accumulation: 1.1580-1.1650 (primary institutional positioning)
Extended Support: 1.1450-1.1550 (secondary institutional interest)
Breakout Level: 1.1700-1.1750 (current resistance/breakout zone)
Void Zone: Above 1.1800 (minimal resistance, potential acceleration territory)
Resistance Structure Analysis:
1.1750-1.1800: Initial resistance with mixed volume activity
1.1850-1.1900: Moderate yellow volume indicating previous distribution
1.1950+: Historical distribution zones from earlier 2025 highs
Price Structure Context
Historical Pattern Recognition:
The current Euro setup displays textbook currency reversal characteristics following a major multi-month decline. The institutional accumulation at 1.1550-1.1700 represents strategic positioning by smart money during the formation of a significant low, typical of major currency cycle turning points.
Critical Structure Validation:
Institutional Floor: 1.1450 represents absolute lower boundary of smart money positioning
Volume Point of Control: 1.1620 shows peak institutional activity within accumulation zone
Breakout Validation: Current price above institutional accumulation confirms technical breakout
Risk Definition: Clear institutional boundaries provide precise risk management parameters
Central Bank Policy Context
Policy Divergence Supporting Euro Strength:
European Central Bank maintaining restrictive policy stance
Federal Reserve approaching policy pivot with potential dovish shift
Interest rate differential dynamics favoring Euro in medium term
Quantitative tightening policies supporting European currency fundamentals
---
Execution Chart Technical Analysis
Current Technical Configuration - EXCEPTIONAL BULLISH ALIGNMENT
DEMA Analysis - STRONGEST BULLISH SIGNAL IN ANALYZED MARKETS:
Black Line (Fast DEMA 12): Currently at 1.1742
Orange Line (Slow DEMA 20): Currently at 1.1712
Configuration: Perfect bullish crossover with expanding gap
Trend Bias: Strongest technical momentum across all analyzed markets
DMI/ADX Assessment - CONFIRMED TRENDING CONDITIONS:
ADX Level: 35+ indicating strong directional movement
+DI vs -DI: +DI clearly dominant over -DI with expanding spread
Momentum Direction: Confirming sustained bullish bias with conviction
Trend Strength: ADX rising confirms institutional and technical alignment
Stochastic Analysis - HEALTHY MOMENTUM STRUCTURE:
Tactical Stochastic (5,3,3): Bullish configuration with room for extension
Strategic Stochastic (50,3,3): Confirming longer-term bullish momentum shift
Divergence Analysis: No negative divergences, clean momentum structure throughout
Support and Resistance Levels
Immediate Technical Levels:
Current Support: 1.1710 (DEMA 20 orange line)
Key Support: 1.1680 (recent breakout consolidation)
Major Support: 1.1620 (institutional accumulation core)
Immediate Resistance: 1.1780 (near-term extension target)
Key Resistance: 1.1820 (major resistance zone)
Major Resistance: 1.1900 (significant distribution zone)
---
Trading Scenarios and Setup Criteria
Scenario 1: Continuation Long Setup (PRIMARY)
Optimal Conditions for Long Entry:
DEMA bullish maintenance: Black line remaining above orange line with gap expansion
DMI confirmation: +DI sustaining dominance over -DI with strengthening ADX
Breakout validation: Price holding above 1.1700 breakout level
Volume confirmation: Increased volume supporting upward momentum
Policy support: Central bank divergence maintaining fundamental backdrop
Entry Protocol:
Primary Entry: Current levels 1.1740-1.1760 (validated breakout zone)
Secondary Entry: 1.1710-1.1720 on any pullback to DEMA support
Position Sizing: Aggressive 2.5% account risk given exceptional technical setup
Stop Loss: Below 1.1680 (breakout failure)
Profit Targets:
Target 1: 1.1820 (first major resistance) - Take 40% profits
Target 2: 1.1900 (distribution zone approach) - Take 30% profits
Target 3: 1.1980-1.2000 (major resistance complex) - Trail remaining 30%
Scenario 2: Pullback Accumulation Setup (SECONDARY)
Conditions for Pullback Entry:
Price retracement to 1.1700-1.1720 breakout support zone
DEMA holding bullish configuration during pullback
Stochastic oversold providing tactical entry signal
Volume profile respect at breakout support levels
Pullback Setup Parameters:
Entry Range: 1.1700-1.1720 (breakout support zone)
Stop Loss: Below 1.1680 (breakout invalidation)
Targets: Same as primary scenario with enhanced risk/reward
Position Sizing: Maximum allocation given superior entry point
Scenario 3: Acceleration Breakout Setup (AGGRESSIVE)
Breakout Trading Framework:
Acceleration Level: Above 1.1800 (void zone entry)
Volume Confirmation: Significant volume expansion supporting breakout
Technical Validation: DEMA gap expansion with ADX above 40
Momentum Persistence: +DI expanding dominance over -DI
Acceleration Parameters:
Entry: 1.1805-1.1820 on confirmed acceleration
Stop: Below 1.1750 (failed acceleration)
Extended Targets: 1.1950, 1.2000, 1.2050+
Position Management: Trail stops using 0.004 structure levels
---
Risk Management Protocols
Position Sizing Guidelines
Aggressive Approach (Recommended for 6E):
Maximum Risk: 2.5% of account (increased allocation due to exceptional technical quality)
Contract Calculation: Account Size × 0.025 ÷ (Stop Distance × $12.50 per pip)
Example: $100,000 account with 60-pip stop = 33 contracts maximum
Rationale: Strongest technical setup justifies aggressive allocation
Stop Loss Hierarchy
Tactical Stop: 1.1710 (DEMA support)
Strategic Stop: 1.1680 (breakout support)
Emergency Stop: 1.1650 (institutional accumulation boundary)
Profit Management Framework
Systematic Profit Taking:
First Target (40%): Lock in profits at initial resistance zone
Second Target (30%): Capture extended move through distribution areas
Final Position (30%): Trail for potential acceleration beyond 1.2000
Trail Stop Method: Use 0.004 structure chart levels once in profit
---
Market Context and External Factors
Fundamental Catalysts Supporting Euro Strength
Central Bank Policy Dynamics:
ECB maintaining restrictive stance longer than Fed
Interest rate differential shifting in favor of Euro
Quantitative tightening supporting currency fundamentals
Inflation dynamics favoring European monetary policy
Economic Factors:
European energy security improvements reducing volatility
Manufacturing sector stabilization supporting economic outlook
Current account dynamics favoring Euro strength
Political stability improving investor confidence
Technical Market Structure
Currency Market Positioning:
Speculative positioning showing Euro oversold conditions reversing
Commercial hedger activity supporting Euro strength
Cross-currency relationships confirming Dollar weakness
Volatility patterns suggesting sustained directional move
---
Monitoring Checklist and Alert Levels
Daily Monitoring Requirements
DEMA Configuration: Maintain bullish black above orange relationship
Breakout Respect: Confirm price behavior above 1.1700 breakout level
Volume Analysis: Monitor for volume expansion on upward moves
Central Bank Events: ECB and Fed policy statements, economic data releases
Dollar Correlation: Monitor relationship with DXY and other major currency pairs
Critical Alert Levels
Bullish Escalation Alerts:
Break above 1.1800 with volume expansion
DEMA gap expansion beyond 30 pips
+DI moving above 40 with ADX persistence above 40
ECB hawkish policy statements supporting fundamental backdrop
Risk Management Alerts:
DEMA bearish crossover (black below orange)
Break below 1.1700 breakout support level
ADX declining below 25 indicating momentum loss
Fed policy pivot announcements affecting interest rate differential
---
Strategic Outlook and Conviction Assessment
Risk/Reward Analysis
Exceptional Setup Characteristics:
Risk: 60 pips to breakout support (1.1680)
Reward: 150+ pips to first major resistance (1.1900+)
Risk/Reward Ratio: 2.5:1 minimum, potential 4:1+
Probability Assessment: High (80%+) based on technical breakout quality
Portfolio Allocation Recommendation
Maximum Technical Conviction Positioning
Euro Futures represents the highest quality technical setup in the current market environment. The exceptional alignment of DEMA crossover, DMI momentum, and validated breakout above institutional accumulation creates optimal conditions for aggressive positioning. While institutional accumulation is less pronounced than in commodities, the technical execution quality and central bank policy support justify maximum allocation within risk parameters.
Allocation Framework:
Primary Portfolio Weight: 20-25% (maximum technical conviction)
Entry Method: Immediate positioning with scale-in capability on pullbacks
Hold Period: Expect 3-8 week position duration
Exit Strategy: Systematic profit-taking at technical resistance levels
---
Conclusion and Strategic Assessment
Euro Futures presents the strongest technical setup among all analyzed markets, with exceptional DEMA crossover quality and validated breakout above institutional accumulation. While the institutional positioning is less dramatic than commodity accumulation patterns, the technical execution signals are pristine and supported by favorable central bank policy dynamics. Current positioning above breakout support offers superior risk/reward characteristics with clearly defined parameters for both profit-taking and risk management.
Implementation Priority: Immediate aggressive positioning recommended - this technical setup quality represents the gold standard for momentum-based entries with institutional validation.
Next Review: Daily monitoring of DEMA configuration and breakout level respect
Position Management: Systematic profit-taking protocol with trailing stops at technical levels
---
Important Disclaimer
Risk Warning and Educational Purpose Statement
This analysis is provided for educational and informational purposes only and does not constitute financial advice, investment recommendations, or trading signals. All trading and investment decisions are solely the responsibility of the individual trader or investor.
Key Risk Considerations:
Futures trading involves substantial risk of loss and is not suitable for all investors
Past performance does not guarantee future results
Market conditions can change rapidly, invalidating any analysis
Leverage can amplify both profits and losses significantly
Individual financial circumstances and risk tolerance vary greatly
Professional Guidance: Before making any trading decisions, consult with qualified financial advisors, conduct your own research, and ensure you fully understand the risks involved. Only trade with capital you can afford to lose.
Methodology Limitations: Volume profile analysis and technical indicators are tools for market assessment but are not infallible predictors of future price movement. Market dynamics include numerous variables that cannot be fully captured in any single analytical framework.
The views and analysis presented represent one interpretation of market data and should be considered alongside other forms of analysis and individual judgment.
Linearregressionchannel
SPY to $585?: EOY Price TargetUsing the Magic Linear Regression Channel on TradingView.com we look at some possible scenarios for SPY price movement. A shorter term regression channel shows SPY at the top of the channel and rejecting it today - even with more buyers than sellers in the TradingView Volume Footprint chart view.
The bottom of the channel converges with last pivot low near $584. It could conceivable go lower, but with lower volume likely during the holiday season, it would seem less likely for it to make any more big moves barring some major unexpected event.

TSLA to $420?TSLA has been on a tear over the past month or so. Using the Magic Linear Regression Channel indicator we look at the chart of TSLA and see that it has blown through a lot of the parallel channels, making it seem difficult to pinpoint. But, by adding an outer Fibonacci band to the Magic Linear Regression Channel, and selecting starting pivot highs followed by the biggest drops, we can form a channel that has an upper Fibonacci channel that coincides with the all-time high. However, since TSLA didn't get to Elon's favorite number, 420, last time around, I think it will make it there this time before correcting or consolidating. And, it could make it there before the end of the year.

PLTR to $80 by EOYPLTR had a great day today, and has had a great month so far following an earnings report that beat estimates. Using the Magic Linear Regression Channel we can see that PLTR broke out of a 2-year long channel at the beginning of the month (November 2024) following it's earnings report.
This means that its price structure has a brand new change of character. Using a second Magic Linear Regression Channel , we can create a new channel based on the pivot high prior to earnings and the pivot high prior to today. However, PLTR is also breaking out of that channel. By adding an additional outer Fibonacci band to the new channel, we can see that PLTR has a potential area of interest at around $80 - a 10% move.
If the new channel is valid, then this can be the first area where we might see a correction in a bullish scenario. Since PLTR is already at the top of the new channel, it could potentially bounce back from there, but it's already moving up in post-market trading, so, I'm guessing that bearish scenario is less likely.
Barring some crazy world events, I'm guessing we can see a steady move to $80 before seeing any kind of major correction.

SMCI to $60? When?!?In this video, I use the Magic Linear Regression Channel , Multi VWAP , and Magic Order Blocks indicators to build a case for a $60 SMCI target. In short, it might be a few months away. Using a linear regression channel starting on May 8th, 2024, and ending October 29th, 2024, we can see that the channel is respected at multiple levels.
In today's trading, we see a rejection from the Inner Fibonacci Level - Upper in the Magic Linear Regression Channel tool. I was expecting this a few days ago based on the projected channel.
With the Multi VWAP indicator we see that the price is currently above the 5-Day anchored VWAP (AVWAP). It can potentially continue to hold that and go through some consolidation before heading back to the top of the channel. At which point, it could reject or consolidate more.
I suspect that with the accounting issues behind them, SMCI price will continue to recover. However, above the upper channel lies the year-to-date anchored VWAP, which should be at around $60 by the time SMCI can get there. This will be a level of interest.
On the daily chart, we see that the 5D AVWAP gets respected with a bottom wick on the 15min chart that tags it almost perfectly at around $39. We also see an order block acting at support at that same level using the Magic Order Blocks indicator. That gives us further evidence that we could potentially have the 5D AVWAP holding price up as support during a period of consolidation.
Should SMCI continue its bullish momentum, there are two potential areas of consolidation - if not outright rejections - at the Inner Fibonacci Upper level and at the upper linear regression band. If it makes it through, the next target will be the YTD AVWAP.

SMCI four-hour chart shows confluence.NASDAQ:SMCI shows a bullish cup and handle on the four-hour chart, as well as a bullish Gartley harmonic. Point C of the harmonic lined up with the lower four-hour 100 linear regression channel and provided the best entry. The middle of the four-hour 100 linear regression channel coincided with the handle of the cup, as well as the weekly 20 SMA, which provided another excellent entry with more confirmation.

XAUUSD IntradayTraders,
Keep a close eye on the Revised UoM Consumer Sentiment release, as any bearish surprises could sway market sentiment, particularly favoring a stronger dollar. Adjust or remove orders accordingly based on the outcome.
Here's a breakdown of our analysis:
Daily Chart: We maintain a bullish outlook, having responded positively to the bottom of the channel.
4-Hour Chart: Strong support and resistance levels have been breached, signaling potential upward momentum.
Intraday: Early hours of today's candle presented favorable trading opportunities, although reversals could also serve as viable entry points for short positions.
Exercise caution and adapt your strategy in response to evolving market conditions.
Best regards,

ADX + DMI + LineReg Live TradingI used the replay trade function to test out ADX+DMI + using a LineReg to set TP + SL areas. I thinked it worked pretty well trading USD/JPY for the week of 1/9/2023. Success rate was 66.67% but I wasn't having strict trading rules since I was trying to trade how a normal would psychologically. I think with follows stricter rules this could have higher percent win rate & higher profit. Even with losses I was hit with I still cleared over $2000 for the week. Please ignore my girlfriends family as they are cleaning out a closet lol

Expecting Going Down Using Elliot WaveExpecting going down using Elliot Wave and possible double bottom.
Expecting sideway until around Week 2 or Week 3 January 2023, may happen market correction after this timeline.
Beware of gap or long candle that may expedite reversal.
Good luck.

When Will DXY (Dollar Index) Resume Its Devastating Uptrend?Primary Chart: Linear Regression Channel for DXY on Daily Chart, Upward Trendline from November 2021, and Parallel Channel from 2008 DXY Lows
Since the low on January 6, 2021, DXY (the dollar weighted against a basket of several other major currencies) has ripped about 28.66% higher, causing ripple effects in equity markets, commodities, and international trade. This has been massive run that has pushed DXY to within a proximate range of a 21-year high at 121.05, a level last reached in July 2001 during the bear market of 2000-2002.
Supplementary Chart A: Weekly Chart of DXY with a Parallel Channel Showing the Uptrend Since 2008 along with the 21-Year High on July 2021
The Primary Chart shows a linear regression channel set at +/- 2 standard deviations. The channel runs from the lows on October 27, 2021. The current pullback in the US Dollar Index is nearing a -2 standard deviation move. At the lower edge of the channel will equal -2 standard deviations from the linear regression line (at the center of the channel).
Interestingly, the lower boundary of this regression channel coincides to some extent (not perfectly) with the upward trendline drawn on the Primary Chart. But when the chart is switched to logarithmic, the up trendline runs nearly parallel with the lower bound of the regression channel. This parallel relationship between the up trendline and regression channel's lower boundary is posted in Supplementary Chart B below.
Supplementary Chart B: Logarithmic Trendline from October 2021 to Present Date
Next, consider a slightly longer-term trend reflected by a somewhat longer regression channel shown on a weekly chart. This regression channel shows that the recent pullback has not even reached the midpoint of the channel at the linear regression line, though it could pull back to that area. This somewhat longer-term trend has been shown to illustrate the strength of this trend and to contextualize the pullback, which remains very mild in light of this larger-degree trend. Strong trends generally tend to continue after corrective retracements rather than reverse—though the crash in equities this year shows that strong trends can and do reverse at some point.
Supplementary Chart C: 2-Year Linear Regression Channel from January 2021
Fibonacci price analysis also provides a plausible technical argument for why DXY could end its pullback near the upward trendline support and the regression channel's lower boundary. This Fibonacci projection (or a measured move) appears on the Primary Chart above, and it shows that the 1.00 to 1.272 zone (where the two segments of the current decline are equal or nearly so) ranges from 107.93 to 109.21. Could this be where DXY reverses back higher to continue it's trend? Could this be where DXY moves back into the center of its channel? Given the strength of the trend over the past 2 years, this area seems like a spot where some significant chance exists for a reversal higher. Much will depend on the FOMC meeting on November 1-2, 2022. If DXY turns back higher, then it may well be that equity indices stall around the same time and turn back lower.
Finally, consider a major weakness in the bull case in the intermediate term. Price has tested the top of the very long-term parallel channel now three times, as shown by the blue arrows on the Primary Chart. This makes sense that price would reject here given the long-term nature of this dynamic resistance level at the top of the parallel channel. This area is now weaker, though given the repeated contact price has had with it, including a few minor breaks that didn't last.
Will price reject lower again on the next retest of the return line at the upper bound of the parallel channel? Or will it overthrow the parallel channel's upper bound in a final multi-week exhaustion move?
An alternative is to target 116-117 in the index as the next upside target. If the parallel channel is redrawn on a logarithmic chart, channel resistance has not yet been tested yet in September and October 2022. In fact, the next push higher could test the upper channel on the log chart at 116-117.
Supplementary Chart D: Parallel Channel Drawn on Logarithmic Chart
Feel free to post your argument in the comments below!
________________________________________
Author's Comment: Thank you for reviewing this post and considering its charts and analysis. The author welcomes comments, discussion and debate (respectfully presented) in the comment section. Shared charts are especially helpful to support any opposing or alternative view. This article is intended to present an unbiased, technical view of the security or tradable risk asset discussed.
Please note further that this technical-analysis viewpoint is short-term in nature. This is not a trade recommendation but a technical-analysis overview and commentary with levels to watch for the near term. This technical-analysis viewpoint could change at a moment's notice should price move beyond a level of invalidation. Further, proper risk-management techniques are vital to trading success. And countertrend or mean-reversion trading, e.g., trading a rally in a bear market, is lower probability and is tricky and challenging even for the most experienced traders.
DISCLAIMER: This post contains commentary published solely for educational and informational purposes. This post's content (and any content available through links in this post) and its views do not constitute financial advice or an investment or trading recommendation, and they do not account for readers' personal financial circumstances, or their investing or trading objectives, time frame, and risk tolerance. Readers should perform their own due diligence, and consult a qualified financial adviser or other investment / financial professional before entering any trade, investment or other transaction.

AMD Stuck in a Severe DowntrendPrimary Chart: Linear Regression Channel and Two Long-Term Anchored VWAPs
No matter what method is used to analyze and define the trend, AMD has been stuck in a severe downtrend since its all-time high on November 30, 2021. Like other growth and technology stocks (except for FAANG stocks and Microsoft), AMD's November 2021 peak occurred a month before the S&P 500 ( SP:SPX ) topped on January 4, 2021.
The linear regression channel, set a two-standard deviations from the linear regression line, evidences the downtrend as of today, October 6, 2022. Price is hovering just under the linear regression channel's midline, which is the linear regression "line of best fit."
Two anchored VWAPs also confirm the validity of the downtrend as well. The first anchored VWAP is anchored to the all-time high in November 2021. That VWAP is well overhead at $102.38 as of today, and it slopes downward. Note how it has been resistance at major swing highs after sharp bear rallies over the past year. The second anchored VWAP is anchored to the pandemic-crash lows in March 2020. That VWAP also lies well overhead at $92.16 as of today. These VWAPs show that sellers remain in control despite the impressive bear rallies that have repeatedly occurred since the all-time high.
Until the structure changes materially, and that could take a fair amount of time to unfold, the downtrend remains in effect. Bounces should be sold at proper resistance levels preferably with confirmation that price has begun to reverse back lower in the short term.
If readers are interested, SquishTrade may post a shorter-term view that includes key resistance levels where the current bear rally may find strong resistance. These levels could be watched for reversals where price in the short-term rejoins the larger-degree downtrend.
________________________________________
Author's Comments:
(1) Thank you for reviewing this post and considering its charts and analysis. The author welcomes comments, discussion and debate in the comment section. Shared charts are especially helpful to support any opposing or alternative view.
(2) This technical-analysis view does not constitute a trade recommendation or trade setup. Instead, it attempts to offer technical commentary that describes and analyzes price levels, trends, price action, or the broader technical environment as of the publication date. Technical-analysis commentary does not equate to trade setups or recommendations. Within a given price environment, traders bear responsibility for their own trading strategy, risk tolerance, and time frame, and for any due diligence associated with such trades.
(3) This technical-analysis viewpoint could change at a moment's notice, e.g., when price violates a key level of invalidation for a particular view. Further, proper risk-management techniques are vital to trading success.
(4) To the extent countertrend price moves are discussed, consider that countertrend or mean-reversion trading, e.g., trading a rally in a bear market, remains higher risk and lower probability even for the most experienced traders and investors.
DISCLAIMER: This post contains commentary published solely for educational and informational purposes. This post's content (and any content available through links in this post) and its views do not constitute financial advice or an investment or trading recommendation, and they do not account for readers' personal financial circumstances, or their investing or trading objectives, time frame, and risk tolerance. Readers should perform their own due diligence, and consult a qualified / licensed financial adviser or other financial or investment professional before entering any trade, investment or other transaction.
