LINEAUSDT Forming Bullish WaveLINEAUSDT is showing a strong bullish wave pattern that signals momentum is building for a potential breakout move. The structure reflects sustained accumulation, supported by good trading volume, which highlights that investors are actively positioning themselves. With this technical setup, the pair is projected to aim for gains around 90% to 100%+, making it an attractive candidate for traders looking for high-reward opportunities.
The bullish wave formation often acts as a continuation of upward momentum, and LINEAUSDT appears to be respecting this setup well. The price action has been consolidating in a healthy manner, creating a strong base that could fuel a sharp rally once resistance levels are cleared. This type of accumulation phase typically precedes impulsive moves, giving traders confidence in the medium-term outlook.
Investor interest is also on the rise, as seen from both volume participation and the consistency of market support. If momentum continues to build, LINEAUSDT could quickly establish itself as one of the notable performers in the current cycle. The alignment of technical structure, volume, and sentiment positions this pair favorably for the coming sessions.
✅ Show your support by hitting the like button and
✅ Leaving a comment below! (What is You opinion about this Coin)
Your feedback and engagement keep me inspired to share more insightful market analysis with you!
LINEAUSDT
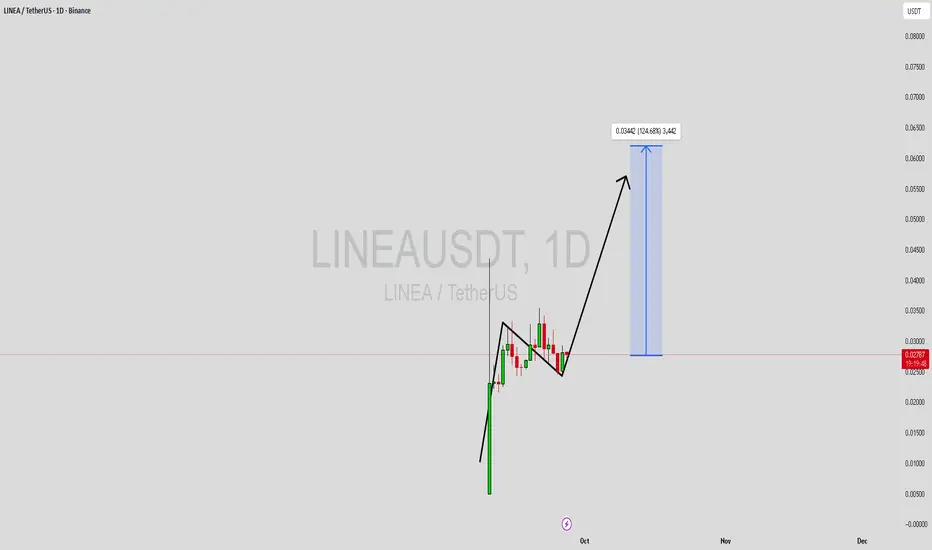
LINEAUSDT Forming Bullish WaveLINEAUSDT is currently shaping a bullish wave pattern, a strong indicator that the market could be preparing for a significant upward rally. This pattern highlights the continuation of buyer dominance and signals the possibility of sustained price growth. With an expected gain projection of 90% to 100%+, this setup is catching the attention of traders looking for high-potential opportunities in the altcoin market.
The trading volume remains solid, which is a positive factor confirming the validity of this bullish setup. Healthy volume indicates strong investor participation and liquidity, both of which are crucial for a breakout to sustain momentum. When coupled with a bullish wave pattern, these signals make LINEAUSDT an attractive option for those seeking mid- to long-term gains.
Investor interest in this project is on the rise, further strengthening the bullish outlook. Growing engagement from traders and institutions alike could fuel even more demand and create conditions for accelerated price action. As the wave pattern continues to develop, this pair is positioned well for a breakout phase that could deliver substantial returns.
✅ Show your support by hitting the like button and
✅ Leaving a comment below! (What is You opinion about this Coin)
Your feedback and engagement keep me inspired to share more insightful market analysis with you!

LINEAUSDT: Inverse H&S Breakout!LINEAUSDT is showing a strong Inverse Head & Shoulders pattern on the 4H timeframe, signaling a potential bullish reversal after weeks of consolidation. Price has now broken above the neckline, opening the door for a continuation move to the upside.
Key Points:
- Clear Inverse H&S with Left Shoulder – Head – Right Shoulder.
- Neckline breakout confirmed with bullish momentum.
- Volume profile shows heavy support around 0.029 – 0.030 zone.
Trade Setup:
- Entry Zone: Above neckline breakout (~0.033–0.034).
- Target Zone: $0.055
- Stop-Loss: Below 0.0265
Cheers
Hexa

LINEAUSDT.P – Possible Push Down IncomingIt looks like everyone’s long on almost every coin right now, which makes me think a retracement could be on the way this weekend.
On the chart, LINEAUSDT.P is forming a triangle pattern that might soon break to the downside. The higher timeframe bias is also bearish, which lines up nicely with this setup.
If the pattern plays out, we could see another move lower. Let’s see how the market reacts — this could get interesting!

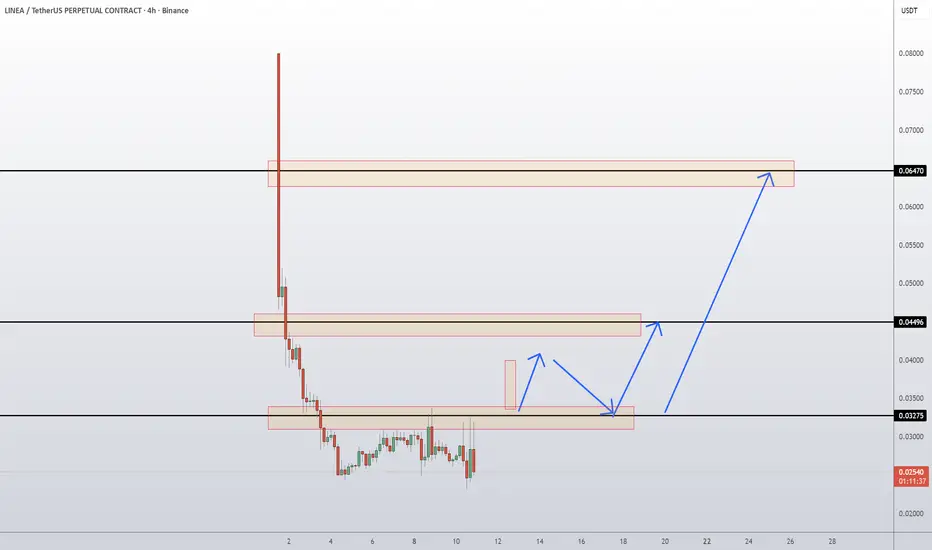
Linea Coin Token Prediction and Technical AnalysisLINEA/USDT remains under heavy selling pressure after its sharp launch spike, but price is now consolidating in a narrow range just below the 0.0327 resistance. The chart shows possible accumulation, with buyers looking to defend this base for a potential recovery. If price reclaims 0.0327, a push toward the next key resistance at 0.0449 could unfold. Sustained strength above that level opens the door toward 0.0647 major resistance. On the downside, repeated failure to hold above 0.0327 risks dragging price back into weakness.
📈 Key Levels:
Buy trigger: Reclaim and hold above 0.0327 support
Buy zone: 0.0327 – 0.0350 region
Target 1: 0.0449 resistance
Target 2: 0.0647 resistance
Invalidation: Daily close below 0.0250 (would extend bearish pressure)
👉 Follow me for More Real Time Opportunities.
Share your Thoughts if you have any?