ChainLink at POI... Watch list material. LINK remains in a clear downtrend on the daily timeframe with consistent lower highs and lower lows.
Price is currently testing a major historical demand zone. This is a key reaction area for bulls. So far, selloffs have come with strong participation, while momentum is attempting a short-term bounce from oversold conditions.
If this level holds, we could see a relief rally into prior supply. If it fails, downside continuation remains likely.
For now, trend is still bearish on the higher timeframe. Let price confirm before getting aggressive.
LINK

#LINK Just Broke Down – And This Move Can Get Ugly FastYello Paradisers! Are you really watching #LINKUSDT closely right now, or are you still pretending nothing serious has happened, even though the market has already made its decision? Let's view #ChainLink setup:
💎#LINK has already confirmed a bearish breakdown from the symmetrical triangle structure. Price lost the ascending support decisively and is now trading around $8.54, below the key structure that had been holding the market together. This breakdown did not happen randomly – it followed multiple weak attempts to push through the descending resistance, clearly showing exhaustion on the bullish side.
💎The structure was very clean: descending resistance + ascending support, and as always, once support gave way, sellers stepped in aggressively. The former support is now acting as resistance for #LINKUSD, which increases the probability that this move is not just a fake-out but a continuation to the downside.
💎With the breakdown already confirmed, the $8.00 demand zone is now under serious pressure. If price fails to reclaim it quickly, the next high-probability downside target becomes the key support around $7.15, where stronger buyers may finally attempt to slow the move. This level is critical and aligns with previous demand and liquidity resting below.
💎This bearish scenario is only invalidated if #LINK reclaims and holds above the resistance zone at $9.28. A clean acceptance above that level would trap late shorts and flip the structure back to bullish, opening the door for a recovery move. Until then, rallies should be treated as corrective and risky.
Trade smart, Paradisers. This setup will reward only the disciplined.
MyCryptoParadise
iFeel the success🌴

LINK - LONG - The Market Is Setting a Trap$CHAINLINK
Sometimes the market does not whisper.
It speaks clearly.
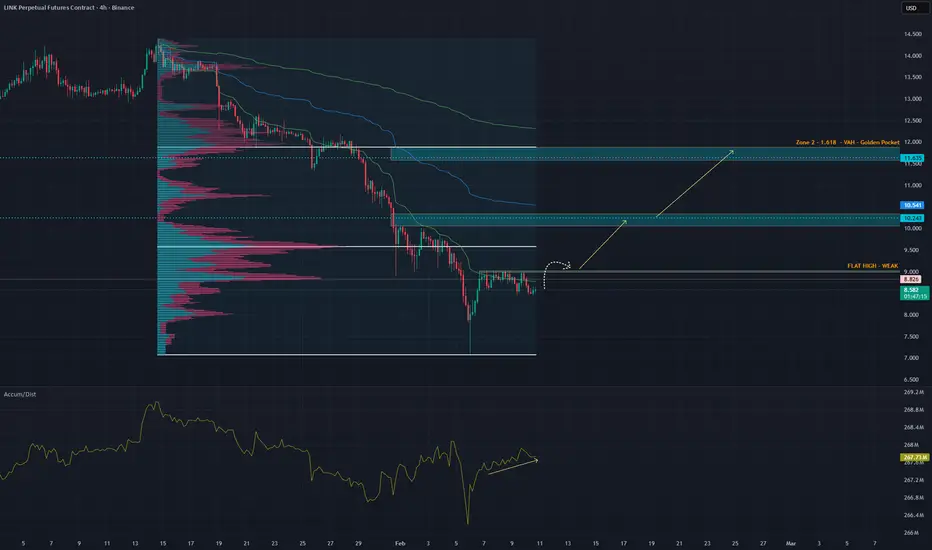
Both stablecoin-margined and coin-margined futures CVD are bleeding. Sellers are active across derivatives, yet price is barely moving. That tells you everything you need to know. Supply is being absorbed.
Today we saw a sharp increase in fresh leverage, and it is overwhelmingly shorts. Net shorts are up almost 4x since yesterday, but price refuses to break down. If this market wanted lower, it would already be there.
On the 4H Binance Perps, momentum is rolling over while price holds structure. A clean hidden bearish divergence, but with no downside follow-through. That is positioning fighting price, not price confirming positioning.
Now add the Accumulation / Distribution read.
After the downside sweep, A/D turns up and keeps rising while price consolidates. That means supply is being absorbed quietly. This is not distribution into strength. This is accumulation into fear. Smart money is active while volatility compresses.
Look at open interest.
OI is rising while price goes sideways. New positions are entering, not exits. Combine that with negative CVD and you get one thing. Aggressive short positioning into a market that is not accepting lower prices.
Now zoom out and look at the liquidation heatmap.
There are clear liquidation clusters stacked above current price. That is where short liquidations live. Liquidity does not block price. It pulls it.
Markets do not move because of opinions.
They move to resolve imbalance.
When shorts pile in, CVD bleeds, OI builds, and price refuses to break down, the path of least resistance often flips hard and fast. Those clusters are not resistance.
They are objectives.
This is not prediction.
This is structure, positioning, and liquidity aligning.
For me, this is an A++ asymmetric setup. Risk is clearly defined. Upside is driven by forced participation.
Targets:
10.20
11.50
Price does not care who is right.
It cares who is trapped.
LINKUSDTPrice has reached the bottom of the wedge, and now it’s time for it to move toward the top of the wedge. This move could take several months to complete.

ChainLink Breaks Down: Hold Here or Drop to $6?Chainlink has broken below its previous 3 month support and is now trading within a new 3 month range, which can also be seen in the prior linked charts.
There are two main scenarios to be aware of. At current levels, LINK needs to hold this new 3 month support range to set up the next volatility expansion. As of now, that move is projected toward the end of March (highlighted).
If this 3 month support fails, price could rotate lower into the $6.00–$5.50 zone. That would likely extend the accumulation phase and push the apex out by roughly another month, toward April.
Excited to see how this develops. I remain a strong believer in LINK and its positioning within real world asset tokenization.

Chainlink: bounce or break? key levels to watch aheadChainlink. Who’s trying to catch this falling knife and actually grab the handle? After the latest risk‑off wave in crypto, LINK got hammered as traders rotated out of DeFi names, and according to market chatter funding flipped heavily negative and sentiment went full doom mode.
On the 4H chart we’re in a clean downtrend, but the last leg looks like a selling climax: long lower wick, big volume, RSI stuck in oversold around 25. Price is sitting below a fat volume node around 8.8–9.0 that used to be support and now looks like the first serious supply zone. So my base case is a relief bounce into that 8.8–9.5 pocket before bears decide what’s next.
✅ Plan: I’m only interested in a counter‑trend long if price holds above 8.0 and starts building a small base, with targets 8.8 then 9.5. ⚠️ If 8.0 gives way on strong volume, I expect a slide toward 7.2–7.0 where the next demand cluster sits. I might be wrong, but shorting straight into an exhausted dump has rarely been a profitable hobby for me.

#LINK Crash Incoming? Why strong support always Weak...
Yello Paradisers! Did you catch the early signs of this breakdown, or are you still stuck in the trap? As we warned in our previous market commentaries, #LINKUSDT was setting up for a deeper move — and now the chart is confirming that view.
💎After a clean rejection from the trendline resistance, #LINK has decisively broken below a key structural support, confirming a shift in market sentiment. This wasn’t just a random bounce or a short-term wick — the break below structure was accompanied by clear momentum loss on the higher timeframes, which increases the probability of a sustained leg lower. The trendline rejection aligns perfectly with the broader structure, and we’re now seeing continuation as price respects the bearish market geometry.
💎What makes this setup even more compelling is the presence of hidden bearish divergence on the RSI as price retested resistance. This is a technical sign of strength in the prevailing downtrend — price was making lower highs, but RSI was printing higher highs. That kind of signal often goes unnoticed by retail traders but is a critical continuation indicator for experienced analysts. It confirmed that bears were in control and buyers were lacking conviction on the retests.
💎Moreover, the broken support level had been tested three times prior to the breakdown, and many retail traders fell into the trap of interpreting that as strength. But as we’ve mentioned many times in our updates, repeated testing of a level weakens it, not strengthens it. What we saw here was a classic liquidity trap — smart money absorbed retail demand at support, engineered a false sense of safety, and then triggered a breakdown to the downside once enough positions were lured in. It’s a strategy often used to generate liquidity before the real move begins.
💎Now that structure has shifted, the technical landscape becomes clearer. The RSI is currently holding below the 40 level — a zone typically associated with strong bearish control. Until we see a sustained reclaim of that range or a divergence forming closer to oversold levels, there is no reason to assume momentum has faded. The trend remains firmly to the downside.
💎Looking at key levels, the next major support comes in around the $8 region. This zone is significant both psychologically and structurally — a breakdown into that area would align with prior consolidation ranges and potentially trigger more long liquidations. On the upside, the $15 level now acts as strong resistance. Unless that level is reclaimed with conviction, all rallies should be viewed as potential selling opportunities within a broader bearish context.
As always, we’re not here to gamble or chase noise. The structure is breaking down, and our job is to stay on the right side of probability. That is why we are playing it safe right now. If you want to be consistently profitable, you need to be extremely patient and always wait only for the best, highest probability trading opportunities. This is the only way how you can get inside the winner circle. Stay sharp, Paradisers — and let the rest chase shadows.
MyCryptoParadise
iFeel the success🌴

LINK – Retracement into Key Support | Long Spot SetupChainlink has retraced into a major support zone, offering a potential opportunity for a long spot position. This area ($8.50–$9.50) has held well in the past and could act as a base for the next leg up, especially if broader market sentiment improves.
🛠 Strategy Setup:
Entry (Ladder In): $8.50 – $9.50
Take Profit Targets:
TP1: $11.00 – $12.00
TP2: $13.00 – $14.00
Stop Loss: Below $8.00 (to manage downside risk)
The idea here is to accumulate gradually (laddering) within the support zone, not all at once. This helps manage timing risk and smooths out entry price. If bulls return, we could see a push toward key resistance clusters around $11–$14.

#LINK/USDT#LINK
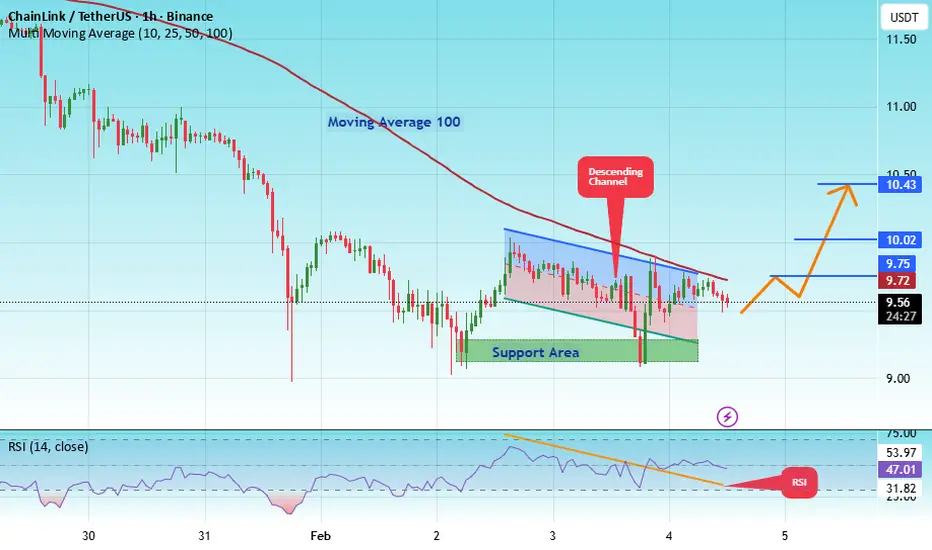
The price is moving within a descending channel on the hourly timeframe. It has reached the lower boundary and is heading towards a breakout, with a retest of the upper boundary expected.
The Relative Strength Index (RSI) is showing a downward trend, approaching the lower boundary, and an upward bounce is anticipated.
There is a key support zone in green at 9.18, and the price has bounced from this level several times. Another bounce is expected.
The indicator is showing a trend towards consolidation above the 100-period moving average, which we are approaching, supporting the upward move.
Entry Price: 9.55
First Target: 9.72
Second Target: 10.02
Third Target: 10.43
Stop Loss: Below the green support zone.
Remember this simple thing: Money management.
For any questions, please leave a comment.
Thank you.
LINK to 3 dollars -- Last exit before the elevator down.Chainlink is flashing a head and shoulders.
It is looking to break the previous bear market lows.
And there are fib retracement confluence projections that align with single digit prices.

LINK Break & Retest SetupWe're closely watching Chainlink (LINK) as it approaches the critical $12.00 resistance zone. This level has capped price action multiple times, and a confirmed breakout with a successful retest could signal the start of a fresh bullish leg.
📈 Trade Plan
We'll be entering a long spot position on the break and retest of $12.00. Patience is key—confirmation is everything in this kind of setup.
🎯 Targets:
• TP1: $13.00 – $14.50
• TP2: $16.00 – $17.00
🔻 Stop Loss: Just below $11.35
This setup aligns with classic breakout-retest price action and will be monitored closely over the coming sessions.

#LINK/USDT – Triangle Pattern Breakout Loading?#LINK
The price is moving within a descending channel on the hourly timeframe. It has reached the lower boundary and is heading towards a breakout, with a retest of the upper boundary expected.
The Relative Strength Index (RSI) is showing a downward trend, approaching the lower boundary, and an upward bounce is anticipated.
There is a key support zone in green at 11.75, and the price has bounced from this level several times. Another bounce is expected.
The indicator is showing a trend towards consolidation above the 100-period moving average, which we are approaching, supporting the upward move.
Entry Price: 11.95
First Target: 12.10
Second Target: 12.38
Third Target: 12.69
Stop Loss: Below the green support zone.
Remember this simple thing: Money management.
For any questions, please leave a comment.
Thank you.

Chainlink (LINK) – Spot Long Setup DevelopingWe're watching LINK closely as it approaches a key support zone that could act as a springboard for a reversal on the higher time frames. A pullback into this area may offer a high-risk/reward long entry, especially if bullish structure begins to form again.
🔹 Entry Zone: $12.50 – $13.50
🔹 Take Profit 1: $15.50 – $16.50
🔹 Take Profit 2: $19.00 – $21.00
🔹 Stop Loss: Weekly close below $12.00
This setup relies on price respecting the major support level. If we see a weekly candle close below $12, that would invalidate the idea and call for reassessment. Until then, it's a technical setup worth tracking for patient spot traders.

Chainlink (LINK) Price Eyes a Push Toward the Top of Its Channel* The Chainlink price is trading inside a tight channel, with momentum slowly starting to pick up.
* On-chain data indicates steady, real network usage rather than short-term speculation.
* LINK is approaching the top of its channel, a level that could shape the next move.
If you step back and look at what Chainlink has been doing lately, one thing stands out right away: nothing feels rushed. There’s no panic, no aggressive selling, and no breakout mania either. LINK is just moving sideways inside a tight range, and that kind of price action tends to make people tune out because it feels boring.
For a while now, the LINK price has been slowly compressing inside its channel. Every bounce runs into resistance, and every dip finds buyers waiting. It’s the kind of market that feels awkward to trade because nothing follows through. Momentum traders lose interest, and the broader narrative around LINK goes quiet.
That’s exactly why this phase is important. LINK isn’t falling apart. Buyers are clearly defending the $12–$13 area, and sellers haven’t managed to push the price meaningfully lower. At the same time, buyers aren’t quite strong enough yet to break through the top of the channel. The market is paused, not weak.
This setup is nothing new for Chainlink. In past cycles, similar low-volatility stretches showed up near the end of long consolidation periods. Volume dried up, momentum flattened, and the price went nowhere long enough for most people to stop watching. When that happened, LINK often moved once expectations were low and positioning had thinned out.
On-chain data backs this up. Market cap has been creeping higher, active addresses are still rising, and transfer activity looks steady. That points to ongoing network use and gradual positioning, not speculation or large-scale selling.
So what comes next for LINK?
At this point, structure matters more than hype. As long as the LINK price holds its support zone and continues tightening beneath resistance, the setup stays intact. A move toward $14.63 with stronger volume would start putting real pressure on sellers.
Right now, LINK isn’t grabbing headlines. Price is grinding, volatility is low, and excitement is missing. But those quiet phases are often when things start to shift, especially for an asset that tends to move once the market stops paying attention.

LINK/USDT 1W Chart Long-Term📌 PRICE STRUCTURE
Long-term trend: still up, confirmed by the ascending trendline (orange).
The price respects the trendline – each dip below was bought.
We are now in the midst of a strong upward impulse correction (peak ~$26–27).
🟢 KEY LEVELS
Support
$13.7–14.7 → current demand zone/consolidation
$11.63 → strong HTF support (low of previous reactions)
$7.84 → worst-case scenario (only in the event of a market breakdown)
Resistance
$18.85 → key HTF resistance (mid-range)
$22–24 → supply zone after the last impulse
$26–30 → ATH range/supply zone
📈 PRICE ACTION
Price is consolidating above the trendline → this is bullish behavior
No downward impulse – more likely accumulation
Candles with long downward wicks = supply absorption
➡️ This doesn't look like distribution, but rather a base for a move.
📊 INDICATORS
Stochastic RSI
Was in the oversold zone
Starting to curve upwards → potential buy signal (HTF)
CHOP
Falls to around 40
This indicates the end of consolidation and preparation for a trend
Perfect for an upside breakout in the coming weeks
🔮 SCENARIOS
🟢 BASELINE SCENARIO (most likely)
Sustaining $13.7–14.7
Breakout $18.85
Targets:
$22–24
Next $26–28
📌 Typical range → weekly breakout.
🔴 NEGATIVE SCENARIO
Weekly close below $11.63
Trendline negated
Decline to:
$9–$8
Strong long-term accumulation zone there

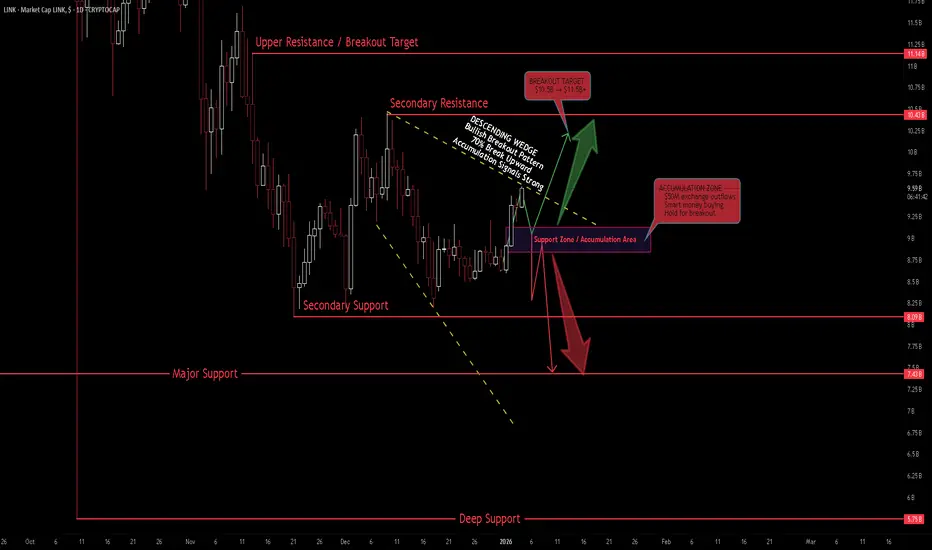
LINK Market Cap - Descending Wedge at $9.25B | Bullish Breakout Executive Summary
Chainlink (LINK) market cap trading at $9.25B within a descending wedge on the 1D timeframe. Price holding key support while forming bullish structure. Strong accumulation signals with $50M in exchange outflows from Binance. Expecting bullish breakout past the highs as selling pressure fades and smart money accumulates.
BIAS: BULLISH - Breakout Structure Forming
Current Market Context
LINK broke 21-day MA - altcoins looking for "upward run" in next 2-3 months
$50M in exchange outflows from Binance (accumulation signal)
Holding 200-day MA and long-term trendline support
Grayscale highlights LINK's role in tokenization
Top DeFi project by development activity
Cleaner setup than Hyperliquid heading into 2026
Fundamental Strength
Strong connections with policymakers and financial institutions
Founder met with US lawmakers, Federal Reserve, key political figures
Key player in compliant crypto projects
Leading role in tokenizing real-world assets (RWA)
Ranked top DeFi project by GitHub development activity
Positioned well for regulatory clarity in 2026
Technical Structure - 1D
Descending Wedge Pattern:
Falling resistance and support trendlines (yellow dashed)
Wedge narrowing - compression before breakout
Typically bullish reversal (70% break up)
Price holding support zone
Key Levels (Market Cap):
Resistance:
$9.5B - Immediate resistance
$10.5B - Secondary resistance (red line)
$11.5B - Upper resistance / breakout target
Support:
$9.0B - $9.25B - Current support zone (purple)
$8.0B - Secondary support (red line)
$7.4B - Major support (red line)
$5.7B - Deep support (red line at bottom)
SCENARIO ANALYSIS
BULLISH (Primary): Wedge Breakout
Break above descending wedge resistance
Target $10.5B, then $11.5B+
Accumulation signals support breakout
Altcoin season catalyst
BEARISH: Wedge Breakdown
If support at $9.0B fails
Drop to $8.0B, then $7.4B
Invalidates bullish thesis
My Assessment
Descending wedge with strong accumulation signals. $50M exchange outflows = smart money buying. Holding long-term support while selling pressure fades. Bullish structure forming for breakout past the highs. LINK positioned well for 2026 with regulatory clarity and RWA tokenization narrative.
Strategy:
Long on wedge breakout confirmation
Target $10.5B, then $11.5B+
Stop below $8.0B support
Accumulate at $9.0B-$9.25B support zone
Let me know what you think in the comments below for the next move!
Yesterday vs today on $LINK viewYesterday vs today on CRYPTOCAP:LINK view 🔥
My charts are just too powerfull 🔮
14.5$ is programmed? 📈

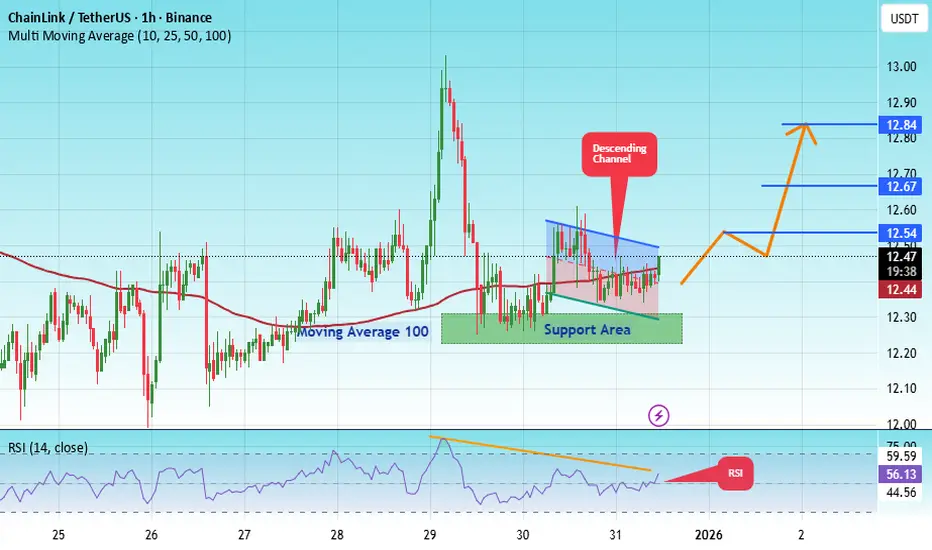
#LINK/USDT in upward mood !#LINK
The price is moving in a descending channel on the 1-hour timeframe. It has reached the lower boundary and is heading towards breaking above it, with a retest of the upper boundary expected.
We have a downtrend on the RSI indicator, which has reached near the lower boundary, and an upward rebound is expected.
There is a key support zone in green at 12.26. The price has bounced from this zone multiple times and is expected to bounce again.
We have a trend towards stability above the 100-period moving average, as we are moving close to it, which supports the upward movement.
Entry price: 12.43
First target: 12.67
Second target: 12.54
Third target: 12.47
Stop loss: Below the support zone in green.
Don't forget a simple thing: capital management.
For inquiries, please leave a comment.
Thank you.

LINK/USDT — Descending Trendline Test: Break or Rejection?LINK/USDT on the 12H timeframe is still moving within a medium-term bearish structure, but price is currently testing a major descending trendline resistance that has capped upside movement since the previous highs. This places LINK in a critical decision zone.
---
📐 Pattern & Price Structure
Primary Pattern: Descending Trendline (Bearish Structure)
Price has been forming consistent lower highs and lower lows.
Price is now approaching a dynamic resistance (yellow trendline), which has:
Acted as strong resistance for months
Become a key validation level for either continuation or reversal
Additionally, price is consolidating in a tight accumulation range below the trendline, often a precursor to a strong breakout or breakdown.
---
🧱 Key Levels
Resistance:
13.55 – 14.70 → Minor resistance / supply zone
16.50 → Next structural resistance
18.50 – 19.90 → Extended bullish targets after a confirmed breakout
23.40 → Major resistance / previous distribution area
Support:
12.40 – 12.00 → Nearest support & demand zone
11.70 → Critical support (bullish invalidation)
11.10 → Extreme support / last defense
---
🟢 Bullish Scenario
Price breaks and closes decisively above the descending trendline on the 12H timeframe.
Ideal confirmation includes:
Strong candle body
Trendline retest holding as support
Potential upside targets:
14.70 → 16.50
Extension toward 18.50 – 19.90
A valid breakout would:
End the lower-high structure
Signal a medium-term trend reversal or bullish continuation
---
🔴 Bearish Scenario
Price fails to break the trendline and prints a clear rejection (long upper wick / bearish engulfing).
A breakdown below the current range opens downside potential toward:
12.00 retest
Extension to 11.70 – 11.10
As long as price remains below the descending trendline, the primary bias stays bearish / corrective.
---
🧠 Conclusion
LINK/USDT is trading at one of the most important technical zones in recent months.
Price reaction at the descending trendline will define the next major move:
Breakout → structure shift & bullish opportunity
Rejection → continuation of the downtrend
Patience and confirmation are key to avoiding false breakouts in this area.
---
#LINK #LINKUSDT #Chainlink #CryptoAnalysis #TechnicalAnalysis #Altcoins #Downtrend #Trendline #Breakout #CryptoTrading

#LINK/USDT – Triangle Pattern Breakout Loading?#LINK
The price is moving in a descending channel on the 1-hour timeframe. It has reached the lower boundary and is heading towards breaking above it, with a retest of the upper boundary expected.
We have a downtrend on the RSI indicator, which has reached near the lower boundary, and an upward rebound is expected.
There is a key support zone in green at 12.26. The price has bounced from this zone multiple times and is expected to bounce again.
We have a trend towards stability above the 100-period moving average, as we are moving close to it, which supports the upward movement.
Entry price: 12.43
First target: 12.67
Second target: 12.54
Third target: 12.47
Stop loss: Below the support zone in green.
Don't forget a simple thing: capital management.
For inquiries, please leave a comment.
Thank you.
#LINK/USDT – Triangle Pattern Breakout Loading?#LINK
The price is moving in a descending channel on the 1-hour timeframe. It has reached the lower boundary and is heading towards breaking above it, with a retest of the upper boundary expected.
We have a downtrend on the RSI indicator, which has reached near the lower boundary, and an upward rebound is expected.
There is a key support zone in green at 12.00. The price has bounced from this level multiple times and is expected to bounce again.
We have a trend towards consolidation above the 100-period moving average, as we are moving close to it, which supports the upward movement.
Entry price: 12.21
First target: 12.38
Second target: 12.62
Third target: 12.93
Don't forget a simple principle: money management.
Place your stop-loss below the support zone in green.
For any questions, please leave a comment.
Thank you.

Link USD LONG IDEA. (BULLISH ORDER FLOW)Market Structure Context
Overall structure remains bullish (higher highs & higher lows).
Recent downside move is corrective, not impulsive.
No bearish break of structure on the higher timeframe → trend intact.
Key Zones (Institutional Interest)
Bullish Order Block at the origin of the last impulsive up-move.
⚠️ Disclaimer
This setup assumes normal market conditions.
Avoid trading during major news releases.
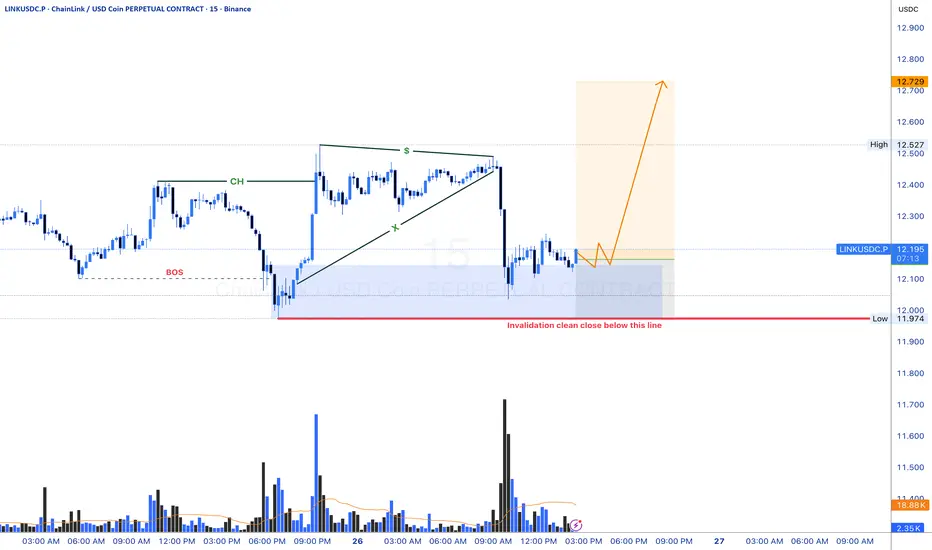
LINK: The Spring is About to BreakWe're sitting at the apex of a textbook converging wedge with just $0.07 of room left. 20 touches on ascending support ($12.19), 13 touches on descending resistance ($12.26), and price currently at $12.30. The coiled spring scenario is here—something gives within the next few bars.
1. THE TECHNICAL REALITY 📉
• Wedge compression: Width contracted from $14.62 to $0.07 over 467 bars—apex reached
• Macro structure: Price below EMA50 ($12.42) and EMA200 ($13.22)—bearish trend intact
• Current position: Testing middle Bollinger Band ($12.27), just above EMA20 ($12.29)
• ADX at 41.3: Strong trending environment confirmed
2. THE INDICATORS ⚖️
Bearish Signals:
• Bearish order block overhead at $12.31-$12.52 acting as supply
• Volume 63% below average ($622K vs $1.66M)—weak conviction on bounce
• Swing trend bearish despite trading in discount zone
• Upper wick 29.3% showing rejection at resistance
Bullish Signals:
• MACD bullish crossover (MACD -0.0311 above Signal -0.0451)
• Lower wick 59.8% showing strong support attempts
• Bullish order block below at $12.21-$12.63 providing demand
• RSI neutral at 54.4, MFI at 67.3 (elevated but not extreme)
The Conflict:
MACD suggests momentum shift, but volume tells the opposite story. Without conviction behind this bounce, the 59.8% lower wick represents indecision rather than strength. Structure trumps oscillators here.
3. THE TRADE SETUP 🎯
🔴 Scenario A: Wedge Breakdown (Higher Probability - 68%)
• Trigger: 4H close below $12.21 (bullish OB support break)
• Entry: Confirmation below $12.21 with volume
• Target: $11.73 (weak low liquidity sweep, 4.70% distance)
• Stop: 4H close above $12.52
Logic: Price rejects at $12.52 bearish OB (aligns with descending resistance), breaks 20-touch ascending support at $12.19, sweeps equal lows at $11.73 where unprotected buy-side liquidity sits. Converging wedges typically break in direction of prior trend—which is down.
🟢 Scenario B: Breakout Reversal
• Trigger: Decisive break above $12.52 with volume
• Entry: 4H close above $12.52 (breaks bearish OB + descending resistance)
• Target: $14.19 (premium zone threshold, triggers CHoCH bullish)
• Invalidation: Rejection back below $12.52
Logic: Reclaiming $14.19 invalidates entire bearish structure and signals bulls have control. Given positioning below EMA50/200 and bearish swing trend, assigning lower probability to this outcome.
MY VERDICT
Risk-reward favors the breakdown. The 20-touch ascending support at $12.19 breaking on volume would be a significant technical event that accelerates selling. Wait for confirmation rather than front-running—the wedge apex doesn't care about your bias, it breaks based on order flow.
