LINK Daily: Short-Term Rejection, Long-Term StrengthLINK Daily – Watching the Retrace
LINK on the daily just got rejected from the 50MA, confirming it as short-term resistance.
The next key support sits around the 0.618 Fibonacci level, which also marks the origin of the last bounce that was rejected at the 50MA.
From a system perspective, the current structure reads:
Price < BB Center (orange) < SMA < MLR10 — indicating a short-term downtrend.
However, on the long-term view, price remains above the 200MA, meaning the broader uptrend is still intact.
At this stage, LINK needs a daily close above the BB Center to regain short-term momentum and open the path for recovery.
With Q4 underway and the narrative in the US shifting in favor of crypto, LINK could soon find conditions for continuation once the local structure stabilizes.
Bias:
Neutral-bullish: short-term pressure within a long-term bullish structure.
Always take profits and manage risk.
Interaction is welcome.
LINK

LINK Update📊 LINK Update
LINK has formed a bullish double bottom pattern and successfully reached the first target ✅
Now we’re waiting for the second target at the green line level 🚀

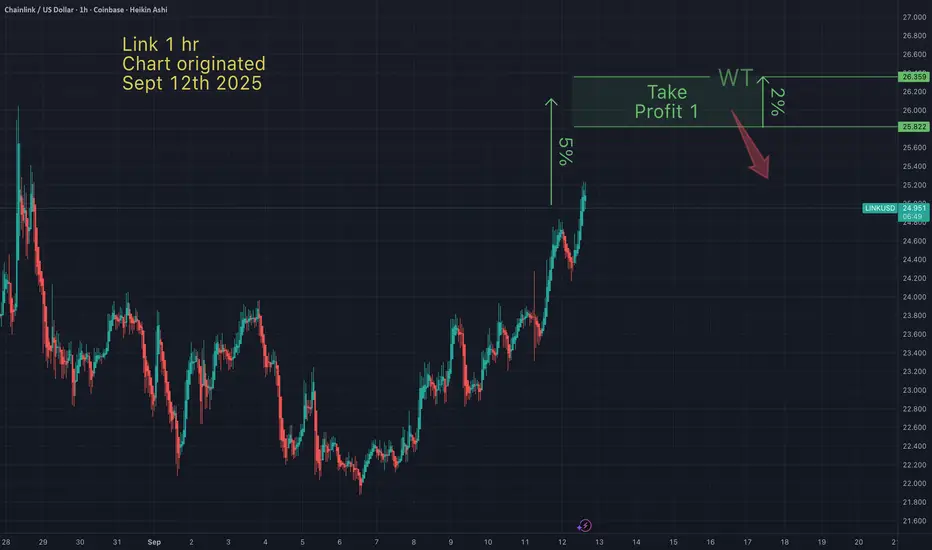
LINK 1H – Sitting on a Cluster of SupportLINK 1H – Sitting on a Cluster of Support
LINK on the 1H looks quite similar to ETH, but with one key difference: the 200MA is much closer.
Price is now testing a tight cluster of support, where multiple technical factors align. If this area holds, LINK could rebound with strength.
However, if it breaks down, the 0.618 Fib sits below as the next potential shelter for price.
The next few candles will likely decide if bulls can defend this zone or if another leg lower is needed.
Key notes:
200MA nearby, acting as dynamic support
Local cluster of support being tested
0.618 Fib as next confluence level
Short-term structure mirrors ETH
Bias:
Neutral-bullish — holding this zone keeps the uptrend intact, but losing it could invite deeper retracement.
Always take profits and manage risk.
Interaction is welcome.

LINK Swing Long Idea - KZMT ModelLINK Swing Long Idea
📊 Market Sentiment
FED has resumed its rate-cutting cycle, starting with a 0.25% cut in September, with two more expected. Institutional liquidity inflows have accelerated as the U.S. officially adopts crypto as part of its reserves. Despite elevated inflation, a weakening labor market is forcing the FED to ease, pushing more capital into risk-on assets.
📈 Technical Analysis
Price is in a higher time frame (HTF) bullish trend, so I will only be looking for longs.
Price broke the HTF Key Zone and closed above, then retested and rejected from it — confirming the zone as demand.
Price also deviated and tapped back into the HTF bullish trendline, confirming trapped short-sellers and reinforcing bullish momentum.
📘 Model to be used – HTF Key Zone w/ HTF Manipulated Trendline (KZMT)
This model first identifies the HTF trend and only trades in that direction. Next, I locate key zones that support price. Finally, I look for a manipulated HTF trendline that aligns with those zones. When both confluences overlap, conviction for a strong bullish reaction increases.
📌 Game Plan
1)Price to revisit HTF Key Zone.
2)Retest of the HTF bullish trendline.
🎯 Setup Trigger
Limit entry at 22$
📋 Trade Management
Stoploss: Daily close below HTF Key Zone or hard stop at $19.5
Targets: TP1 = $25 | TP2 = $28
💬 Like, follow, and comment if this breakdown supports your trading! More setups and market insights coming soon — stay connected!
⚠️ Disclaimer: This content is for informational and educational purposes only and does not constitute financial, investment, or trading advice. Always DYOR before making any financial decisions.

LINK - PERFECT SETUPWizzard TA on BIST:LINK
21.90$ retest - Accuracy: 100%
TP4 if I posted :)
Let's go!

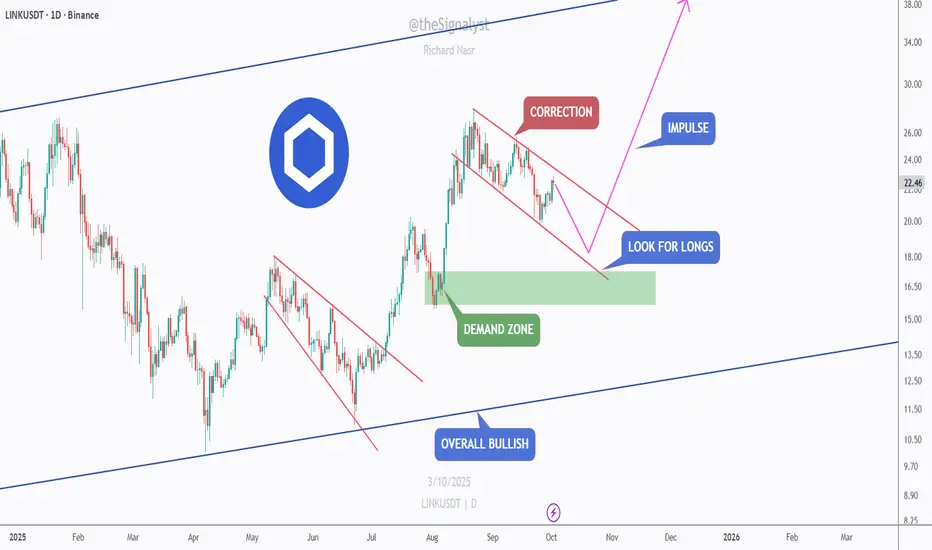
LINK — Bullish Structure, Corrective Dip into Demand!LINK remains overall bullish on the higher timeframe. Price is pulling back inside a descending channel (correction) after August’s impulse and is approaching a daily demand zone around $17–$18.5.
Scenarios:
Bullish 📈 Hold $17–$18.5 and/or break & close above $22.5–$23.5 → momentum toward $26, then $30+ if trend accelerates.
Bearish 📉 Daily close below $17 would weaken the structure and risk a deeper retrace before bulls try again.
Plan:
Look for confirmation at demand (higher low / bullish candle) or trade the break–retest above the channel for momentum entry.
⚠️ Disclaimer: This is not financial advice. Always do your own research and manage risk properly.
📚 Stick to your trading plan regarding entries, risk, and management.
Good luck! 🍀
All Strategies Are Good; If Managed Properly!
~Richard Nasr
LINKUSDT 12H1. Trend Structure
The price is in a descending channel (marked in orange) – the upper line acts as resistance, the lower line as support.
Currently, the price has rebounded from the lower boundary and is approaching the middle resistance levels.
2. Key Levels
Support:
21.73 USDT (the closest local support – already broken upwards, now being retested).
20.17 USDT (stronger support that previously halted the decline).
18.10 USDT (bottom of the channel – the main defense for the bulls).
Resistance:
23.22 USDT (local resistance, the price is very close to this level).
24.14 USDT (important horizontal resistance).
25.54 USDT (key level, a breakout of which could negate the descending channel).
3. Indicators (Stoch RSI)
The Stoch RSI is in the overbought zone (>80).
This suggests that upward momentum is slowly fading and a correction or consolidation near resistance levels (23–24 USDT) is possible.
4. Scenarios
Bullish:
If the price breaks and holds above 23.22 USDT, the next target will be 24.14 USDT, followed by 25.54 USDT (the upper boundary of the channel).
A break above 25.54 USDT could signal the end of the downward channel and a transition to a sideways/upward trend.
Bearish:
If the price rejects the 23.22 level and the Stoch RSI begins to decline, we could return to 21.73 USDT.
Losing this level will reopen the road towards 20.17 USDT and even test the lower limit of the channel (around 18-19 USDT).

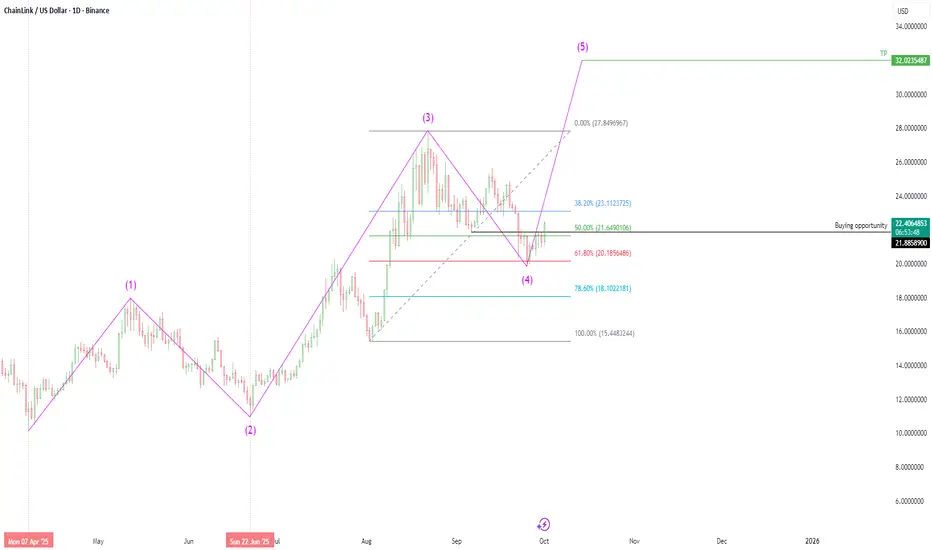
Chainlink (LINK/USD) - Elliott Wave AnalysisBased on Elliott Wave Theory, Chainlink (LINK/USD) appears to have successfully completed its corrective Wave 4, as evidenced by the recent stabilization and reversal patterns observed on the daily timeframe. This completion sets the stage for the anticipated impulsive Wave 5, which is now clearly visible on the daily chart. The structure suggests a continuation of the broader uptrend, with increased momentum likely to drive prices toward higher targets.
TradeCityPro | LINK Coin Testing Key Resistance👋 Welcome to TradeCity Pro!
In this analysis, I'll be reviewing the LINK coin. It’s one of the popular RWA crypto projects with a market cap of 14.56 billion dollars, ranked 13th on CoinMarketCap.
⏳ 1-Hour Timeframe
In the 1-hour timeframe, after a downward movement, this coin has formed a large range box with the upper boundary at $22 and the lower boundary at $20.02.
📊 Currently, after getting support at the lower boundary of the box, the price has moved upwards in two legs toward the $22 level and has now reached it.
🧩 The price has reacted to this level before, and it has significant strength. It can be viewed as a Maker Seller zone.
✨ We can confirm the bullish trend of LINK after breaking this level. Before breaking this level, opening a position is risky, and if we want to open a position, we need to pay close attention to risk and capital management.
✅ In the upward movement towards the top of the box, a divergence has formed in the RSI. We can confirm this divergence activation by breaking the 40.91 level in the RSI. For the price itself, we can confirm a bearish trend by stabilizing below 21.25.
📉 For a short scalp position, we can enter with the break of 21.25. But be cautious, as this position is very risky, and if you open it, make sure to take profit with low-risk-to-reward ratios because the market momentum is not fully in our favor, and the chance of volatile fluctuations is high.
🔔 For a long position, the best trigger is the breakout of the top of the box. If the price touches this level multiple times, we can find an accurate trigger for the breakout, and in subsequent touches, we can enter with the breakout.
📝 Final Thoughts
Stay calm, trade wisely, and let's capture the market's best opportunities!
This analysis reflects our opinions and is not financial advice.
Share your thoughts in the comments, and don’t forget to share this analysis with your friends! ❤️

LINK — Massive $20 Support Zone, Wave 5 Loading?I haven’t seen this much confluence stack in one place for LINK in a long time. The $20–$19 zone is absolutely packed with technical factors, making it a critical level to hold for bullish continuation.
🧩 Confluence at $20–$19
Golden Pocket: $20.19 (0.618) → $19.59 (0.666)
Yearly VWAP: $18.87
21 Weekly EMA/SMA: $19.68 / $18.39
Yearly Open: $20.02
0.666 Fib Speed Fan: aligned with $20 zone
1.0 Trend-Based Fib Extension: at $20 → completion of wave 4
Pitchfork Buy Zone: 0.702–0.75 levels right at $20
Midpoint of 1-Year Trading Range
Anchored VWAP (from $30.94 high, 287 days): $19.55
Daily Level: $19.66
Weekly Level: $19.28
Monthly Level: $19.27
Yearly Level: $19.51
🟢 Long Setup
We’ve already seen a bounce from $20, confirming demand at this zone.
Plan: Buy now and add on retracements if price dips back toward $20/$19.
Stop-Loss: Below 21 SMA weekly at $18.39
TP1 → $30 psychological resistance & prior key high
TP2 → $34.57 (0.618 Fib retracement)
This setup offers an R:R of 1:7+ with a possible yield of +70% if played toward TP2.
Structure Outlook
With this stacked confluence, it looks like wave 4 has completed and LINK could be ready for its next leg up. The $20 zone is make-or-break, and as long as it holds, the case for bullish continuation remains strong.
Indicators used
DriftLine — Pivot Open Zones → For identifying key yearly/monthly/weekly/daily opens that act as major S/R reference points
Multi Timeframe 8x MA Support Resistance Zones → to identify support and resistance zones such as the Weekly 21 EMA/SMA.
➡️ Available for free. You can find it on my profile under “Scripts” and apply it directly to your charts for extra confluence when planning your trades.
_________________________________
💬 If you found this helpful, drop a like and comment!

LINK has formed a Double Bottom pattern📊 LINK Market Update
LINK has formed a Double Bottom pattern ✅
It broke out of the red resistance zone 🔴 and is now approaching the first target at the blue line level 🎯
If momentum continues, the second target will be the next blue line level 📈

LINK/USDT - Ready for Takeoff? Major Bullish Reversal in Play!🚀 Trade Setup Details:
🕯 #LINK/USDT 🔼 Buy | Long 🔼
⌛️ TimeFrame: 1D
--------------------
🛡 Risk Management (Example):
🛡 Based on $10,000 Balance
🛡 Loss-Limit: 1% (Conservative)
🛡 The Signal Margin: $534.47
--------------------
☄️ En1: 20.74 (Amount: $53.45)
☄️ En2: 19.34 (Amount: $187.06)
☄️ En3: 18.4 (Amount: $240.51)
☄️ En4: 17.51 (Amount: $53.45)
--------------------
☄️ If All Entries Are Activated, Then:
☄️ Average.En: 18.87 ($534.47)
--------------------
☑️ TP1: 24.56 (+30.15%) (RR:1.61)
☑️ TP2: 27.87 (+47.69%) (RR:2.55)
☑️ TP3: 32.73 (+73.45%) (RR:3.93)
☑️ TP4: 40.16 (+112.82%) (RR:6.03)
☑️ TP5: 50.34 (+166.77%) (RR:8.91)
☑️ TP6: Open 🔝
--------------------
❌ SL: 15.34 (-18.71%) (-$100)
--------------------
💯 Maximum.Lev: 3X
⌛️ Trading Type: Swing Trading
‼️ Signal Risk: 🙂 Low-Risk! 🙂
🔎 Technical Analysis Breakdown:
This technical analysis is based on Price Action and Smart Money Concepts. All entry points, Target Points, and the Stop Loss are calculated using professional mathematical calculations. As a result, you can have an optimal trade setup based on great risk management.
Technically, LINK is bouncing off key support levels and forming a solid accumulation structure, suggesting strong hands are preparing for a breakout. With multiple confluences aligning — including long-term trend support and bullish divergence — this setup favors patient swing entries with impressive risk-to-reward potential.
📊 Sentiment & Market Context:
Chainlink (LINK) is showing signs of renewed bullish strength following a consolidation phase and broader market resilience. The crypto market has recently seen improved sentiment amid increasing institutional involvement and growing anticipation around real-world asset tokenization — a core use case for Chainlink's oracle solutions.
🔎 About LINK:
Chainlink is a decentralized oracle network that enables smart contracts to securely interact with real-world data. It plays a critical role in DeFi, insurance, gaming, and more — bridging on-chain and off-chain systems. As adoption of decentralized infrastructure grows, LINK continues to position itself as a key infrastructure asset in the blockchain ecosystem
⚠️ Disclaimer:
Trading involves significant risk, and past performance does not guarantee future results. This analysis is for informational purposes only and should not be considered financial advice. Always conduct your research and trade responsibly.
💡 Stay Updated:
Like this technical analysis? Follow me for more in-depth insights, technical setups, and market updates. Let's trade smarter together!

LINK/USDT Weekly FVG Tap
BINANCE:LINKUSDT has arrived right at a strong level that I see as a solid opportunity to enter.
This zone, together with the lower DCA area I highlighted as backup, looks like a prime region to build a spot position on LINK.
I’ll share another update if needed.

LINKUSDTLast week BINANCE:LINKUSDT , after touching 24.80 dollars 🚀, the price failed to hold and moved into correction. The overall structure still shows a range between key support and resistance, with compression signaling the potential start of the next trend. Currently, momentum leans slightly bearish 📉, but the market has not yet confirmed a clear direction.
Key Levels:
Initial support: 23.18 dollars 🛡️
Next supports: 22.50 dollars – 21.60 dollars
Nearby resistance: 24.40 dollars
Higher resistances: 25.20 dollars – 26.50 to 27.50 dollars 🎯

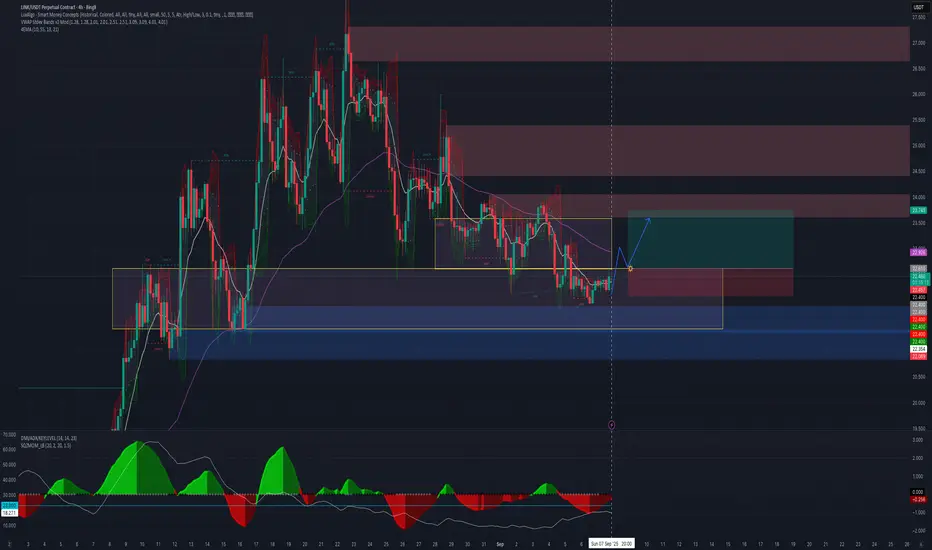
$LINK – PREMIUM PUMP, DISCOUNT DUMP? THE SQUEEZE SETUP EXPLAINEDLINK – PREMIUM PUMP, DISCOUNT DUMP? THE SQUEEZE SETUP EXPLAINED
Traders,
LINK — and likely the broader crypto market — is setting up for a premium squeeze that turns into a discount dump.
ANALYSIS
On Binance Perpetuals you can see longs piling in near $24 while price stalls → CVD pushes up, price doesn’t. That’s buying with no progress = bearish absorption with CVD non-confirmation. Check the data here ibb.co
Aggregated Spot CVD (all exchanges) is flat. No real spot demand → only leveraged longs propping up price. Check the data here ibb.co
Price is now inside the Golden Pocket retracement zone. High-probability reaction area where strong hands fade late longers.
Measuring swing low → swing high (06 Sep – 13 Sep), price is right at the Value Area High (VAH). This is the edge of acceptance.
Confluence: we’re also tagging the upper Anchored VWAP band (green line) from both the swing high and the swing low.
→ Why this matters: Anchored VWAP tracks the average cost basis of participants from a chosen pivot. When the swing low → high AVWAP band and the swing high → low AVWAP band overlap in the same zone, it creates double confluence: longs from the bottom see this as “expensive” and reduce risk, while shorts from the top defend their break-even. Historically, these overlaps act as strong rejection zones unless fresh spot demand breaks through.
MY TAKE
Expecting rejection at $24 and a move back toward $21 (blue AVWAP test). I think - based on data - that we might move even lower.
Setup = trapped longs at premium + no spot demand + strong confluence of VAH, Golden Pocket, and dual AVWAP resistance.
Invalidation = acceptance above $25 with spot CVD joining the move.

LINK LONG AND SHORT IDEAHi guys . i have this setup for BINANCE:LINKUSDT a double position . a long to upper FVG then short from there . in both case my SL above and blow major pivots.

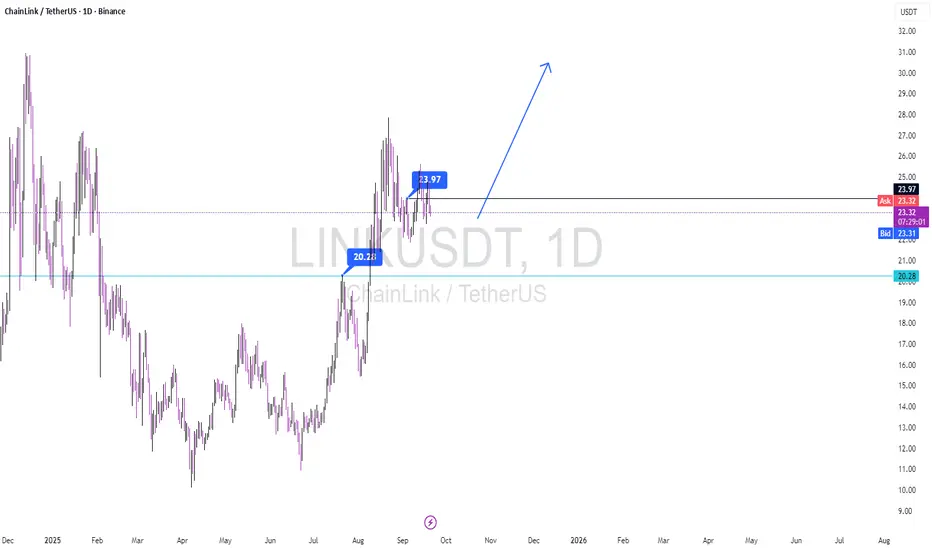
Professional Analysis: LINK/USDT (Daily Timeframe)Current Setup: LINK has successfully breached and held above the key support level of $20.28, demonstrating bullish momentum. The price action is currently consolidating in what appears to be a Bull Flag pattern, suggesting a potential continuation of the prior upward move.
Trigger & Confirmation: A decisive daily close above the pattern's resistance at $23.97 will serve as the primary buy signal according to my strategy. I am awaiting confirmation from a secondary indicator before considering this trigger fully validated.
Projection: Upon a confirmed breakout, LINK possesses a clear trajectory to target higher resistance levels on the daily chart.
Risk Management: A strict stop-loss is essential for this setup. Any move resulting in a daily close back below $20.28 would invalidate the bullish structure and signal an exit.
I will issue a formal ' SPECIAL SIGNAL ' alert once all confirmation criteria are met and the trade is officially live.
Trade Safe,
S.Reza Mehrjuyan / CEO FNS
Analyst, Manager
LINK - BULLISH Im buying some CRYPTOCAP:LINK here on this green zone 📈
Weekly uptrend & daily retest; price might start to tank again! 📈
Remember my medium term outlook: 29.50 - 30.00$ = magnet resistance weekly.
Lower key demand zone: 22.30 - 21.50 - 20.60 - 19.00$

LINK - Swing Long OpportunityLINK - Swing Long Opportunity
📊 Market Sentiment
Market sentiment remains strongly bullish as the FED is expected to deliver a 0.25% rate cut, with speculation building for a possible 0.5% cut in September. Monetary policy shifts are being driven by both inflation trends and weakening labor market data. The latest August and September job reports were soft, signaling that the economy is cooling rapidly. This environment continues to fuel expectations for a major bullish run in the weeks ahead.
📈 Technical Analysis
Price is bullish on the HTF, so I will only be interested in long setups.
Price recently broke and closed above the bearish trendline, confirming bullish continuation.
We also saw a break and close above the HTF Key Level, which should now act as support.
Moreover, the 0.5 Fibonacci retracement level aligns perfectly with the HTF Key Level, creating strong confluence for a potential entry.
📌 Game Plan
I will be entering long positions at the 0.5 Fibonacci retracement / HTF Key Level intersection.
🎯 Setup Trigger
Confirmed 15M break of structure before entry.
📋 Trade Management
Stoploss: Daily close below the HTF Key Level or hard stop at $22.64
Targets:
• TP1: $26.03
• TP2: $26.63
• TP3: $27.85
💬 Like, follow, and comment if you find this setup valuable!
⚠️ Disclaimer: This content is for informational and educational purposes only and does not constitute financial, investment, or trading advice. Always do your own research before making any financial decisions.

Link - Take profit targetI anticipate Link will hit my take profit this weekend. I bought the bottom last Sunday, so I'm happy with my profits, even if Link goes higher than my TP.
May the trends be with you.
LINK/USDT 12h chart🔹 key levels
• Support (red lines):
• 21.73 USDT → First strong support (tested several times).
• 20.17 USDT → Another key support (potential descent, if the price drops below 21.7).
• 18.10 USDT → deeper support (larger pullback).
• resistance (green lines):
• 23.22 USDT → The price is currently testing this level.
• 24.14 USDT → strong resistance if you manage to break 23.2.
• 25.54 USDT → Higher resistance, last local peaks.
⸻
🔹 Trend
• We see an upward trend (orange trend), which was defended at around 21.7.
• The price is currently testing the top of the channel → If the candle closes above 23.2, possible movement towards 24.1 - 25.5.
⸻
🔹 oscillators
• Stoch RSI:
• strongly bought (blue and orange line high in zone 80).
• It may suggest short -term withdrawal if there is no breakdown.
• RSI classic:
• He bounced off the level ~ 40 and grows slightly.
• Still a lot of space to grow before entering the purchase zone (70+).
⸻
🔹 Scenarios
1. Bycza (Bullish):
• Breaking above 23.2 USDT and confirmation of this level as support → Target 24.1 and 25.5.
2. Bear (bearish):
• Rejection from 23.2 and Trendline fracture down → decrease to 21.7, and then even 20.1.
⸻
✅ Summary:
The link is now at an important moment - either it will break 23.2 and will go higher (24-25.5), or will reflect and return to around 21.7. The oscillators show that there may be a small correction short -term, but the medium -term trend still looks upwards.

what I will do with link “Waiting for a range breakout and reversal at 22.61 to target 23.74 for a 5% move, stop at 22.07, 2:1 ratio.”
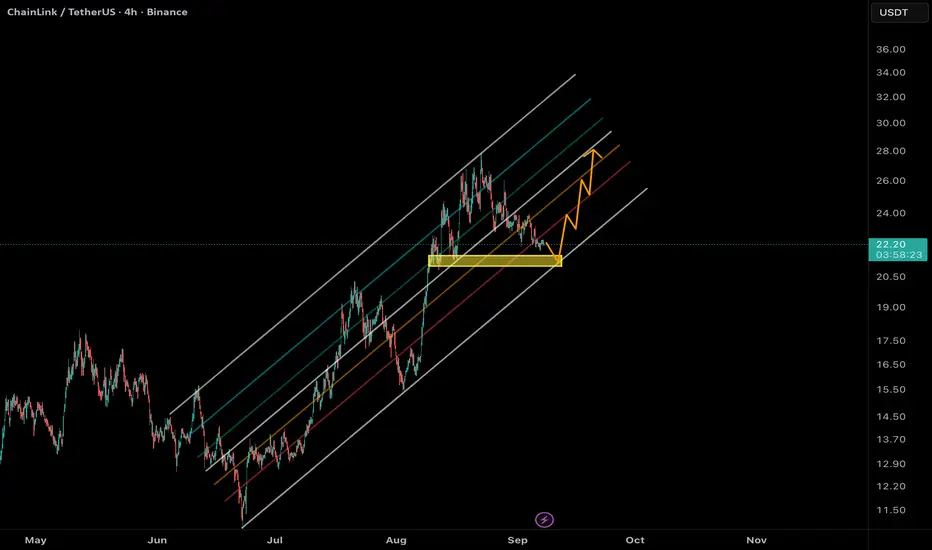
Chainlink (LINK/USDT) AnalysisLINK is currently trading around $22.2.
According to the ascending channel structure, if the price pulls back to the channel support near $21.4, we could expect a potential bullish reaction from this level.
🎯 Possible upside targets in case of a rebound:
• $23.8
• $26
• $28
⚠️ However, if the $21.4 support fails to hold, a deeper correction toward $20 may occur.