LinkUSDT: Elliot Waves AnalysisHello friends, I have opened such a trade on the LINK currency. The strategy is based on Elliott waves and price action. I hope you can be profitable.
LINK

Chainlink (LINK/USDT) – Two Key Scenarios AheadChainlink is currently trading at $24.9, right below a major resistance zone around $27.3. The price has been moving within a long-term ascending channel since mid-2022, and right now it’s at a decisive point.
🔹 Scenario 1 (More Probable – Bearish Rejection)
If LINK fails to break $27.3, we could see a rejection that triggers a correction towards the lower boundary of the ascending channel, around $15–17 (SC1). This aligns with the overextended move and prior rejection patterns.
🔹 Scenario 2 (Bullish Breakout)
A successful breakout above $27.3 with strong volume could fuel a rally toward the channel top, targeting the $45–52 zone (SC2).
📊 Technical Notes:
• Current resistance: $27.3 (critical decision point).
• Support levels: $18–19, then $15–17 (channel support).
• Next resistance above $27.3: $34, then $45–52.
• Structure: Ascending channel since mid-2022.
✅ Conclusion
While both scenarios are valid, the bearish rejection (Scenario 1) seems more likely unless LINK breaks $27.3 with conviction. Traders should watch for rejection signals at current levels before committing.

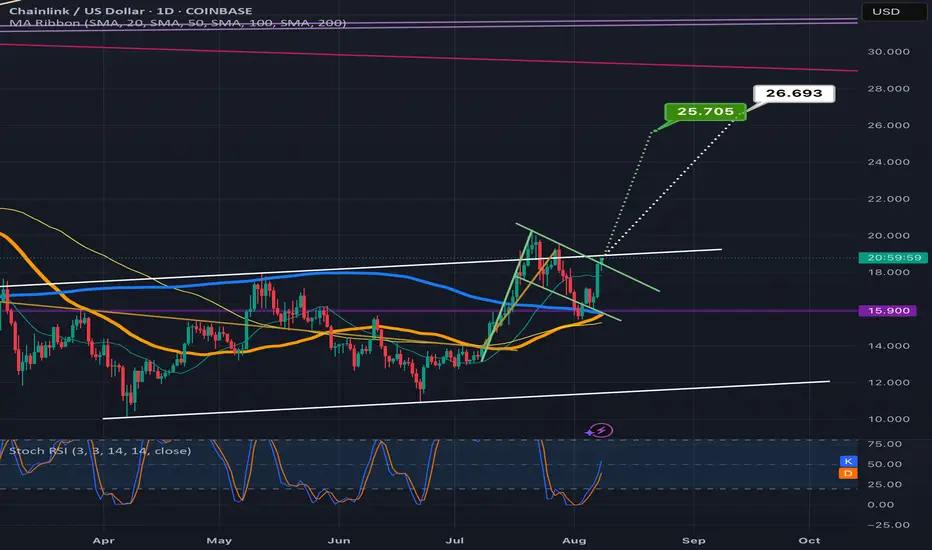
Chainlink looks ready 2 break up from bullflag & a double bottomGreen target is the bullflag white target is the double bottom. *not financial advice*
LINK/USDT buy opportunitywaiting for pullback, step down to 22.51 to buy, a lot of demand on that price area, after consolidation near that price range, think that at least 5% step up is pretty possible

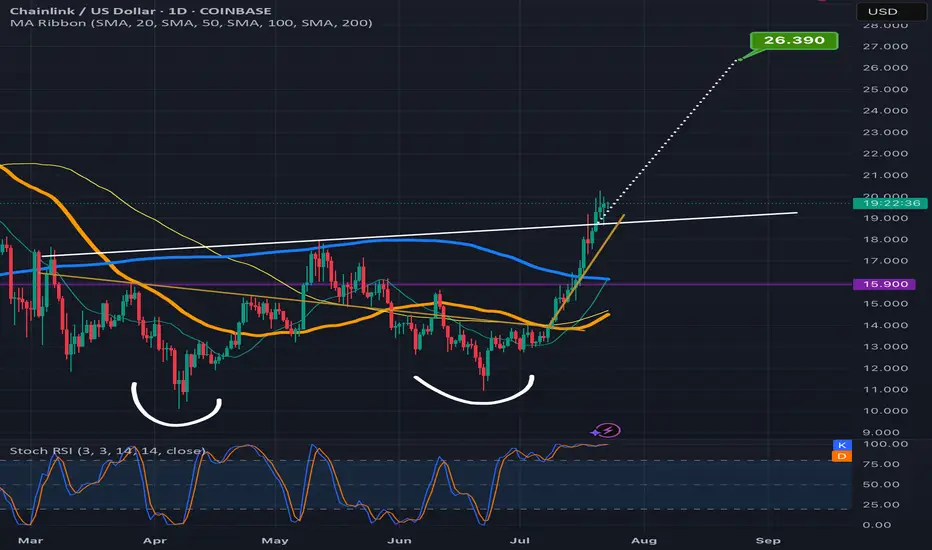
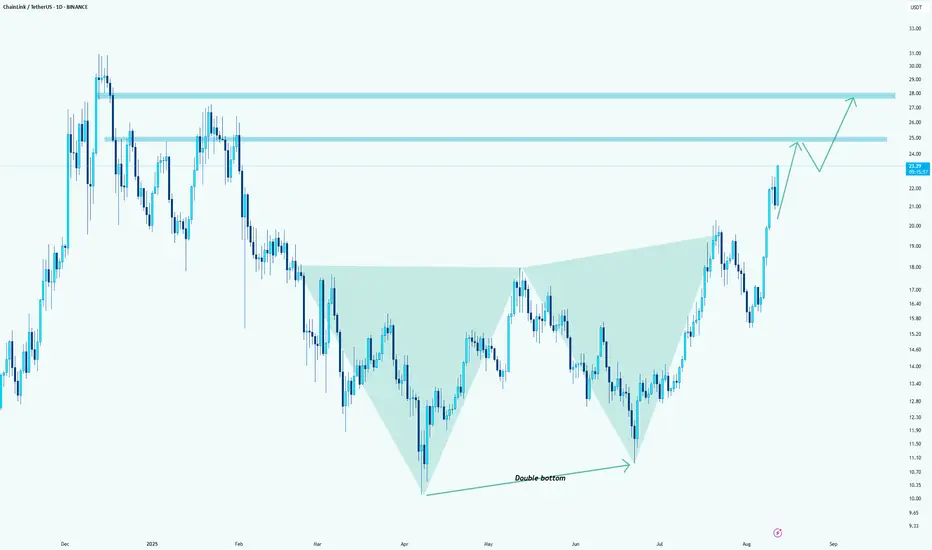
Chainlink climbing the measured move line staircaseLooks like Chanlink is ready to confirm the double bottom breakout here as the past few candles have already started to climb up the measured move line like a staircase.Always possible for a dip back below the neckline at this point but probability slightly favors the readout being validated instead for now. *not financial advice*
Check if it finds support around 23.98-25.17 and rises
Hello, fellow traders!
Follow us to get the latest information quickly.
Have a great day.
-------------------------------------
Chainlink is one of the coins connected to many ecosystems.
Therefore, I believe it's worth holding for the medium to long term.
(LINKUSDT 1M chart)
The key is whether the price can find support around 23.98-25.17 and rise along the uptrend line.
If not, caution is advised as it may touch the lower uptrend line.
-
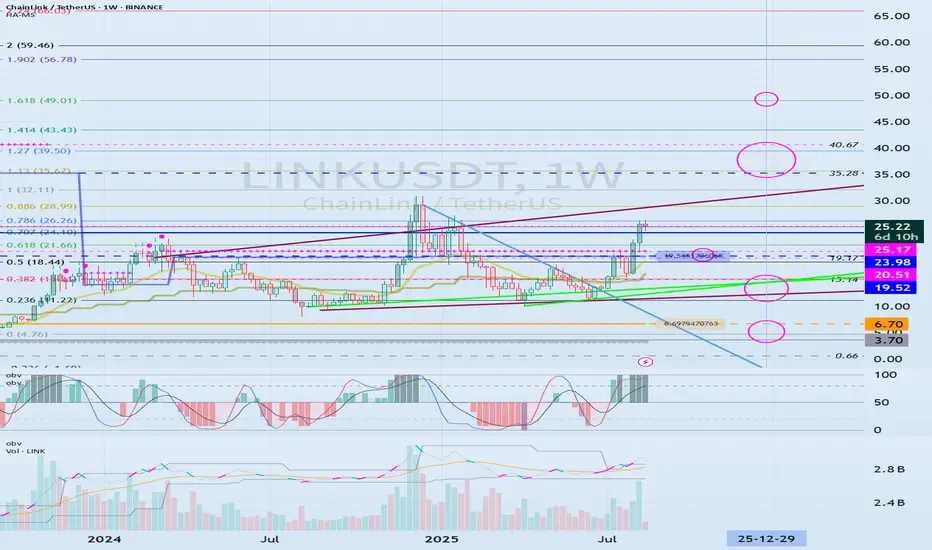
(1W chart)
If the price finds support around 23.98-25.17 and rises,
1st: 35.28-40.67
2nd: Fibonacci ratio 1.618 (49.01)
It is expected to rise to the 1st and 2nd levels above.
After that, a bearish turn appears likely.
Based on the current price, if it falls below the 19.52-20.51 range, it is recommended to stop trading and wait and see how the situation develops.
-
(1D chart)
Ultimately, the key is whether the price can break above the uptrend line (1).
If not, you should check for support within the circled area marked on the chart.
However, if the price falls below the M-Signal indicator on the 1M chart, you should stop trading and wait and see how things turn out.
-
Thank you for reading.
I wish you successful trading.
--------------------------------------------------
- This is an explanation of the big picture.
(3-year bull market, 1-year bear market pattern)
I will explain in more detail when the bear market begins.
------------------------------------------------------
#LINK/USDT in upward mood !#LINK
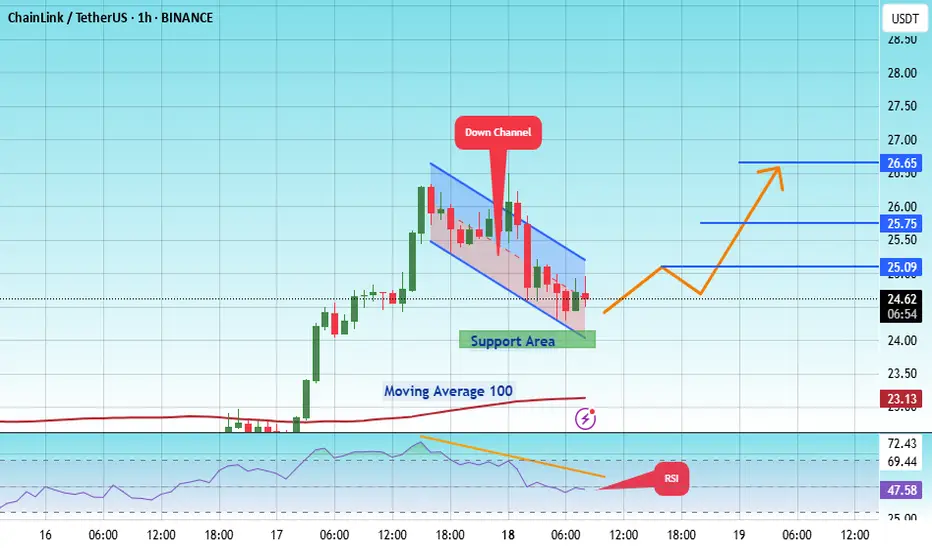
The price is moving within an ascending channel on the 1-hour frame, adhering well to it, and is on track to break it strongly upwards and retest it.
We have support from the lower boundary of the ascending channel, at 24.20.
We have a downtrend on the RSI indicator that is about to break and retest, supporting the upside.
There is a major support area in green at 24.00, which represents a strong basis for the upside.
Don't forget a simple thing: ease and capital.
When you reach the first target, save some money and then change your stop-loss order to an entry order.
For inquiries, please leave a comment.
We have a trend to hold above the 100 Moving Average.
Entry price: 24.60.
First target: 25.09.
Second target: 25.75.
Third target: 26.65.
Don't forget a simple thing: ease and capital.
When you reach your first target, save some money and then change your stop-loss order to an entry order.
For inquiries, please leave a comment.
Thank you.
Link shows clear bearish divergenceIf we look closely at LINK/USDT right now, the charts are flashing a clear bearish divergence. This setup usually acts as a warning sign, and the price action is already hinting at a potential correction. The first important zone to watch is around 19.5 – it lines up with the golden pocket as well as a previous resistance that can now flip into support.
But if Bitcoin dominance continues climbing, there’s a risk of LINK moving deeper into correction territory. In that case, the 17.5 zone becomes a realistic target, and a move into that range would confirm a stronger bearish dump.
So the play here is simple: keep an eye on 19.5 as the first defense zone. If it holds, bulls might get some relief. If it breaks, prepare for the possibility of LINK sliding down toward 17.5.

Chainlink 2025 All-Time High Price Projection At $130 & $82Chainlink market bottom after the last bull market happened June 2023. The orthodox end of the bear market was June 2022. Chainlink is a very strong project.
After reaching bottom in mid-2022, the pair immediately started trading sideways. LINKUSDT went sideways for an entire year—bottom consolidation/accumulation/opportunity buy zone—and finally entered a new uptrend. This uptrend is what we are witnessing up close.
After the rise in late 2023 ending March 2024 LINKUSDT settled for a wide consolidation channel with a bullish bent, with higher highs and higher lows. LINKUSDT has been moving in this channel for more than a year and we are seeing the unfoldment of a new higher high.
The way the chart is drawn, the candles and the patterns, the way the market is behaving and the rising volume are all pointing towards a major advance. It is already happening, but everything is about to speed up. It is already good, great, but it is about to get better.
The first target and immediate resistance is $35. This would produce the highest prices since November 2021 and open up the last stage of the 2025 bull market for this pair. Remember, each pair is different.
Then $82 is a strong target and very likely to be a troublesome resistance point. There can be a stop here... If my thinking is right, LINKUSDT can hit $130 in this cycle. The final target is between $82 and $130 but these might be conservative numbers.
Thank you for reading.
Namaste.

Chainlink is up 160% since early April —What now?This is the perfect chart. This chart is perfect proof of where the market is at as a whole and where it is headed. Chainlink is moving higher and now trades at the highest price since January 2025.
Go a bit higher, a target of $32, and we have the highest prices since November 2021, the previous bull market. And LINKUSDT will achieve this target easily and move higher. I also predict that we are going to see a new all-time high in 2025. And this is a high probability prediction, there is just too much data in favor of.
It all starts with a low in April and then we have a higher low in June. The market goes sideways for at least four months (120 days) without any significant growth before turning extremely bullish. By the time we reach this week, the market has been green for an entire month, since 16-June.
Ethereum did something similar. A low in April followed by a small recovery then sideways consolidation. When the sideways consolidation ended the advance is still on going today and ETHUSDT almost hit a new all-time high.
Chainlink is moving forward and becoming stronger. Cardano is moving forward and many more projects are doing great. Slowly but surely, the altcoins market is starting to heat up and everything will change so fast, for the better.
One day we are buying, waiting, sharing, learning, holding and trading, the next day the entire market is up 300-500%. Then it keeps on growing.
Chainlink (LINKUSDT) is up more than 160% since its 7-April 2025 low. There is room for plenty of additional growth.
We will look at this pair again soon with 2025 all-time high projections. Make sure to follow to receive a notification when the post goes live.
Namaste.

Chainlink (LINK)LINK doesn't need any introduction; it has a great project, a great community, and has also given great growth. It seems the corrective wave has ended at 0.382 Fibonacci retracement and now the price is about to break the consolidation triangle-shaped area. Let's see how things unfold.

LINK Rally Cools Off — Next Long Opportunity at $20LINK has awakened with strength, rallying +60% in just 10 days. Price completed a clean 5-wave Elliott impulse, topping at the 1.0 trend-based Fib extension, which aligned with:
0.702 Fib retracement
Pitchfork upper resistance line
Key resistance zone
This perfect confluence marked the 5th wave top, followed by a -13% correction.
🔴 Short Opportunity
The current structure is forming a Head & Shoulders pattern.
➡️ Resistance zone: $23 – $23.5
🧩 Confluence factors:
Anchored VWAP (red line) from the 5th wave top
Fib speed resistance fan – Golden Pocket
➡️ Target: $20 support zone.
🟢 Long Opportunity Zone
The $20 zone offers the strongest confluence for a long entry:
Yearly Open (yOpen): $20.02
0.5 Fib retracement: $20.09 (of the 5 Elliott waves)
Pitchfork golden pocket
Anchored VWAP (green line): $20.28 (swing high)
Fair Value Gap (FVG) / imbalance fill
Liquidity pool
$20 psychological level
Trade Plan:
Entry: $20.5 – $19.5
Stop Loss: Below $19
Take Profit: $25
Potential gain: +25%
R:R: ~1:5
🔍 Indicators used:
DriftLine — Pivot Open Zones → For identifying key yearly/monthly/weekly/daily opens that act as major S/R reference points
➡️ Available for free. You can find them on my profile under “Scripts” and apply them directly to your charts for extra confluence when planning your trades.
_________________________________
💬 If you found this helpful, drop a like and comment!

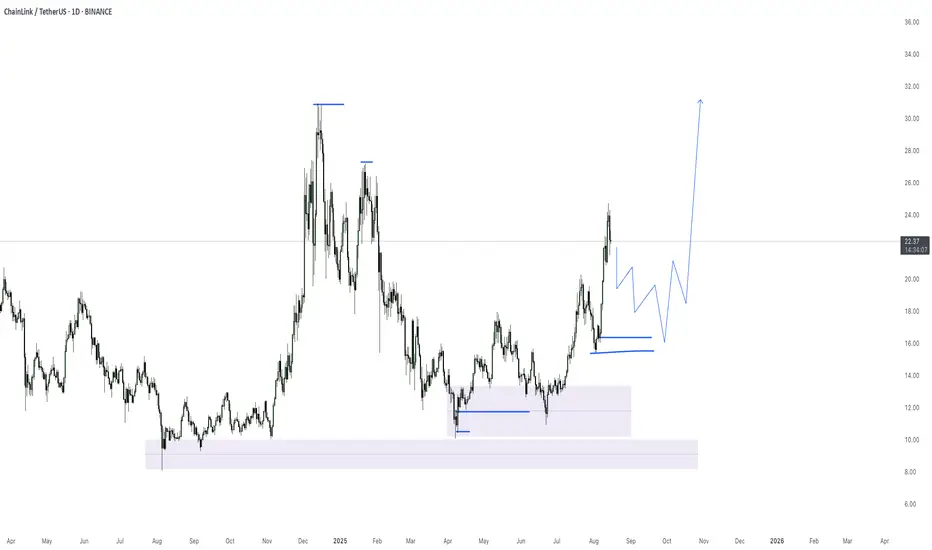
LINK/USDT - LONGdaily chart analysis highlights strong bullish momentum, marked by a sharp upward move. The price is expected to perform a pullback to the 18$–15$ support zone before resuming its bullish trend, potentially reaching 27$–32$.
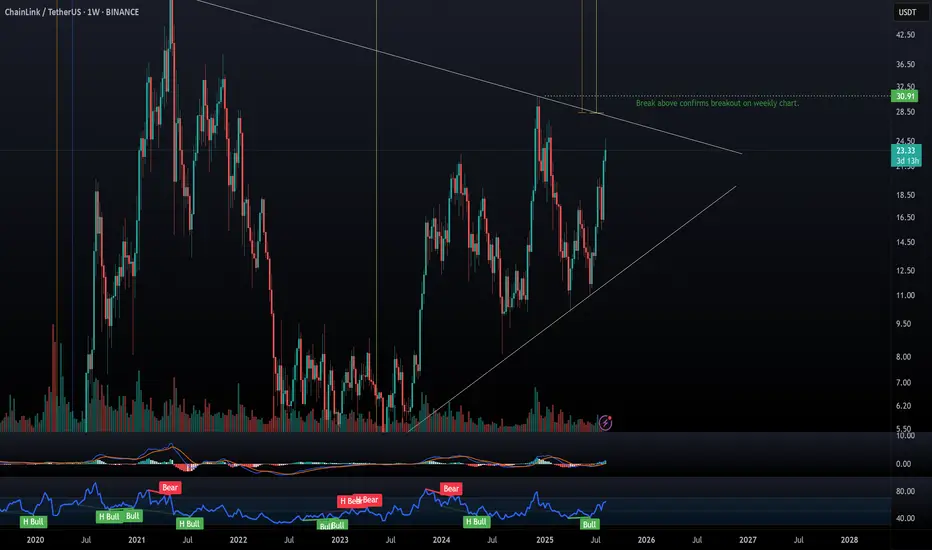
Chainlink Bullflag on Weekly ChartA huge bullflag pattern has formed on the weekly chart, if this breaks to the upside we could be looking a face melting targets, with the most bullish targets exceeding $1000.
I've added horizontal ray lines with highlighted price targets to the left, colour coded to the corresponding price range. Once the price breaks out of the triangle, I've also added a confirmed breakout level, which is the previous resistance line touch point.
Hopefully this plays out and we'll all buying yachts :)
Link: it formed a double bottomHello guys.
Link formed a double bottom and a divergence at the same time!
You can count on longs here.
Target1: 25
Target2: 28
The pressure from buyers is high! I hope you can get it on the pullbacks
LINKUSDTThis chart is in a bullish trend, but it broke a new high at $22.7. If BINANCE:LINKUSDT can keep the price above $20, we can expect it to reach a higher high.
Please control risk management.⚠️

$LINK is up 54% from recent lows, now at $24. CRYPTOCAP:LINK is up 54% from recent lows, now at $24. Price is consolidating after the strong rally — holding above $20 could sustain momentum toward $28–$32, while losing this zone risks a deeper correction back to $15.

Why I'm long on LINK 3 reason backed by chart LINK/USDT – Monthly Chart Analysis
Chainlink is currently testing a multi-year resistance line that has capped price since the 2021 peak. The asset has been forming a large ascending triangle pattern with higher lows since mid-2022, showing accumulation pressure building up.
Resistance Zone: $27–$35
Current Price: $23.94
Support Trendline: Holding strong since 2019 lows
Structure: Bullish compression into resistance
Key Takeaways:
A monthly close above the resistance line could trigger a breakout towards $35–$50 in the medium term.
Until the breakout is confirmed, expect possible rejections and retests of the $20–$21 zone.
The risk/reward is attractive for spot investors looking for a breakout play.
📌 Watch the monthly close carefully — confirmation above resistance could mark the start of a strong LINK rally.

Extreme greed - LINK weekly update August 12 - 18thFrom an Elliott Wave perspective, Chainlink is currently in Minor degree Wave 5 within Intermediate degree Wave 3. On a broader scale, LINK has completed a 1–2 structure at both the Primary and Intermediate degrees, similar to many other altcoins I have analysed recently, and is now advancing as part of Cycle degree Wave 1.
Liquidity positioning shows a substantial build-up below current price. The recent impulsive rally was largely driven by a short squeeze, as many traders opened short positions during Wave 4 and were subsequently liquidated. The order book also shows heavy order clusters above price, aligning closely with the key Fibonacci extension levels.
Funding rates, however, paint a more cautionary picture. They are currently at extremely high positive levels, while open interest has spiked sharply — suggesting that this leg higher is standing on shaky ground. Such conditions often precede volatility spikes or corrective pullbacks. Additionally, momentum indicators like the RSI are showing overbought conditions.
Given the current structure and liquidity alignment, the 1.618 Fibonacci extension remains my preferred target for the completion of this Minor Wave 5, as it coincides with a significant concentration of orders and fits the overall Elliott Wave projection. That said, the combination of overheated funding rates, elevated open interest, and extreme momentum readings warrants high caution for traders.
As always — do your own research, and trade safe.

CHAINLINKUSDT Daily Chart Analysis | Channel BreakoutCHAINLINKUSDT Daily Chart Analysis | Channel Breakout & Bullish Momentum
🔍 Let’s dive into the ChainLink/USDT spot chart, analyzing key swings, channel dynamics, and fresh momentum signals for a bullish scenario.
⏳ 1-Day Overview
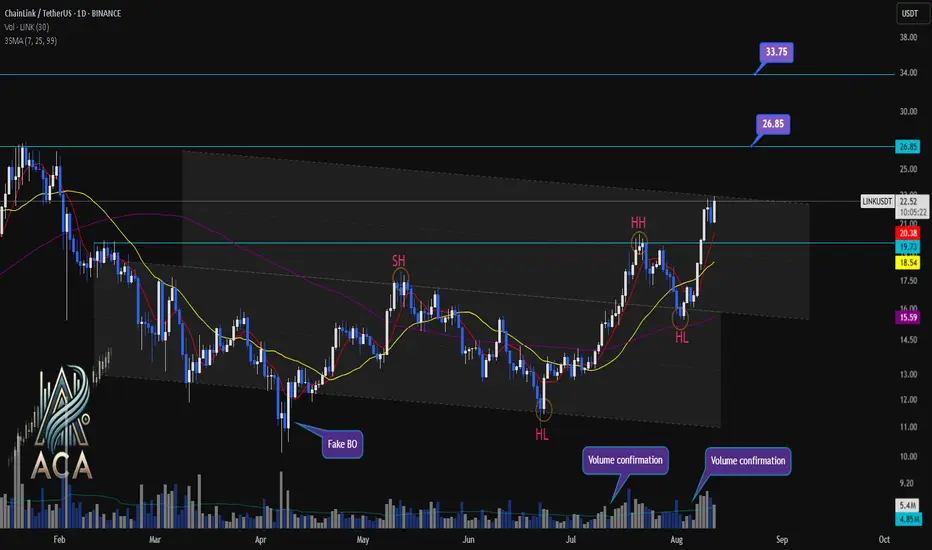
The daily chart shows LINKUSDT surging toward the RR1 (Risk-Reward 1) of its channel pattern, marked by powerful volume confirmations that help validate the move. Price has decisively broken above prior resistance zones and continues to print higher highs (HH) and higher lows (HL). The chart’s swing structure is clear: a series of ascending pivots signaling a bullish reversal from past lows.
🔺 Channel, Swings & Momentum:
- Price action is respecting the well-defined channel; current breakout and move to RR1 highlights bullish control.
- Swings are established: recent HL and HH confirm upward structure.
- Volume spikes on breakouts further confirm buyer strength, supporting the move out of consolidation.
- 3SMA (7, 25, 99) alignment shows short- and medium-term averages crossing above the long-term trend—often a leading indicator for the start of a strong uptrend.
- Next targeted levels stand at $26.85 and $33.75, while the long-term target remains a fresh All-Time High (ATH), should momentum persist.
- Past “Fake BO” (breakout) risk now superseded by true volume-backed move supported by technical confirmations.
📊 Key Highlights:
- Channel breakout with confirmation at RR1, swing HH/HL structure for bullish momentum.
- Volume surges on upward moves—critical for authenticating breakout strength.
- 3SMA configuration points to the potential beginning of a major trend extension.
- Upside targets: $26.85 for the next level, $33.75 as extension, and new ATH as the bold long-term bull case.
🚨 Conclusion:
ChainLink’s breakout above channel resistance signals bullish intent with strong volume and swing confirmation. Eyes on next targets: $26.85 and $33.75. If volume and trend continue, new ATH is on the horizon.
Clean HTF AMD Pattern for $LINKClean HTF AMD for BIST:LINK
Accumulation
Manipulation
Distribution
$200 is next

#LINK/USDT targeting 17.77 $ ?#LINK
The price is moving within a descending channel on the 1-hour frame and is expected to break and continue upward.
We have a trend to stabilize above the 100 moving average once again.
We have a downtrend on the RSI indicator that supports the upward break.
We have a support area at the lower boundary of the channel at 15.60, acting as strong support from which the price can rebound.
We have a major support area in green that pushed the price higher at 15.30.
Entry price: 15.84
First target: 16.47
Second target: 17.00
Third target: 17.77
To manage risk, don't forget stop loss and capital management.
When you reach the first target, save some profits and then change the stop order to an entry order.
For inquiries, please comment.
Thank you.

ChainLink $32 & $47 · A Different PerspectiveGood evening my fellow Cryptocurrency trader, how are you feeling in this wonderful day?
We are back to work and today I am looking at ChainLink for you, on the weekly timeframe.
We want to know what is happening short-term and where the market is headed in the long haul. We want a clear analysis and we want positive results and hope.
Technical analysis
LINKUSDT Weekly. Notice the purple line on the chart, this is now support. Just last week LINK closed below this line. This week started lower and now LINKUSDT is trading far above this level. This was a price of $17 but ChainLink is trading at $22.22.
Where I am going with this is about bullish and bearish potential short-term. The drop is no more. LINKUSDT closed one week red but turned green the next week. This green is the confirmation of a failed breakdown. A bear-trap. The fact that LINK is now much higher signals the continuation to the next major resistance level and this is first $32.
This is a technical double-top with December 2024 and we know ChainLink has been moving in a channel (brown) that is composed of higher highs and higher lows, thus we expect a higher high next and that's when we get ChainLink trading at $47 and this will not be the end. This will only be one leg, one major advance, there will be more. The Cryptocurrency market is set to grow long-term.
Namaste.
