LINK/USD LONG SET UP(Swing Trade)Entry 1 $12.50
Entry 2 $10.00
Stop loss $8.50
Take profit 1- $16.50
(Close 25%)
Take profit 2- $20.50
(Close 50%)
Take profit 3-$24.50
(Close 75%)
Take profit 4-$28.50
(Close 100%)
Linkanalysis

LINK Spot LONG LINK Spot LONG📈
Due to the formation of a zigzag structure, I am more inclined to form a triangle and further exit from it upwards. I no longer consider it as an impulse.
Expectations have not changed, I plan to start recording after updating the global maximum of 53.00. Only the time of the scenario implementation has changed, which may take a long time.
All altcoins with potential show approximately the same picture, which is encouraging. This structure provides the most accurate goals for profit-taking and scenario cancellation.
LINK/USDT — The Final Defense Zone: Will the Bulls Rise Again?Chainlink (LINK) has entered its final defense zone around $15.00–$17.00, a historically strong structural support area.
This zone isn’t just random — it’s the same level where the market once launched a major rally that drove LINK to $27.87.
The most recent daily candle shows a deep wick below the zone that was quickly reclaimed — a classic sign of a liquidity grab or false breakdown, hinting that the market might be accumulating before its next significant move.
Overall, the structure suggests a major retest phase: after a powerful breakout earlier this year, LINK is now retesting the origin of that move.
The key question — is this the start of re-accumulation before another leg higher, or the beginning of a market structure breakdown toward deeper lows?
---
Structure & Pattern
Yellow Zone ($15–$17) → Historical demand zone, validated by multiple previous bounces (marked by yellow arrows).
Macro Pattern → Retest of breakout zone, with the latest candle showing sweep and reclaim behavior.
Momentum → Sharp correction, but with a long lower wick and potential momentum divergence — a sign that the correction phase might be near its end.
Technical Context → Holding above this zone may form a double bottom or higher-low structure, indicating bullish strength recovery.
---
Bullish Scenario (Reversal Setup)
A daily close above $17 would confirm that buyers are defending the structure.
A sustained move above $19.99 could unlock upside targets at $21.69 → $23.30 → $25.12 → $26.82.
A strong rejection from the lower zone, combined with rising volume, may signal institutional accumulation in progress.
Market Narrative:
Bulls might be quietly preparing for Phase 2 of the rally after a classic shakeout.
As long as the $15–$17 zone holds, LINK retains the potential to resume its mid-term uptrend.
---
Bearish Scenario (Continuation Breakdown)
A daily close below $15 would signal structural failure and a loss of bullish control.
This could trigger a continuation drop toward $13.5 → $12.0 → $9.8.
A failed retest from below the zone ($16–$17 rejection) would further confirm bearish momentum.
Market Narrative:
If this support collapses, LINK may enter a distribution phase, where selling pressure strengthens and momentum fully flips bearish.
---
Conclusion & Perspective
The $15–$17 zone is the line between survival and surrender for LINK’s bullish structure.
As long as this level holds, the potential for a bullish reversal remains alive.
But once broken, the mid-term trend could shift decisively to bearish.
We are standing at a Decision Zone — the kind of area where institutions quietly position themselves and patient traders wait for confirmation before taking action.
---
LINK returns to its final defense zone at $15–$17 — the area separating a major reversal from a new downtrend.
The long wick signals a liquidity sweep, but confirmation awaits the next daily close.
Bulls are being tested — will they hold the line, or give in to market pressure?
Levels to watch:
Support: $15–$17
Resistance: $19.99 → $21.69 → $23.30 → $25.12 → $26.82 → $27.87
---
#LINK #Chainlink #LINKUSDT #CryptoAnalysis #TechnicalAnalysi #SupportAndResistance #CryptoMarket #PriceAction #Altcoins #MarketStructure #CryptoSetup #LINKPrice

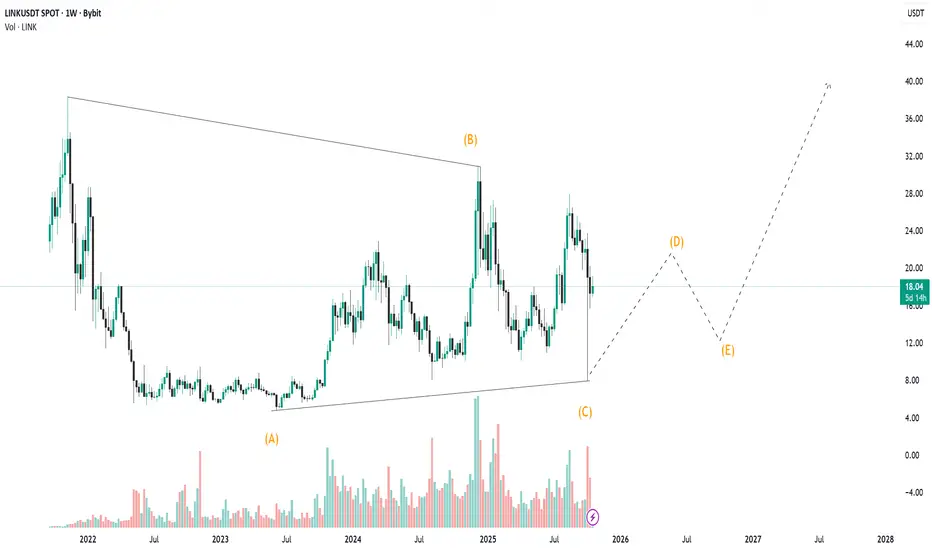
LINKUSD – Bullish Impulse Toward D-Point Target
LINKUSDT:
Title: LINKUSD – Bullish Impulse Toward D-Point Target
Price action has completed a corrective ABC structure, finding strong support at point C. The current breakout above mid-structure resistance confirms bullish momentum, aiming toward the D-point completion. Risk is managed below the breakout zone, with potential for trend continuation if price sustains above local support.
Risk Management Notes:
– Entry aligned with breakout confirmation
– Stop-loss below structural support (C-area)
– Take-profit near projected D-point completion

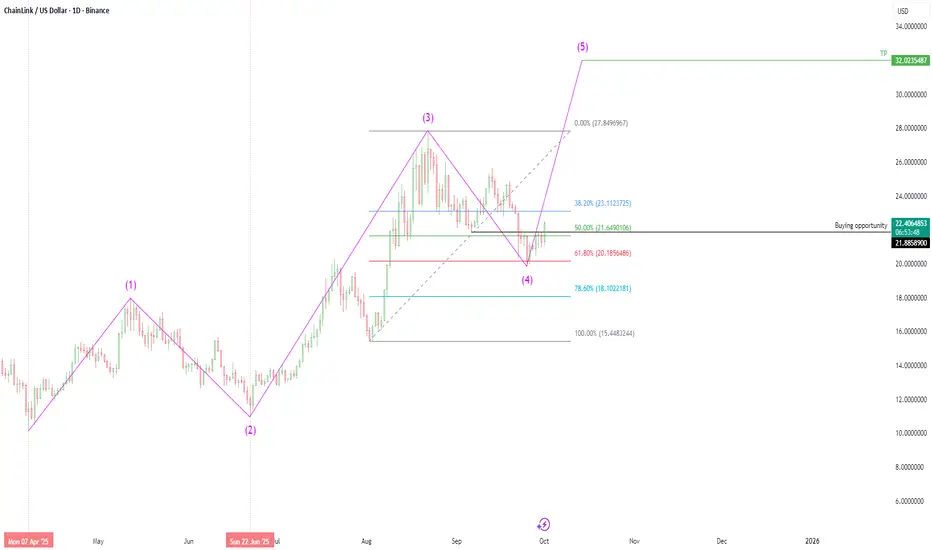
Chainlink (LINK/USD) - Elliott Wave AnalysisBased on Elliott Wave Theory, Chainlink (LINK/USD) appears to have successfully completed its corrective Wave 4, as evidenced by the recent stabilization and reversal patterns observed on the daily timeframe. This completion sets the stage for the anticipated impulsive Wave 5, which is now clearly visible on the daily chart. The structure suggests a continuation of the broader uptrend, with increased momentum likely to drive prices toward higher targets.
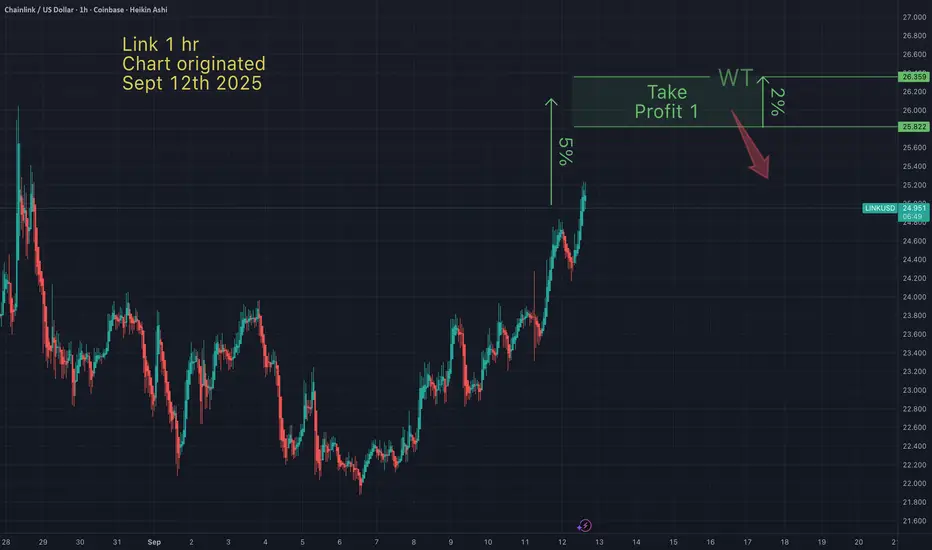
Link - Take profit targetI anticipate Link will hit my take profit this weekend. I bought the bottom last Sunday, so I'm happy with my profits, even if Link goes higher than my TP.
May the trends be with you.
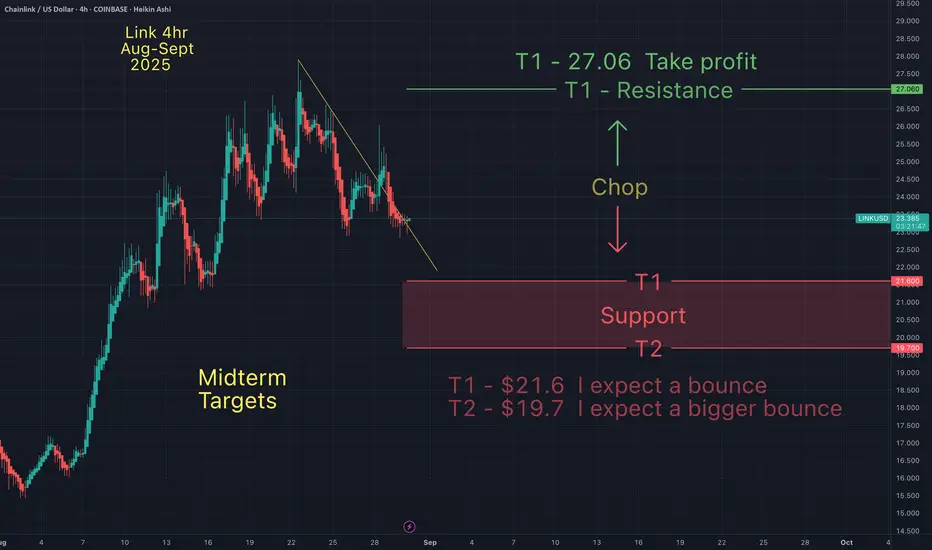
Link - Midterm support and resistance & my take profit targetsRecently, Link has been one of my favorite altcoins to trade. This chart shows my support and resistance levels & my take profits. Until the market reveals its trend duration, I anticipate chop between my support and resistance. But ultimately, these targets represent my ideal entries and exit.
May the trends be with you.
LINKUSD HIGH PROBABILITY SETUP SOON!!🚨LINKUSD HIGH PROBABILITY BUY SETUP 🚨
* Here We Can See Clearly The Next Potential Moves For LINKUSD Coming Hours/Days.
* Keep Your Eyes Close On Your Trading Positions.
* Happy PIP Hunting Traders.
£ FXKILLA £

LINK/USDT Setup: Structure Break + Fibonacci Confluence🚨 Market Watch: LINK/USDT Analysis 🚨
I'm currently keeping a close eye on LINK/USDT. 🧠 On the daily chart, we've observed a clear break in market structure 📉—and dropping down to the 4H timeframe, we see further confirmation of that shift.
At this point, price is looking a bit overextended 🏃♂️💨, and I’m anticipating a retracement back into equilibrium based on the current price swing 📊. This could set up a high-probability short opportunity 🎯.
📹 In the video, I dive into:
Overall trend direction 🔁
Market structure shifts 📐
Price action breakdown 🕵️♂️
And key support/resistance levels to monitor for target zones 🧱
My stop loss would be positioned just above entry, using around 2x ATR for smart risk control
🛡️. As for targets, we could see moves as wide as 6x ATR—but it's crucial to reference the left side of the chart for confluence 📅📈.
I’m aligning this setup with my Fibonacci retracement strategy, which we also covered in the video 🔢📏.
This is not financial advice. Always trade your own plan. ⚠️📉💼

Chainlink LINK price analysisThe 6-year trend line has been keeping the #LINK price “in play” by 4 times
The next is patience and observation.
🆗 As long as the OKX:LINKUSDT price is above the blue trend line, then the medium-term targets of $38 and $53 are still relevant.
_____________________
Did you like our analysis? Leave a comment, like, and follow to get more

Link: Possible buying opportunity Link find support at 78.60% fib level. We can find similar pattern in previous impulse move. There is highly likely that Link will take off from here all the way to $30.

The Bull Market Is Just Starting For Chainlink LINKHello, Skyrexians!
During this bull run the best performance has been showed by the old high cap coins, BINANCE:LINKUSDT is not an exception. It had a textbook accumulation and then growth for 5x+ from the bottom. Is it enough or the main gains ahead.
Let's take a look at the weekly time frame. The first wave from the bull run start we can count as a wave 1. Then retracement has happened in the wave 2 and currently asset is forming wave 3. Looks like now price is finishing the wave 2 inside the larger wave 3. It would be better to see the green dot on the Bullish/Bearish Reversal Bar Indicator like we have seen previously, but the zone is already great to buy this asset. Target is located between 1 and 1.61 Fibonacci extensions which corresponds the price range between $40 and $50.
Best regards,
Skyrexio Team
___________________________________________________________
Please, boost this article and subscribe our page if you like analysis!

ChainLink | LINK , TRUMP & Grayscale LINK pumped 500% since our last signal so Its time to Celebrate the New Year with Crypto
Chainlink isn’t just mooning on price it’s taking the crown in the real world assets (RWA) sector. LINK is leading the pack in development activity, leaving Ethereum based Synthetix (SNX) and the privacy savvy Dusk Foundation (DUSK) playing catch up
Price Up, GitHub Busy, and a New Year’s Party to Crash
The numbers? Chainlink flexed nearly 394 GitHub events in the past 30 days, compared to Synthetix's 176.6 and Dusk's 34.7. Meanwhile, Polymesh (POLYX) and Maker (MKR) aren’t far behind, clocking in at 25.9 and 21.7, respectively
Chainlink’s onchain momentum and fundamentals are bullish as well, growing active addresses and an all time high futures open interest of $770.27M are just tip of the iceberg. Grayscale announced that it has opened Grayscale LINK Trust to qualified investors, a fund that enables investors to gain exposure to XRP in the form of securities. As of December 12, Grayscale LINK Trust had a net asset value of $111.91 per share and $30,468,812 in assets under management
Chainlink's LINK token is experiencing a notable increase in price and market activity, fueled by a strategic investment from World Liberty Financial (WLFI), a project backed by Donald Trump’s family. WLFI recently expanded its holdings by purchasing an additional $1 million worth of LINK, raising its total investment in the token to $2 million.
LINK is trading at $29.4 (+1.5% over 24 hours), while its all time high of $52.82 (May 2021) is still 44% away. But hey, it's already the life of the crypto party, with a $1.1B daily trading volume and active trading on 99 exchanges, led by Binance. Market cap? A cool $18.6B
it’s a good time to toast to LINK’s rise🍾

LINK/USDT at Critical Support: Will the Bears Take Over?LINK/USDT is currently trading just above the key marked support zone and has faced rejection twice from the falling trendline.
If the price fails to hold this support, further downside continuation is likely.
Stay tuned for more updates!
DYOR, NFA

#LINK (SPOT) entry range( 9.50 - 11.00)T.(16.87) SL(9.28)BINANCE:LINKUSDT
entry range ( 9.50 - 11.00)
Target (16.87)
SL .1D close below (9.28)
*** collect the coin slowly in the entry range ***
*** No FOMO - No Rush , it is a long journey ***
**** #Manta ,#OMNI, #DYM, #AI, #IO, #XAI , #ACE #NFP #RAD #WLD #ORDI #BLUR #SUI #Voxel #AEVO #VITE #APE #RDNT #FLUX #NMR #VANRY #TRB #HBAR #DGB #XEC #ERN #ALT #IO #ACA #HIVE #ASTR #ARDR #PIXEL #LTO #AERGO #SCRT #ATA #HOOK #FLOW #KSM #HFT #MINA #DATA #SC #JOE #RDNT #IQ #CFX #BICO #CTSI #KMD #FXS #DEGO #FORTH # AST #PORTAL #CYBER #CLV #RIF #ENJ #ZIL #APT #GALA #STEEM #ONE #LINK ****

LINK Long Position (Consolidation Breakout)Market Context: LINK has been consolidating at support for the last six weeks, and this provides an opportunity to ladder into a long spot position with a favorable risk-reward ratio.
Trade Setup:
Entry: Enter a long spot position around $10.20.
Take Profit:
First target: $12.00 - $13.00
Second target: $16.00 - $17.00
Stop Loss: Just below $9.30
📊 This setup capitalizes on the consolidation at support with potential upside targets in a bullish market environment. #LINK #Consolidation #Crypto

LINK Long Position (Oversold Conditions)Market Context: LINK has reached an important level of support, with oversold conditions on medium timeframes. This presents a potential long trade opportunity, particularly if BTC holds the $58,000 support level.
Trade Setup:
Entry: Long trade around $10.80 - $11.53 support level.
Take Profit:
First target: $12.50 - $13.00
Second target: $14.50 - $15.30
Stop Loss: Tight stop loss just below $10.30.
📊 This trade capitalizes on the oversold conditions and key support, with well-defined targets and a tight stop loss to manage risk. #LINK #CryptoTrading #SupportLevel

LINK Long Spot PositionMarket Context:
LINK has been consolidating in an area of support, presenting an opportunity to enter into a long spot position.
Trade Setup:
Entry: Ladder into a long spot position in the $12.70 - $13.25 area of support.
Take Profit:
First target: $14.60 - $15.30
Second target: $16.20 - $16.90
Stop Loss: Place the stop loss just below $11.80.
📊 Monitor the market closely and adjust your strategy as needed! #LINK #CryptoTrading #SupportZone 🎯

Chainlink LINK price is quite strong will it last for long time?🛡 #LINKUSDT trading pair has attracted attention primarily because it has held its price quite well over the past few days, while most altcoins have been feeling “bad” and declining in value.
In the future, if buyers will keep #Link price above $15, it will indicate their serious intentions and there is a good chance that the nearest target is a rise to $22 🔼
🔽However, if the #LINKUSD price is allowed to consolidate below $13.25, the red scenario will be activated. This will mean that some crypto investors will suffer, while others will be happy because they will have a chance to buy #Chainlink tokens around $9
_____________________
Did you like our analysis? Leave a comment, like, and follow to get more

LINKUSDT.1DThe daily chart for Chainlink (LINK/USDT) indicates a recent bearish trend, as highlighted by the descending trendline, with the current price at $12.995. The chart showcases a resistance level (R1) at $16.577, beyond which R2 and R3 are marked at $21.477 and a high near $22.868, respectively.
The primary support level (S1) is set at $12.205, which is crucial for maintaining the current bearish structure. If the price breaks below this support, it could lead to further declines, potentially testing lower supports not identified on the chart.
The RSI is near the oversold territory at 38.28, suggesting that the market might be nearing a point where a reversal could occur if buyers step in. The MACD is below the signal line and in the negative zone, reinforcing the bearish momentum indicated by the price action.
Traders may consider looking for buying opportunities near the support level if bullish signals emerge, such as a bullish divergence on the RSI or a crossover to the upside on the MACD. Conversely, a break below S1 might be used as an entry point for short positions, with the expectation of further declines. A break above the descending trendline and resistance at R1 could suggest a potential reversal, targeting higher levels up to R2 and R3.

LINKUSD 1WLINK ~ 1W 📈
#LINK Make purchases gradually in this Support zone, with a minimum target of 20% from here. 📈

LINKUSDT: EW Analysis in 4hr timeframeHello guys. According to the chart of Linkusdt we see the price in the fitfth wave of wave 3 . and will be touch the 25$ so by using the stop lost trategy we tought about long position

February Crab Repeat, Channel drop into TriangleLink went to the all time high 36$ range in Feb and channel A dropped into triangle A.
it broke the triangle into another channel upward to break a new previous high which was the 44$ range and we're seeing a similar triangle drop where we may range sideways for months after dropping from channel B into triangle B.
BEARISH
