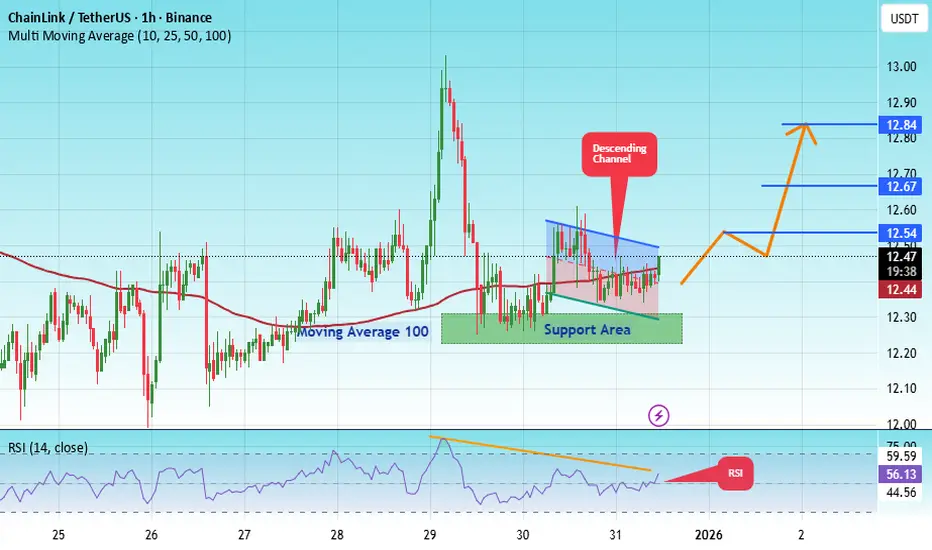
#LINK/USDT – Triangle Pattern Breakout Loading?#LINK
The price is moving within a descending channel on the hourly timeframe. It has reached the lower boundary and is heading towards a breakout, with a retest of the upper boundary expected.
The Relative Strength Index (RSI) is showing a downward trend, approaching the lower boundary, and an upward bounce is anticipated.
There is a key support zone in green at 11.75, and the price has bounced from this level several times. Another bounce is expected.
The indicator is showing a trend towards consolidation above the 100-period moving average, which we are approaching, supporting the upward move.
Entry Price: 11.95
First Target: 12.10
Second Target: 12.38
Third Target: 12.69
Stop Loss: Below the green support zone.
Remember this simple thing: Money management.
For any questions, please leave a comment.
Thank you.
LINKBTC

#LINK/USDT in upward mood !#LINK
The price is moving in a descending channel on the 1-hour timeframe. It has reached the lower boundary and is heading towards breaking above it, with a retest of the upper boundary expected.
We have a downtrend on the RSI indicator, which has reached near the lower boundary, and an upward rebound is expected.
There is a key support zone in green at 12.26. The price has bounced from this zone multiple times and is expected to bounce again.
We have a trend towards stability above the 100-period moving average, as we are moving close to it, which supports the upward movement.
Entry price: 12.43
First target: 12.67
Second target: 12.54
Third target: 12.47
Stop loss: Below the support zone in green.
Don't forget a simple thing: capital management.
For inquiries, please leave a comment.
Thank you.

#LINK/USDT – Triangle Pattern Breakout Loading?#LINK
The price is moving in a descending channel on the 1-hour timeframe. It has reached the lower boundary and is heading towards breaking above it, with a retest of the upper boundary expected.
We have a downtrend on the RSI indicator, which has reached near the lower boundary, and an upward rebound is expected.
There is a key support zone in green at 12.26. The price has bounced from this zone multiple times and is expected to bounce again.
We have a trend towards stability above the 100-period moving average, as we are moving close to it, which supports the upward movement.
Entry price: 12.43
First target: 12.67
Second target: 12.54
Third target: 12.47
Stop loss: Below the support zone in green.
Don't forget a simple thing: capital management.
For inquiries, please leave a comment.
Thank you.
#LINK/USDT – Triangle Pattern Breakout Loading?#LINK
The price is moving in a descending channel on the 1-hour timeframe. It has reached the lower boundary and is heading towards breaking above it, with a retest of the upper boundary expected.
We have a downtrend on the RSI indicator, which has reached near the lower boundary, and an upward rebound is expected.
There is a key support zone in green at 12.00. The price has bounced from this level multiple times and is expected to bounce again.
We have a trend towards consolidation above the 100-period moving average, as we are moving close to it, which supports the upward movement.
Entry price: 12.21
First target: 12.38
Second target: 12.62
Third target: 12.93
Don't forget a simple principle: money management.
Place your stop-loss below the support zone in green.
For any questions, please leave a comment.
Thank you.

Link USD LONG IDEA. (BULLISH ORDER FLOW)Market Structure Context
Overall structure remains bullish (higher highs & higher lows).
Recent downside move is corrective, not impulsive.
No bearish break of structure on the higher timeframe → trend intact.
Key Zones (Institutional Interest)
Bullish Order Block at the origin of the last impulsive up-move.
⚠️ Disclaimer
This setup assumes normal market conditions.
Avoid trading during major news releases.
LINKUSDT UPDATE#LINK
UPDATE
LINK Technical Setup
Pattern: Falling Wedge Pattern
Current Price: $14.49
Target Price: $17.44
Target % Gain: 131.85%
Technical Analysis: LINK is breaking out of a falling wedge pattern on the 1D chart, signaling a bullish reversal after a prolonged downtrend. Price has compressed within the wedge structure and is now pushing above the descending resistance trendline, indicating increasing buying pressure. The breakout structure suggests a potential continuation move toward the projected target zone, provided price maintains strength above the breakout area and holds key support levels.
Time Frame: 1D
Risk Management Tip: Always use proper risk management.

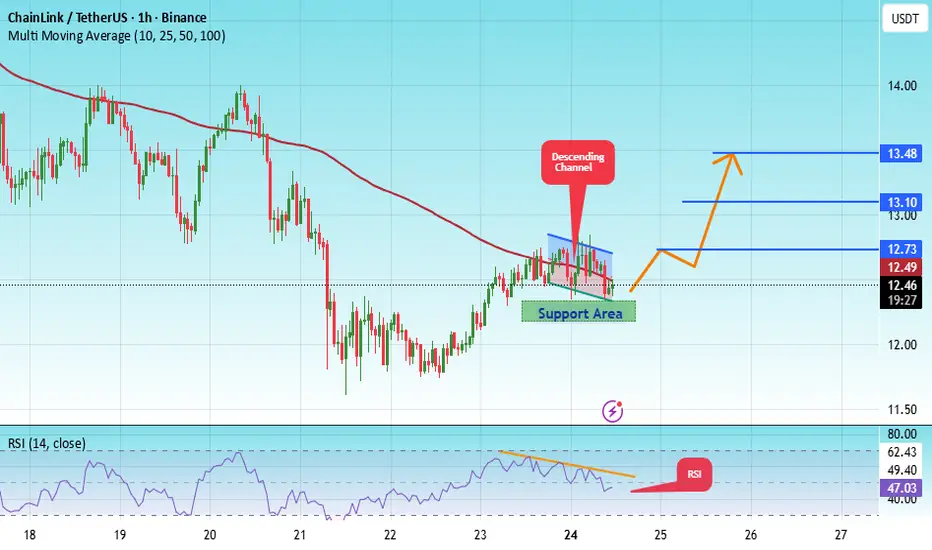
#LINK/USDT LONG SIGNAL#LINK
The price is moving within an ascending channel on the 1-hour timeframe and is adhering to it well. It is poised to break out strongly and retest the channel.
We have a downtrend line on the RSI indicator that is about to break and retest, which supports the upward move.
There is a key support zone in green at 12.27, representing a strong support point.
We have a trend to stabilize above the 100-period moving average.
Entry price: 12.48
First target: 12.73
Second target: 13.10
Third target: 13.48
Don't forget a simple money management rule:
Place your stop-loss order below the green support zone.
Once the first target is reached, save some money and then change your stop-loss order to an entry order.
For any questions, please leave a comment.
Thank you.
LINKPrice is still trading below the descending trendline, and the lower highs and lower lows structure suggests bearish momentum remains dominant. If the 14 دلار support breaks, the move toward 12.50 دلار becomes likely, while a breakout above the trendline may open the path to 15.30 دلار.
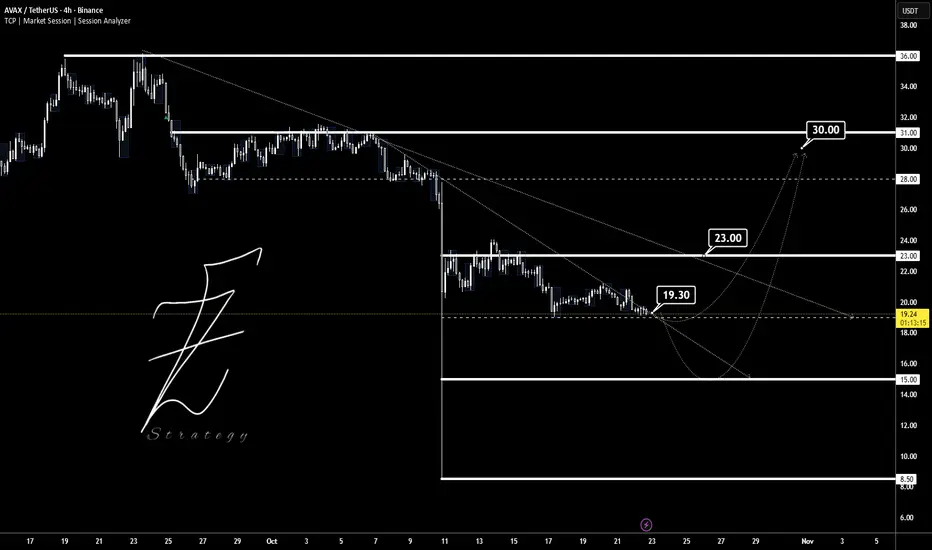
AVAXUSDTThis chart is The try that breakout trendline to way in 30$ target.
Supports: 19 - 15 -8.5
Resistance: 23 - 30 - 36
⚠️ Please control money management.
BINANCE:AVAXUSDT
LINK FOR BUYHello friends
After a long time of suffering, Link finally made a move and collected good liquidity that can make it prone to good growth. And the safest way, as I always tell you, is to buy in stages and with respect to capital and risk management.
The goals are also clear
*Trade safely with us*

LINKUSD – Bullish Impulse Toward D-Point Target
LINKUSDT:
Title: LINKUSD – Bullish Impulse Toward D-Point Target
Price action has completed a corrective ABC structure, finding strong support at point C. The current breakout above mid-structure resistance confirms bullish momentum, aiming toward the D-point completion. Risk is managed below the breakout zone, with potential for trend continuation if price sustains above local support.
Risk Management Notes:
– Entry aligned with breakout confirmation
– Stop-loss below structural support (C-area)
– Take-profit near projected D-point completion

LINKUSDTLast week BINANCE:LINKUSDT , after touching 24.80 dollars 🚀, the price failed to hold and moved into correction. The overall structure still shows a range between key support and resistance, with compression signaling the potential start of the next trend. Currently, momentum leans slightly bearish 📉, but the market has not yet confirmed a clear direction.
Key Levels:
Initial support: 23.18 dollars 🛡️
Next supports: 22.50 dollars – 21.60 dollars
Nearby resistance: 24.40 dollars
Higher resistances: 25.20 dollars – 26.50 to 27.50 dollars 🎯

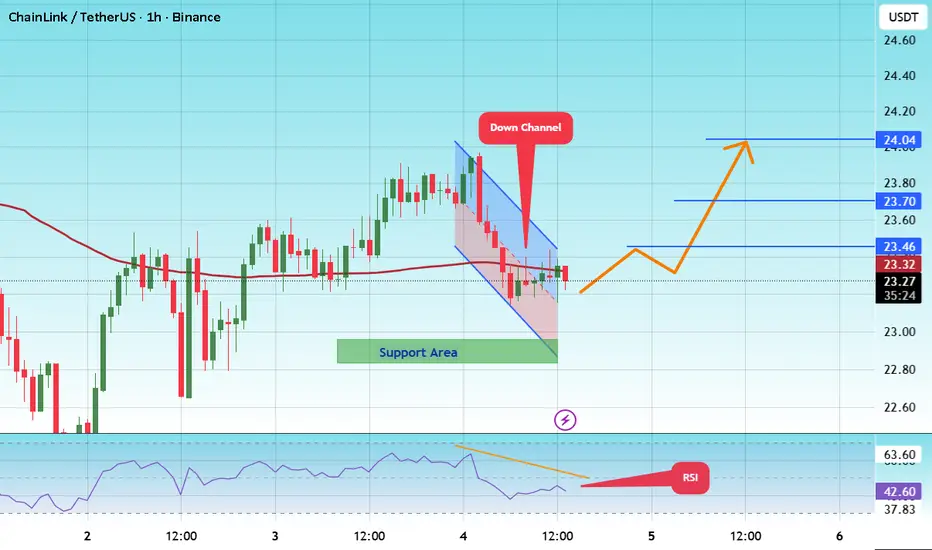
#LINK/USDT – Triangle Pattern Breakout Loading?#LINK
The price is moving within a descending channel on the 1-hour frame and is expected to break and continue upward.
We have a trend to stabilize above the 100 moving average once again.
We have a downtrend on the RSI indicator that supports the upward move with a breakout.
We have a support area at the lower boundary of the channel at 23.00, acting as strong support from which the price can rebound.
We have a major support area in green that pushed the price higher at 23.00.
Entry price: 23.26
First target: 23.46
Second target: 23.70
Third target: 24.00
To manage risk, don't forget stop loss and capital management.
When you reach the first target, save some profits and then change the stop order to an entry order.
For inquiries, please comment.
Thank you.
Chainlink vs Bitcoin (LINKBTC) · The Bear Market is OverRecently LINKBTC hit the lowest price since May 2019. This was the straw that broke the camels back, so to speak. Chainlink couldn't take it anymore and market conditions are starting to change. We are seeing a full breakdown of a long-term bearish structure, the end of the bearish cycle and downtrend.
Coincidentally, the same zone that worked as support now happened to be the zone that launched LINKBTC's 2019-2020 major bull market and bullish cycle. A cycle that produced total growth resulting in 16,912%. See the chart:
Here is a closer look at the weekly timeframe:
See how LINKBTC is trading above EMA55 and EMA89 recently, after the lowest prices in more than six years, making this a very strong bullish recovery signal.
A falling wedge pattern has been broken as well with its local downtrend line. If LINKBTC can stay above EMA89 we can expect extraordinary growth. Growth that will not last only a few days or weeks but growth that can last for years or in the least several months.
Look again at this chart. It doesn't say that an entire cycle has to unravel fast, emergency mode in a hurry in two months, no! It doesn't say so. The chart shows bottom prices, an early recovery and plenty of room available for long-term growth. Something similar to 2019-2020. A long-term bull market.
Namaste.

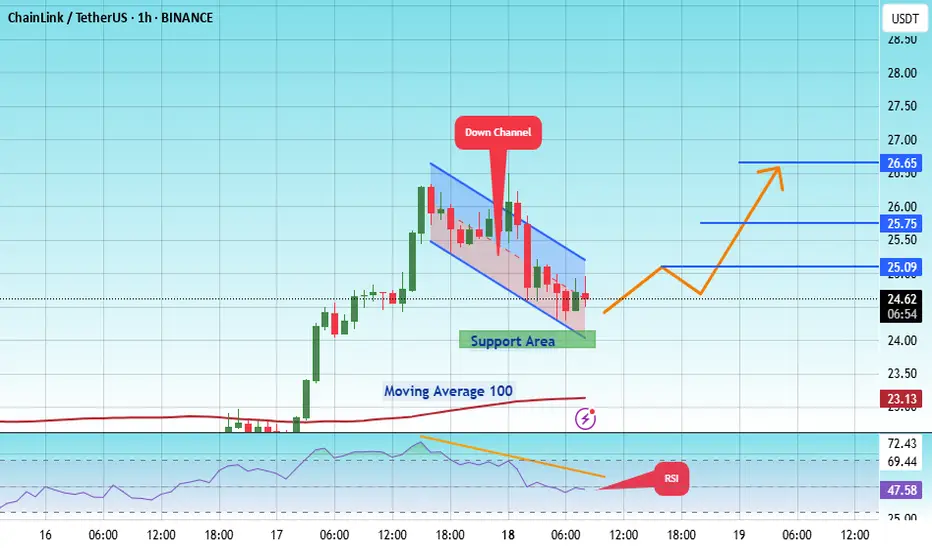
#LINK/USDT in upward mood !#LINK
The price is moving within an ascending channel on the 1-hour frame, adhering well to it, and is on track to break it strongly upwards and retest it.
We have support from the lower boundary of the ascending channel, at 24.20.
We have a downtrend on the RSI indicator that is about to break and retest, supporting the upside.
There is a major support area in green at 24.00, which represents a strong basis for the upside.
Don't forget a simple thing: ease and capital.
When you reach the first target, save some money and then change your stop-loss order to an entry order.
For inquiries, please leave a comment.
We have a trend to hold above the 100 Moving Average.
Entry price: 24.60.
First target: 25.09.
Second target: 25.75.
Third target: 26.65.
Don't forget a simple thing: ease and capital.
When you reach your first target, save some money and then change your stop-loss order to an entry order.
For inquiries, please leave a comment.
Thank you.
LINKUSDTThis chart is in a bullish trend, but it broke a new high at $22.7. If BINANCE:LINKUSDT can keep the price above $20, we can expect it to reach a higher high.
Please control risk management.⚠️

$LINK is up 54% from recent lows, now at $24. CRYPTOCAP:LINK is up 54% from recent lows, now at $24. Price is consolidating after the strong rally — holding above $20 could sustain momentum toward $28–$32, while losing this zone risks a deeper correction back to $15.

Why I'm long on LINK 3 reason backed by chart LINK/USDT – Monthly Chart Analysis
Chainlink is currently testing a multi-year resistance line that has capped price since the 2021 peak. The asset has been forming a large ascending triangle pattern with higher lows since mid-2022, showing accumulation pressure building up.
Resistance Zone: $27–$35
Current Price: $23.94
Support Trendline: Holding strong since 2019 lows
Structure: Bullish compression into resistance
Key Takeaways:
A monthly close above the resistance line could trigger a breakout towards $35–$50 in the medium term.
Until the breakout is confirmed, expect possible rejections and retests of the $20–$21 zone.
The risk/reward is attractive for spot investors looking for a breakout play.
📌 Watch the monthly close carefully — confirmation above resistance could mark the start of a strong LINK rally.

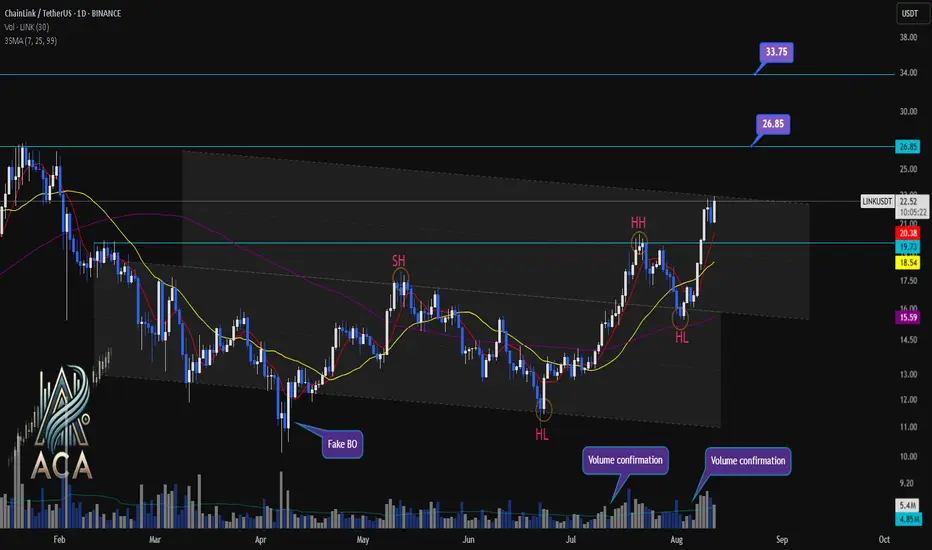
CHAINLINKUSDT Daily Chart Analysis | Channel BreakoutCHAINLINKUSDT Daily Chart Analysis | Channel Breakout & Bullish Momentum
🔍 Let’s dive into the ChainLink/USDT spot chart, analyzing key swings, channel dynamics, and fresh momentum signals for a bullish scenario.
⏳ 1-Day Overview
The daily chart shows LINKUSDT surging toward the RR1 (Risk-Reward 1) of its channel pattern, marked by powerful volume confirmations that help validate the move. Price has decisively broken above prior resistance zones and continues to print higher highs (HH) and higher lows (HL). The chart’s swing structure is clear: a series of ascending pivots signaling a bullish reversal from past lows.
🔺 Channel, Swings & Momentum:
- Price action is respecting the well-defined channel; current breakout and move to RR1 highlights bullish control.
- Swings are established: recent HL and HH confirm upward structure.
- Volume spikes on breakouts further confirm buyer strength, supporting the move out of consolidation.
- 3SMA (7, 25, 99) alignment shows short- and medium-term averages crossing above the long-term trend—often a leading indicator for the start of a strong uptrend.
- Next targeted levels stand at $26.85 and $33.75, while the long-term target remains a fresh All-Time High (ATH), should momentum persist.
- Past “Fake BO” (breakout) risk now superseded by true volume-backed move supported by technical confirmations.
📊 Key Highlights:
- Channel breakout with confirmation at RR1, swing HH/HL structure for bullish momentum.
- Volume surges on upward moves—critical for authenticating breakout strength.
- 3SMA configuration points to the potential beginning of a major trend extension.
- Upside targets: $26.85 for the next level, $33.75 as extension, and new ATH as the bold long-term bull case.
🚨 Conclusion:
ChainLink’s breakout above channel resistance signals bullish intent with strong volume and swing confirmation. Eyes on next targets: $26.85 and $33.75. If volume and trend continue, new ATH is on the horizon.
#LINK/USDT targeting 17.77 $ ?#LINK
The price is moving within a descending channel on the 1-hour frame and is expected to break and continue upward.
We have a trend to stabilize above the 100 moving average once again.
We have a downtrend on the RSI indicator that supports the upward break.
We have a support area at the lower boundary of the channel at 15.60, acting as strong support from which the price can rebound.
We have a major support area in green that pushed the price higher at 15.30.
Entry price: 15.84
First target: 16.47
Second target: 17.00
Third target: 17.77
To manage risk, don't forget stop loss and capital management.
When you reach the first target, save some profits and then change the stop order to an entry order.
For inquiries, please comment.
Thank you.

LINK : You want the link for the pump?Hello friends🙌
✅considering the recent market decline, the LINK market has also fallen like other currencies, and many of you are afraid that this is the end and the rise is over or is there still a rise?
✅Well, as we have indicated on the chart, after the price fell to the support area marked with Fibonacci, a double bottom pattern was formed and then the price was increased by buyers.
✅In this wave, we drew another Fibonacci and identified the area where the price pulled back, and we believe this currency has good potential for growth.
✅Now you can buy in steps in the specified areas with capital and risk management and move to the specified targets.
🔥Follow us for more signals🔥
*Trade safely with us*

LINK - The sleeping Giant ready to wake!Don't forget to add LINK to your watchlist — it's a solid project with long-term investment potential.
The weekly chart shows that LINK is currently retesting the downtrend line it recently broke — a textbook bullish retest.
The lower trendline now acts as a key support level, and as long as price holds above it, the structure remains healthy.
Currently trading around $17.6, the price hasn’t moved significantly yet —
You’ve got:
✅ A strong fundamental project
✅ A bullish technical setup
✅ Large market cap
✅ Still early entry
What more do you need to enter?
Accumulate now... and thank me later.
Best Regards:
Ceciliones🎯

LINK to 30$ or more?Hi Padawans,
Hope you’re doing well.
I’m anticipating some good short scalp opportunities around the levels marked in the chart.
Do your own research padawans.
Best regards,
Crypto Obi
