#LINK/USDT#LINK
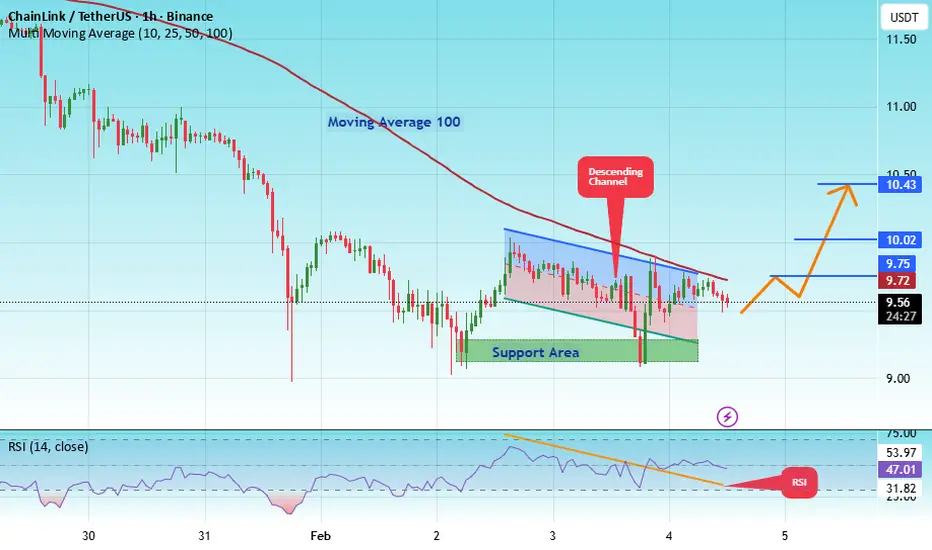
The price is moving within a descending channel on the hourly timeframe. It has reached the lower boundary and is heading towards a breakout, with a retest of the upper boundary expected.
The Relative Strength Index (RSI) is showing a downward trend, approaching the lower boundary, and an upward bounce is anticipated.
There is a key support zone in green at 9.18, and the price has bounced from this level several times. Another bounce is expected.
The indicator is showing a trend towards consolidation above the 100-period moving average, which we are approaching, supporting the upward move.
Entry Price: 9.55
First Target: 9.72
Second Target: 10.02
Third Target: 10.43
Stop Loss: Below the green support zone.
Remember this simple thing: Money management.
For any questions, please leave a comment.
Thank you.
Linkbtclong
#LINK/USDT – Triangle Pattern Breakout Loading?#LINK
The price is moving within a descending channel on the hourly timeframe. It has reached the lower boundary and is heading towards a breakout, with a retest of the upper boundary expected.
The Relative Strength Index (RSI) is showing a downward trend, approaching the lower boundary, and an upward bounce is anticipated.
There is a key support zone in green at 11.75, and the price has bounced from this level several times. Another bounce is expected.
The indicator is showing a trend towards consolidation above the 100-period moving average, which we are approaching, supporting the upward move.
Entry Price: 11.95
First Target: 12.10
Second Target: 12.38
Third Target: 12.69
Stop Loss: Below the green support zone.
Remember this simple thing: Money management.
For any questions, please leave a comment.
Thank you.

#LINK/USDT in upward mood !#LINK
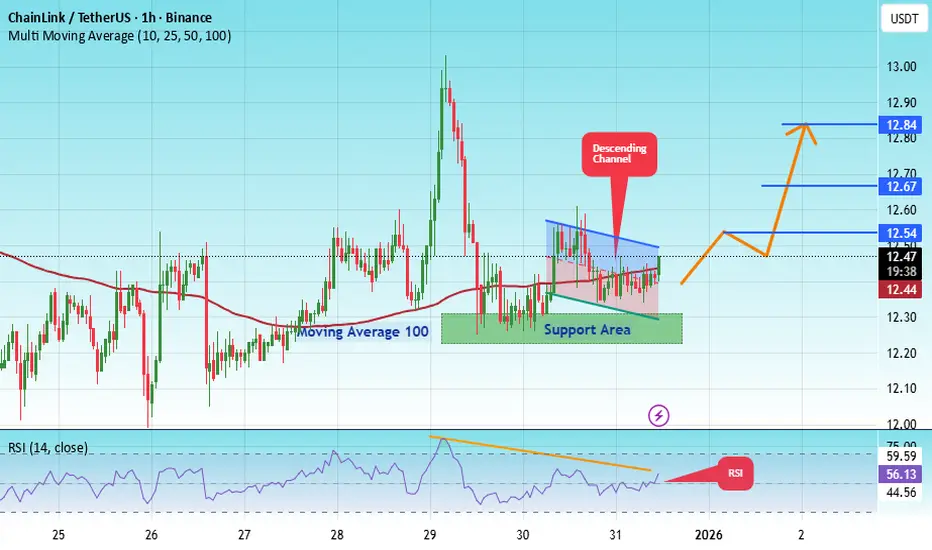
The price is moving in a descending channel on the 1-hour timeframe. It has reached the lower boundary and is heading towards breaking above it, with a retest of the upper boundary expected.
We have a downtrend on the RSI indicator, which has reached near the lower boundary, and an upward rebound is expected.
There is a key support zone in green at 12.26. The price has bounced from this zone multiple times and is expected to bounce again.
We have a trend towards stability above the 100-period moving average, as we are moving close to it, which supports the upward movement.
Entry price: 12.43
First target: 12.67
Second target: 12.54
Third target: 12.47
Stop loss: Below the support zone in green.
Don't forget a simple thing: capital management.
For inquiries, please leave a comment.
Thank you.

#LINK/USDT – Triangle Pattern Breakout Loading?#LINK
The price is moving in a descending channel on the 1-hour timeframe. It has reached the lower boundary and is heading towards breaking above it, with a retest of the upper boundary expected.
We have a downtrend on the RSI indicator, which has reached near the lower boundary, and an upward rebound is expected.
There is a key support zone in green at 12.26. The price has bounced from this zone multiple times and is expected to bounce again.
We have a trend towards stability above the 100-period moving average, as we are moving close to it, which supports the upward movement.
Entry price: 12.43
First target: 12.67
Second target: 12.54
Third target: 12.47
Stop loss: Below the support zone in green.
Don't forget a simple thing: capital management.
For inquiries, please leave a comment.
Thank you.
#LINK/USDT – Triangle Pattern Breakout Loading?#LINK
The price is moving in a descending channel on the 1-hour timeframe. It has reached the lower boundary and is heading towards breaking above it, with a retest of the upper boundary expected.
We have a downtrend on the RSI indicator, which has reached near the lower boundary, and an upward rebound is expected.
There is a key support zone in green at 12.00. The price has bounced from this level multiple times and is expected to bounce again.
We have a trend towards consolidation above the 100-period moving average, as we are moving close to it, which supports the upward movement.
Entry price: 12.21
First target: 12.38
Second target: 12.62
Third target: 12.93
Don't forget a simple principle: money management.
Place your stop-loss below the support zone in green.
For any questions, please leave a comment.
Thank you.

#LINK/USDT LONG SIGNAL#LINK
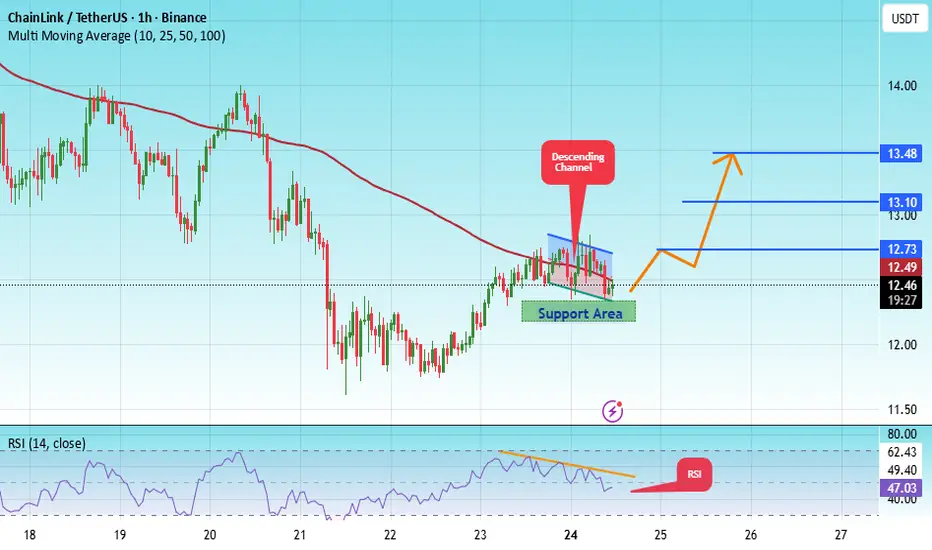
The price is moving within an ascending channel on the 1-hour timeframe and is adhering to it well. It is poised to break out strongly and retest the channel.
We have a downtrend line on the RSI indicator that is about to break and retest, which supports the upward move.
There is a key support zone in green at 12.27, representing a strong support point.
We have a trend to stabilize above the 100-period moving average.
Entry price: 12.48
First target: 12.73
Second target: 13.10
Third target: 13.48
Don't forget a simple money management rule:
Place your stop-loss order below the green support zone.
Once the first target is reached, save some money and then change your stop-loss order to an entry order.
For any questions, please leave a comment.
Thank you.
LINKPrice is still trading below the descending trendline, and the lower highs and lower lows structure suggests bearish momentum remains dominant. If the 14 دلار support breaks, the move toward 12.50 دلار becomes likely, while a breakout above the trendline may open the path to 15.30 دلار.
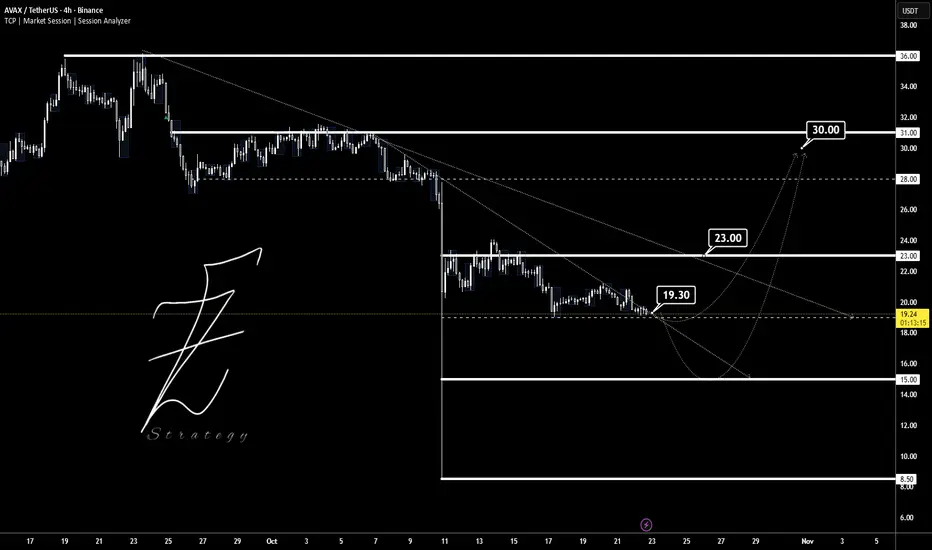
AVAXUSDTThis chart is The try that breakout trendline to way in 30$ target.
Supports: 19 - 15 -8.5
Resistance: 23 - 30 - 36
⚠️ Please control money management.
BINANCE:AVAXUSDT
LINK FOR BUYHello friends
After a long time of suffering, Link finally made a move and collected good liquidity that can make it prone to good growth. And the safest way, as I always tell you, is to buy in stages and with respect to capital and risk management.
The goals are also clear
*Trade safely with us*

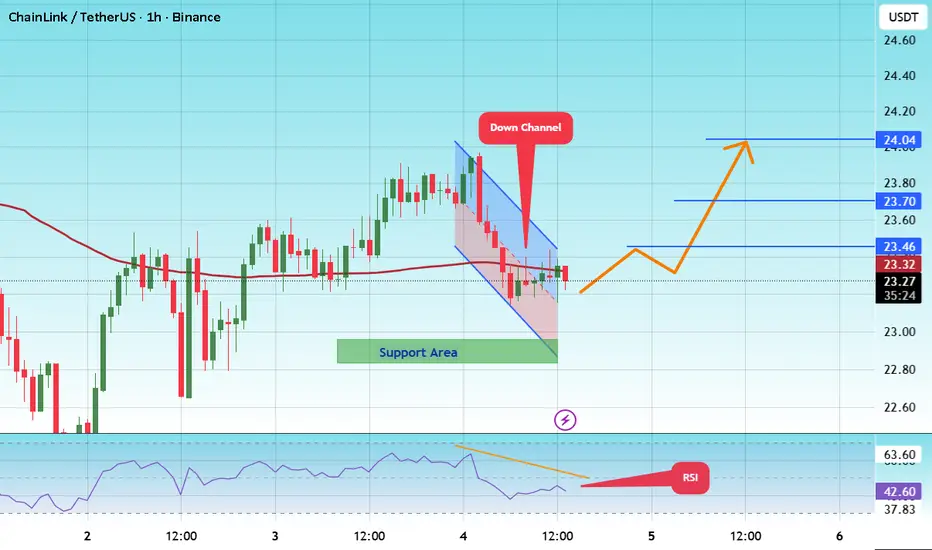
#LINK/USDT – Triangle Pattern Breakout Loading?#LINK
The price is moving within a descending channel on the 1-hour frame and is expected to break and continue upward.
We have a trend to stabilize above the 100 moving average once again.
We have a downtrend on the RSI indicator that supports the upward move with a breakout.
We have a support area at the lower boundary of the channel at 23.00, acting as strong support from which the price can rebound.
We have a major support area in green that pushed the price higher at 23.00.
Entry price: 23.26
First target: 23.46
Second target: 23.70
Third target: 24.00
To manage risk, don't forget stop loss and capital management.
When you reach the first target, save some profits and then change the stop order to an entry order.
For inquiries, please comment.
Thank you.
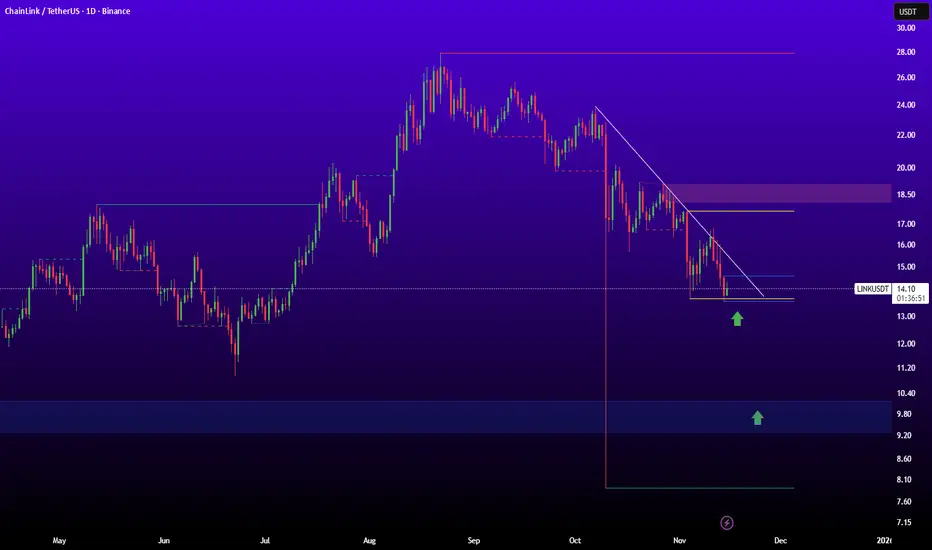
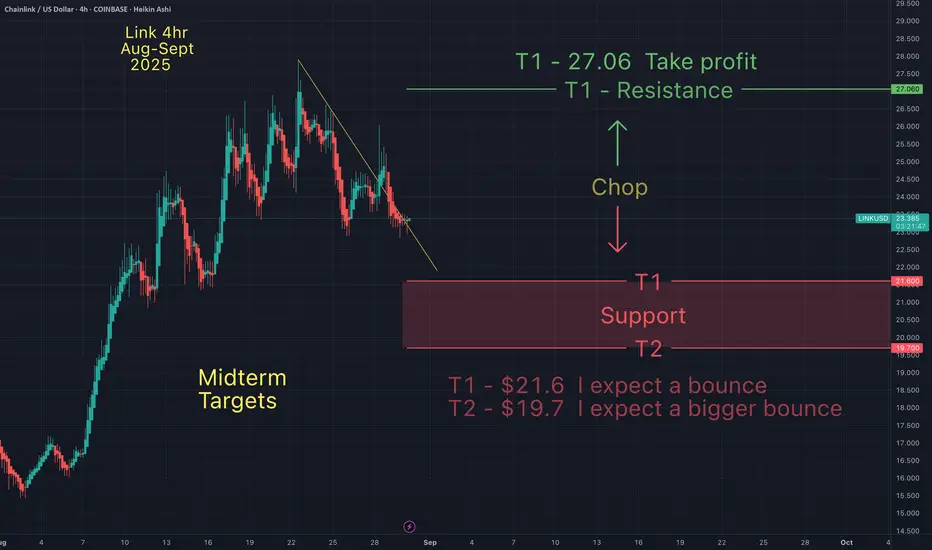
Link - Midterm support and resistance & my take profit targetsRecently, Link has been one of my favorite altcoins to trade. This chart shows my support and resistance levels & my take profits. Until the market reveals its trend duration, I anticipate chop between my support and resistance. But ultimately, these targets represent my ideal entries and exit.
May the trends be with you.
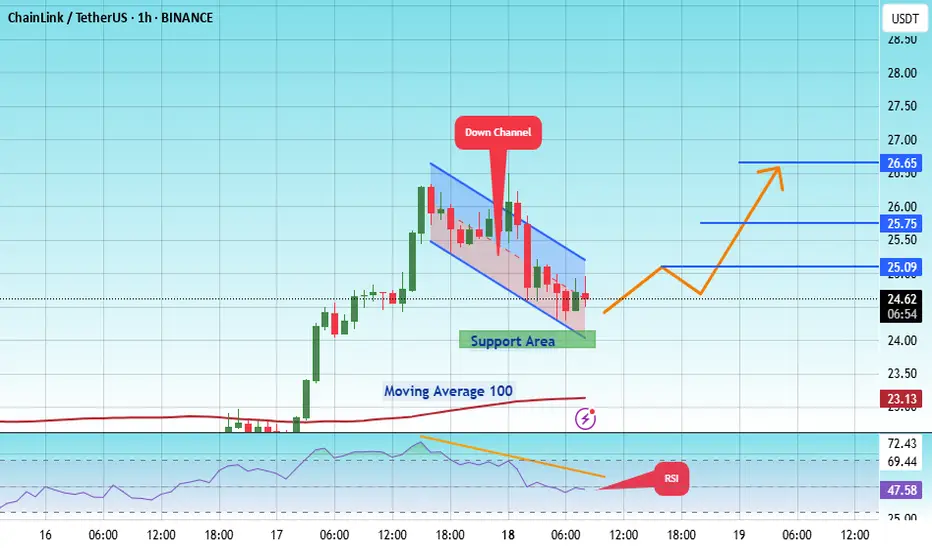
#LINK/USDT in upward mood !#LINK
The price is moving within an ascending channel on the 1-hour frame, adhering well to it, and is on track to break it strongly upwards and retest it.
We have support from the lower boundary of the ascending channel, at 24.20.
We have a downtrend on the RSI indicator that is about to break and retest, supporting the upside.
There is a major support area in green at 24.00, which represents a strong basis for the upside.
Don't forget a simple thing: ease and capital.
When you reach the first target, save some money and then change your stop-loss order to an entry order.
For inquiries, please leave a comment.
We have a trend to hold above the 100 Moving Average.
Entry price: 24.60.
First target: 25.09.
Second target: 25.75.
Third target: 26.65.
Don't forget a simple thing: ease and capital.
When you reach your first target, save some money and then change your stop-loss order to an entry order.
For inquiries, please leave a comment.
Thank you.
LINKUSDTThis chart is in a bullish trend, but it broke a new high at $22.7. If BINANCE:LINKUSDT can keep the price above $20, we can expect it to reach a higher high.
Please control risk management.⚠️

#LINK/USDT targeting 17.77 $ ?#LINK
The price is moving within a descending channel on the 1-hour frame and is expected to break and continue upward.
We have a trend to stabilize above the 100 moving average once again.
We have a downtrend on the RSI indicator that supports the upward break.
We have a support area at the lower boundary of the channel at 15.60, acting as strong support from which the price can rebound.
We have a major support area in green that pushed the price higher at 15.30.
Entry price: 15.84
First target: 16.47
Second target: 17.00
Third target: 17.77
To manage risk, don't forget stop loss and capital management.
When you reach the first target, save some profits and then change the stop order to an entry order.
For inquiries, please comment.
Thank you.

LINKUSDTThis is chart ready for pump but wait for break 14$. BINANCE:LINKUSDT
I in below say best supports and resistance's.
Support:
12.66
11.50
10.50
resistance's:
14
16.68
17.70
⚠️Contorl Risk management for trades.

#LINK/USDT#LINK
The price is moving within a descending channel on the 1-hour frame, adhering well to it, and is heading for a strong breakout and retest.
We are experiencing a rebound from the lower boundary of the descending channel, which is support at 14.50.
We are experiencing a downtrend on the RSI indicator that is about to be broken and retested, supporting the upward trend.
We are looking for stability above the 100 Moving Average.
Entry price: 15.80
First target: 16.45
Second target: 16.90
Third target: 17.56

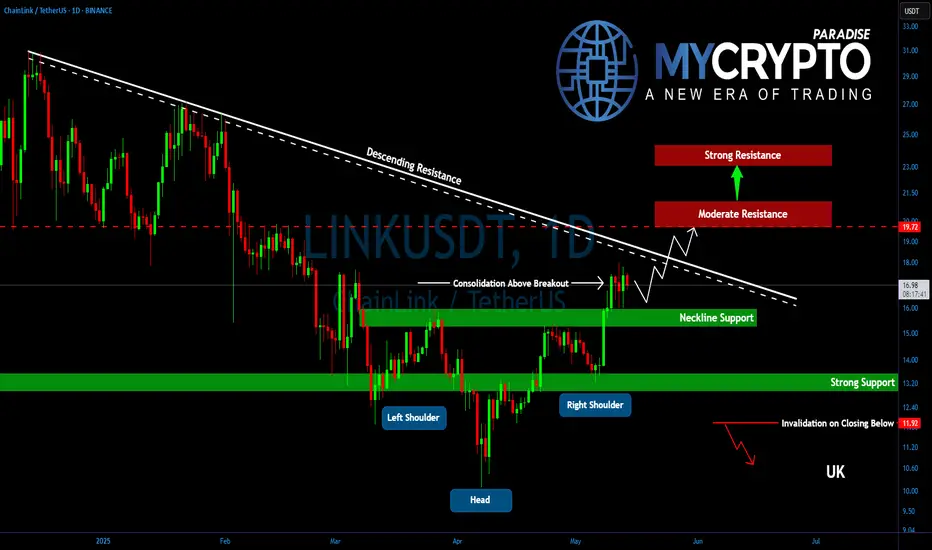
Is LINK Preparing for a Parabolic Rally? Key Levels to WatchYello, Paradisers! After completing its ABC correction, #LINK slipped into a sideways phase — but something significant is brewing beneath the surface. The recent formation of an inverse head and shoulders might be signaling the start of something much bigger.
💎LINK has now confirmed a breakout above the key neckline at $16.00, a critical level that had been capping price action. Following this breakout, the price is holding its ground well and entering a post-breakout consolidation that often acts as the launchpad for the next explosive leg.
💎#LINKUSDT now faces a decisive resistance at $18.50, a trendline rejection point that has held strong since December 2024. A clean break above this level could ignite strong bullish momentum. If bulls succeed, we could see LINK pushing quickly toward the $19.70–$20.30 range, a moderate resistance area, where partial profit-taking is likely from experienced hands.
💎Should momentum persist, the next major upside lies between $23.25–$24.00, the measured target of the inverse head and shoulders breakout. This zone is not just technically significant due to the pattern, it also aligns with the 61.8% Fibonacci retracement, making it a high-confluence resistance.
💎On the downside, LINK has strong support between $16.00–$15.50. This is not only the breakout neckline but also closely aligned with the 50 EMA and 200 EMA, reinforcing this range as a robust demand zone.
Paradisers, strive for consistency, not quick profits. Treat the market as a businessman, not as a gambler.
MyCryptoParadise
iFeel the success🌴
#LINK/USDT#LINK
The price is moving within a descending channel on the 1-hour frame, adhering well to it, and is heading towards a strong breakout and retest.
We are seeing a bounce from the lower boundary of the descending channel, which is support at 14.30.
We have a downtrend on the RSI indicator that is about to be broken and retested, supporting the upward trend.
We are looking for stability above the 100 moving average.
Entry price: 15.00
First target: 15.30
Second target: 15.61
Third target: 15.94

#LINK/USDT
#LINK
The price is moving within a descending channel on the 1-hour frame, adhering well to it, and is heading for a strong breakout and retest.
We are seeing a bounce from the lower boundary of the descending channel, which is support at 12.84.
We have a downtrend on the RSI indicator that is about to break and retest, supporting the upward trend.
We are looking for stability above the 100 Moving Average.
Entry price: 13.33
First target: 13.58
Second target: 13.83
Third target: 14.20

Chainlink $LINK to 17$?⚠️ RISK TRADE ⚠️
👑 #LINK/USDT BUY 👑
Entry price:
13.76 - 14.17 🟩
Targets:
1️⃣14.62🎯
2️⃣15.24🎯
3️⃣16.04🎯
4️⃣17.05🎯

#LINK/USDT#LINK
The price is moving in a descending channel on the 1-hour frame and is expected to continue upwards
We have a trend to stabilize above the moving average 100 again
We have a descending trend on the RSI indicator that supports the rise by breaking it upwards
We have a support area at the lower limit of the channel at a price of 20.00
Entry price 20.64
First target 21.70
Second target 23.46
Third target 25.20

LINK at the Crossroads: Is a Massive Breakout Coming?Yello, Paradisers! Have you been watching #LINKUSDT closely? It just made a bold move, breaking out of a falling wedge pattern, signaling potential strength ahead. But the big question is—can the bulls finally break through the chains and push this higher, or will it get stuck in the same range it's been trapped in since December 2024? Let’s break it down.
💎Currently, #LINK is battling the tough resistance zone between $27.05 and $28.25—a region that has repeatedly blocked upward momentum. For any strength to sustain, LINK needs to conquer and sustain above $28.25. If the bulls succeed, the road ahead looks juicy! We’re talking about a target at the 52-week high of $30.95, with a stretch goal of $32.00, perfectly aligning with the 1.272% Fibonacci extension and the pattern’s target length.
💎On the flip side, the $23.80–$23.30 zone is providing moderate support. This level isn’t just a safety net; it’s fortified by the presence of the EMA-100 and EMA-50, making it a stronghold against any downside pressure. If the bears try to bring the price down, this area could act as a solid barrier, protecting LINK from deeper corrections.
Patience and discipline are key here, Paradisers. The market often tests both bulls and bears before making decisive moves, so stay vigilant.
MyCryptoParadise
iFeel the success🌴

#LINK/USDT#LINK
The price is moving in a descending channel on the 1-hour frame and is expected to continue upwards
We have a trend to stabilize above the moving average 100 again
We have a descending trend on the RSI indicator that supports the rise by breaking it upwards
We have a support area at the lower limit of the channel at a price of 18.70
Entry price 20.33
First target 21.63
Second target 23.13
Third target 24.70
