#LINK/USDT – Triangle Pattern Breakout Loading?#LINK
The price is moving within a descending channel on the hourly timeframe. It has reached the lower boundary and is heading towards a breakout, with a retest of the upper boundary expected.
The Relative Strength Index (RSI) is showing a downward trend, approaching the lower boundary, and an upward bounce is anticipated.
There is a key support zone in green at 11.75, and the price has bounced from this level several times. Another bounce is expected.
The indicator is showing a trend towards consolidation above the 100-period moving average, which we are approaching, supporting the upward move.
Entry Price: 11.95
First Target: 12.10
Second Target: 12.38
Third Target: 12.69
Stop Loss: Below the green support zone.
Remember this simple thing: Money management.
For any questions, please leave a comment.
Thank you.
Linkchain

#LINK/USDT – Triangle Pattern Breakout Loading?#LINK
The price is moving in a descending channel on the 1-hour timeframe. It has reached the lower boundary and is heading towards breaking above it, with a retest of the upper boundary expected.
We have a downtrend on the RSI indicator, which has reached near the lower boundary, and an upward rebound is expected.
There is a key support zone in green at 12.00. The price has bounced from this level multiple times and is expected to bounce again.
We have a trend towards consolidation above the 100-period moving average, as we are moving close to it, which supports the upward movement.
Entry price: 12.21
First target: 12.38
Second target: 12.62
Third target: 12.93
Don't forget a simple principle: money management.
Place your stop-loss below the support zone in green.
For any questions, please leave a comment.
Thank you.

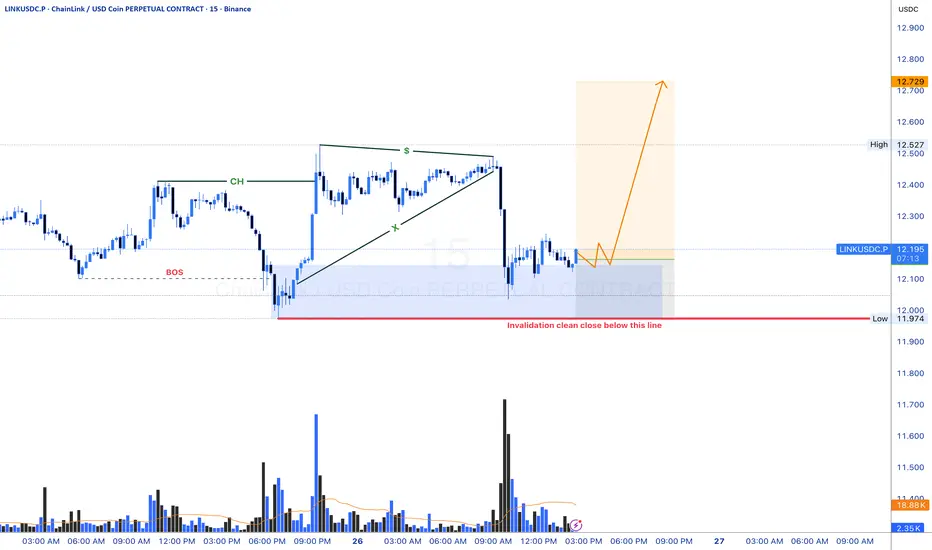
Link USD LONG IDEA. (BULLISH ORDER FLOW)Market Structure Context
Overall structure remains bullish (higher highs & higher lows).
Recent downside move is corrective, not impulsive.
No bearish break of structure on the higher timeframe → trend intact.
Key Zones (Institutional Interest)
Bullish Order Block at the origin of the last impulsive up-move.
⚠️ Disclaimer
This setup assumes normal market conditions.
Avoid trading during major news releases.
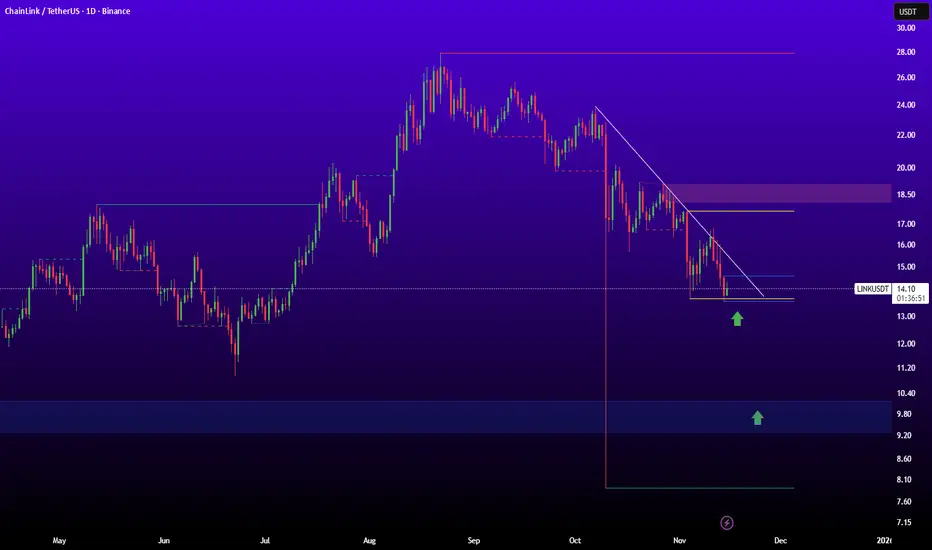
LINKPrice is still trading below the descending trendline, and the lower highs and lower lows structure suggests bearish momentum remains dominant. If the 14 دلار support breaks, the move toward 12.50 دلار becomes likely, while a breakout above the trendline may open the path to 15.30 دلار.
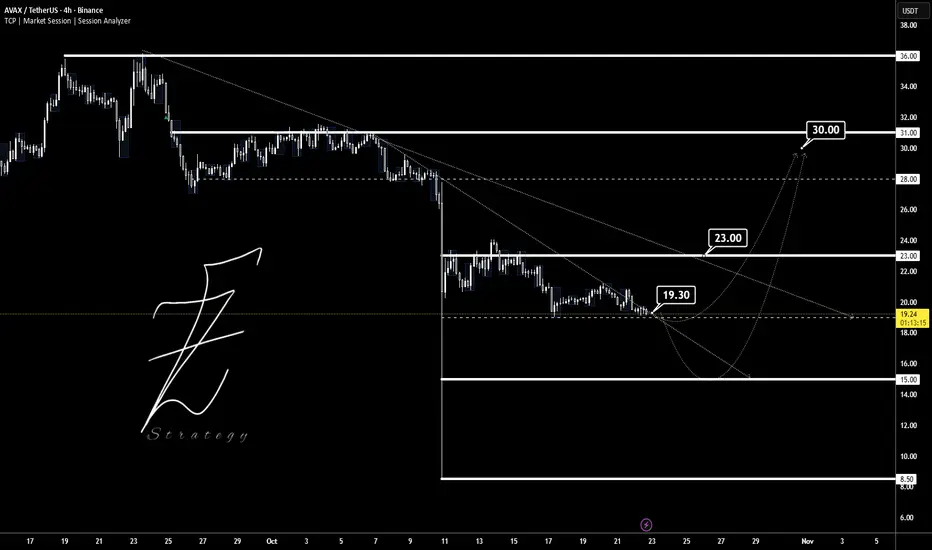
AVAXUSDTThis chart is The try that breakout trendline to way in 30$ target.
Supports: 19 - 15 -8.5
Resistance: 23 - 30 - 36
⚠️ Please control money management.
BINANCE:AVAXUSDT
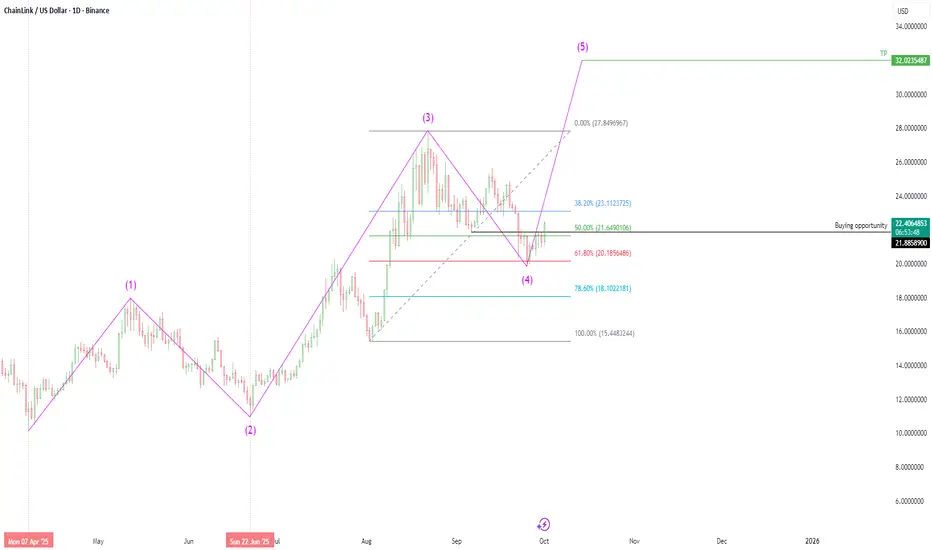
Chainlink (LINK/USD) - Elliott Wave AnalysisBased on Elliott Wave Theory, Chainlink (LINK/USD) appears to have successfully completed its corrective Wave 4, as evidenced by the recent stabilization and reversal patterns observed on the daily timeframe. This completion sets the stage for the anticipated impulsive Wave 5, which is now clearly visible on the daily chart. The structure suggests a continuation of the broader uptrend, with increased momentum likely to drive prices toward higher targets.
LINK/USDT - Ready for Takeoff? Major Bullish Reversal in Play!🚀 Trade Setup Details:
🕯 #LINK/USDT 🔼 Buy | Long 🔼
⌛️ TimeFrame: 1D
--------------------
🛡 Risk Management (Example):
🛡 Based on $10,000 Balance
🛡 Loss-Limit: 1% (Conservative)
🛡 The Signal Margin: $534.47
--------------------
☄️ En1: 20.74 (Amount: $53.45)
☄️ En2: 19.34 (Amount: $187.06)
☄️ En3: 18.4 (Amount: $240.51)
☄️ En4: 17.51 (Amount: $53.45)
--------------------
☄️ If All Entries Are Activated, Then:
☄️ Average.En: 18.87 ($534.47)
--------------------
☑️ TP1: 24.56 (+30.15%) (RR:1.61)
☑️ TP2: 27.87 (+47.69%) (RR:2.55)
☑️ TP3: 32.73 (+73.45%) (RR:3.93)
☑️ TP4: 40.16 (+112.82%) (RR:6.03)
☑️ TP5: 50.34 (+166.77%) (RR:8.91)
☑️ TP6: Open 🔝
--------------------
❌ SL: 15.34 (-18.71%) (-$100)
--------------------
💯 Maximum.Lev: 3X
⌛️ Trading Type: Swing Trading
‼️ Signal Risk: 🙂 Low-Risk! 🙂
🔎 Technical Analysis Breakdown:
This technical analysis is based on Price Action and Smart Money Concepts. All entry points, Target Points, and the Stop Loss are calculated using professional mathematical calculations. As a result, you can have an optimal trade setup based on great risk management.
Technically, LINK is bouncing off key support levels and forming a solid accumulation structure, suggesting strong hands are preparing for a breakout. With multiple confluences aligning — including long-term trend support and bullish divergence — this setup favors patient swing entries with impressive risk-to-reward potential.
📊 Sentiment & Market Context:
Chainlink (LINK) is showing signs of renewed bullish strength following a consolidation phase and broader market resilience. The crypto market has recently seen improved sentiment amid increasing institutional involvement and growing anticipation around real-world asset tokenization — a core use case for Chainlink's oracle solutions.
🔎 About LINK:
Chainlink is a decentralized oracle network that enables smart contracts to securely interact with real-world data. It plays a critical role in DeFi, insurance, gaming, and more — bridging on-chain and off-chain systems. As adoption of decentralized infrastructure grows, LINK continues to position itself as a key infrastructure asset in the blockchain ecosystem
⚠️ Disclaimer:
Trading involves significant risk, and past performance does not guarantee future results. This analysis is for informational purposes only and should not be considered financial advice. Always conduct your research and trade responsibly.
💡 Stay Updated:
Like this technical analysis? Follow me for more in-depth insights, technical setups, and market updates. Let's trade smarter together!

LINK/USDT Weekly FVG Tap
BINANCE:LINKUSDT has arrived right at a strong level that I see as a solid opportunity to enter.
This zone, together with the lower DCA area I highlighted as backup, looks like a prime region to build a spot position on LINK.
I’ll share another update if needed.

Chainlink 4H Update | LINK Testing $23.50My bias is still more upside mid-term. On the 4-hour chart, if LINK reclaims 23.50, the path opens toward 24.83 and 26.71. If it fails and drops below 22.78, the next supports are 21.92 and 21.62. The immediate battle is all about whether buyers can flip 23.50 back in their favor.

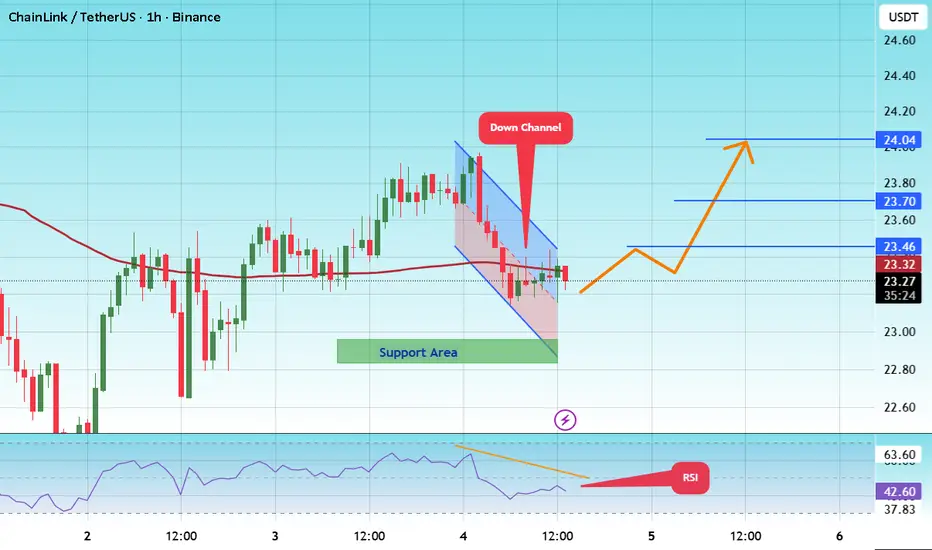
#LINK/USDT – Triangle Pattern Breakout Loading?#LINK
The price is moving within a descending channel on the 1-hour frame and is expected to break and continue upward.
We have a trend to stabilize above the 100 moving average once again.
We have a downtrend on the RSI indicator that supports the upward move with a breakout.
We have a support area at the lower boundary of the channel at 23.00, acting as strong support from which the price can rebound.
We have a major support area in green that pushed the price higher at 23.00.
Entry price: 23.26
First target: 23.46
Second target: 23.70
Third target: 24.00
To manage risk, don't forget stop loss and capital management.
When you reach the first target, save some profits and then change the stop order to an entry order.
For inquiries, please comment.
Thank you.
LINKUSD HIGH PROBABILITY SETUP SOON!!🚨LINKUSD HIGH PROBABILITY BUY SETUP 🚨
* Here We Can See Clearly The Next Potential Moves For LINKUSD Coming Hours/Days.
* Keep Your Eyes Close On Your Trading Positions.
* Happy PIP Hunting Traders.
£ FXKILLA £

Chainlink LINK price analysis#LINK – Possible Breakout Setup?
🔹 Recent news indicates rising institutional interest in #Chainlink
🔹 The rally on OKX:LINKUSDT has been nearly correction-free
🔹 Next short-term targets: $28–31
🔹 Ideal pullback zone: $17–18, above the long-term blue trendline (since 2019)
🔹 If the trend holds, we could see a new impulse wave — possibly with ATH retest
🔍 What's your #LINKUSD target by end of 2025? 👇
______________
◆ Follow us ❤️ for daily crypto insights & updates!
🚀 Don’t miss out on important market moves
🧠 DYOR | This is not financial advice, just thinking out loud.

LINKUSDTThis chart is in a bullish trend, but it broke a new high at $22.7. If BINANCE:LINKUSDT can keep the price above $20, we can expect it to reach a higher high.
Please control risk management.⚠️

LINKUSDTThis is chart ready for pump but wait for break 14$. BINANCE:LINKUSDT
I in below say best supports and resistance's.
Support:
12.66
11.50
10.50
resistance's:
14
16.68
17.70
⚠️Contorl Risk management for trades.

#LINK/USDT#LINK
The price is moving within a descending channel on the 1-hour frame, adhering well to it, and is heading for a strong breakout and retest.
We are experiencing a rebound from the lower boundary of the descending channel, which is support at 14.50.
We are experiencing a downtrend on the RSI indicator that is about to be broken and retested, supporting the upward trend.
We are looking for stability above the 100 Moving Average.
Entry price: 15.80
First target: 16.45
Second target: 16.90
Third target: 17.56

Chainlink $LINK to 17$?⚠️ RISK TRADE ⚠️
👑 #LINK/USDT BUY 👑
Entry price:
13.76 - 14.17 🟩
Targets:
1️⃣14.62🎯
2️⃣15.24🎯
3️⃣16.04🎯
4️⃣17.05🎯

Chainlink LINK price analysisThe 6-year trend line has been keeping the #LINK price “in play” by 4 times
The next is patience and observation.
🆗 As long as the OKX:LINKUSDT price is above the blue trend line, then the medium-term targets of $38 and $53 are still relevant.
_____________________
Did you like our analysis? Leave a comment, like, and follow to get more

LINK Mid TermChainlink (LINK/USDT) Summary Analysis
• Support Zone: $16.00 - $12.64 USDT (strong demand area).
• Resistance Levels: $24.12 USDT (first target) and $35.40 USDT (main target).
• Channel Structure: Price is near the lower band of a descending parallel channel, indicating a potential reversal signal.
Scenarios:
✅ Bullish Scenario: If LINK bounces from $16.00 USDT, targets are $24.12 USDT and $35.40 USDT.
❌ Bearish Scenario: A close below $16.00 USDT could trigger a drop to $12.64 USDT.
Strategy:
🔹 Entry: Buy within the $16.00 - $18.00 USDT range, with a stop loss below $12.64 USDT.
🔹 Breakout: A breakout above $24.12 USDT presents a buying opportunity.
🔹 Sell: A close below $16.00 USDT may accelerate the downtrend.
If the channel breaks out, LINK has significant upside potential. 🚀

LINK - 4H Buy opportunities🚀 BINANCE:LINKUSDT Price Analysis 🌟
Weekly Time Frame: LINK has shown consistent growth after breaking out and consolidating above key zones. Now, it’s consolidating over a crucial support zone, signaling potential for a strong upward move.
Daily Time Frame: Liquidity under $20 has been hunted, setting the stage for a potential bullish flag breakout.
4-Hour Time Frame: A strong support zone around $20 creates two actionable scenarios:
1️⃣ Pullback Entry: Look for a reversal near the $20 support zone to enter.
2️⃣ Breakout Entry: Enter after LINK breaks resistance and confirms the move with a pullback.
📢 Like, follow, and comment for more updates. Stay ahead of the market with actionable insights and expert analysis!

#LINK/USDT#LINK
The price is moving in a descending channel on the 1-hour frame and is expected to continue upwards
We have a trend to stabilize above the moving average 100 again
We have a descending trend on the RSI indicator that supports the rise by breaking it upwards
We have a support area at the lower limit of the channel at a price of 18.70
Entry price 20.33
First target 21.63
Second target 23.13
Third target 24.70

LINK/USDT at Critical Support: Will the Bears Take Over?LINK/USDT is currently trading just above the key marked support zone and has faced rejection twice from the falling trendline.
If the price fails to hold this support, further downside continuation is likely.
Stay tuned for more updates!
DYOR, NFA

LINKUSDT.P | 3 Possible Entries Depends on Your Risk AppetiteLINKUSDT.P | 3 Possible Entry Zones Based on Risk Appetite
Zone 1:
Located below the 0.5 Fibonacci level of the last significant range.
Best suited if the price has spent a considerable amount of time above the range high.
Note: This zone may not be ideal in the current context as the conditions are not fully met.
Zone 2:Second zone is ideal trading area.
Aligns with a previous high and a demand zone confluence, offering a high-probability setup.
Zone 3:
Designed for cases of range low manipulation.
Look for price sweeping the range low before reclaiming it as a potential reversal signal.
For all zones wait for lower time frame market structure breaks upside.
First zone is not optimum I think.
Second zone is ideal trading area.
Third zone can be valuable in case of a market crash.

LINKUSDT | Follow The RiverThe market is going well, especially this trade has become a complete textbook.
Besides that, I still want to scratch a few R's.
There is a nice price flow here, I want to be included in the price from the untested demand zone.
I don't overcomplicate things and add a ton of dirty crap to my charts, but you can check out the success of my analysis below.
I approach trading with confidence backed by experience and past success in identifying high-probability setups.
While I don’t claim to be the best, my track record speaks for itself, and I strive to let my analysis and results do the talking. Watch these levels closely—markets can confirm what charts already whisper. Let’s see how this plays out together.
My Previous Ideas
DOGEUSDT.P | 4 Reward for 1 Risk much more if you hold it.
RENDERUSDT.P | HTF Accuracy
ETHUSDT.P | Accurate Buyer Zone Identification | High Risk Reward if you hold it.
BNBUSDT.P | Accurate Buyer Zone Identification | High Risk Reward if you hold it.
Bitcoin Dominance | Great Characteristic Detection and Accurate Analysis
