Diagonal pattern and completion of the corrective movementIn daily chart wave counting has changed to some extent, it seems the target of the uptrend can be $ 85 in the first stage and then the price level can be extending up to $ 160.
In the 15-minute chart, the Diagonal pattern is clear, which could indicate the completion of the downtrend in wave 2.
Linkchain


LINK/BTC potenial accumulation zoneLINK/BTC
0.0004 area is a potenial accumulation for LINK / BTC pair
If you are patient enough i think this will give nice return for coming weeks or months
trendline support should on weekly TF for continuation
If you see my ideas help you in trading or learning press like & comment & follow
Good luck


LINK Coin in my personal idea (LINKUSDT)LINKUSDT, this coin is in going up trend and as the graph, it will run to ~55.7. by Jun 2021. (TF: day)

Link-The beginning of the uptrend in wave 3As the daily chart shows the price is in the uptrend and in wave iii, which the targets of this uptrend is in the ranges of $ 85 to $ 100 (In the short term).
In the sub-waves of wave 5 from point iii, wave 4 has ended in the range of $ 21, and then, by referring to the 240-minute chart, we can consider the first formed wave as a Leading Diagonal. And its corrective movement has been completed in the range of 23.75, in continuation, the upward trend has started in wave 3, which can be extended up to the target of $ 58.


Chain-link idea Idea for LINKUSD
Believe we will see another 200% move upwards after a rest period that we have been seeing
Using spirals to identify strongest trend within price structure
I think LINK will be a big one

Link is on his last resistance! Waiting for confirmed breakout!Link is hot right now. There is a lot buzzing on twitter and telegram and a lot of buyers and holders are waiting for a pump.
Let's see how it goes. Overall the most people are watching at 50$ it seems. So that will be a price where i look to take profits.
Have a nice day :)

Link targets $40 by the end of the monthThe chart suggests that link may need to undergo a minor correction towards the $25 - $26 mark within the pennant. Thereafter the coin may look to $40 - $41 or possibly much higher if altcoin season starts to cause large inflows into the lower market cap coins.
The problem with coins like Link is that they can bounce really high very unexpectedly due to the fact that they have a relatively small market cap which allows it to double in 2-4 days. Its unlikely to see that happen in BTC with its current market cap.
I don't fully understand the technology behind Link, however, i understand enough to know that it has a big future due to its utility.
Long-term price prediction for Link?
I have no idea but i don't think that its unreasonable to expect a 4X - 6x rise in price and hopefully a lot more within the next 12 -18 months.
I own Link in my speculative portfolio (one of the smaller positions) and i intend on holding it for a long period of time. Its not the price that matters, its the potential utility.
Please like and follow for daily posts on various asset classes. Please also share your views on the trading ideas and whether or not you find them to be of any value to you as a trader.
Please note that cryptocurrencies are speculative assets which carry a very high degree of risk and any speculation in such assets can result in a complete loss of capital. This idea is shared for educational purposes only and should not result in speculative decisions in any digital asset.

LINKUSDT broke its down-trendBINANCE:LINKUSDT is heading to a higher ATH. Heed the call!
Please follow the money management rules.
Good luck.

I added some LINKLINK is currently within a strong uptrend
upward movement on the RSI is expected
Sad that Ethereum isn't moving that much, even on the current state of NTF's lately

LINK further bull actionIchimoku indicators further bullish moves
Inverse H&S is also present
I entered last night into a position in LINK

LINK/USDT : Targeting 38$ BINANCE:LINKUSDT
Hello everyone 😃
LINK had a breakout from 30$ resistance line and MACD had a bullish crossover.
Now there's possible retest on 30$ again !
It could be good to take long for mid-term holding..
📌 It could be possible for link to form a bullish flag on next candles !!
Attention: this isn't financial advice we are just trying to help people on their own vision.
Have a good day!
@Helical_Trades

LINKUSDT Next Target?LINKUSDT (1H CHART) Technical Analysis Update
Flag pttern
LINK/USDT currently trading at $29.36
Buy-level: Only buy after flag pattern breakout ( Above $29.75 )
Stop loss: below $28.00
Target 1: $30.90
Target 2: $32.00
Target 3: $35.00
Max Leverage: 2X
ALWAYS KEEP STOP LOSS...
Follow Our Tradingview Account for More Technical Analysis Updates, | Like, Share and Comment Your thoughts.

Link - A wonderful Cup and HandleBINANCE:LINKUSDT
I can see a nice cup and handle in the Link chart. If this solidified, it will take us all the way to our previous ATH of about $37

LINK Fib ChannelIdea for LINK
Showing multiple touches on critical fib lines
I expect a retrace to the black dotted line following the recent touch of the fib level
From there bullishness continues

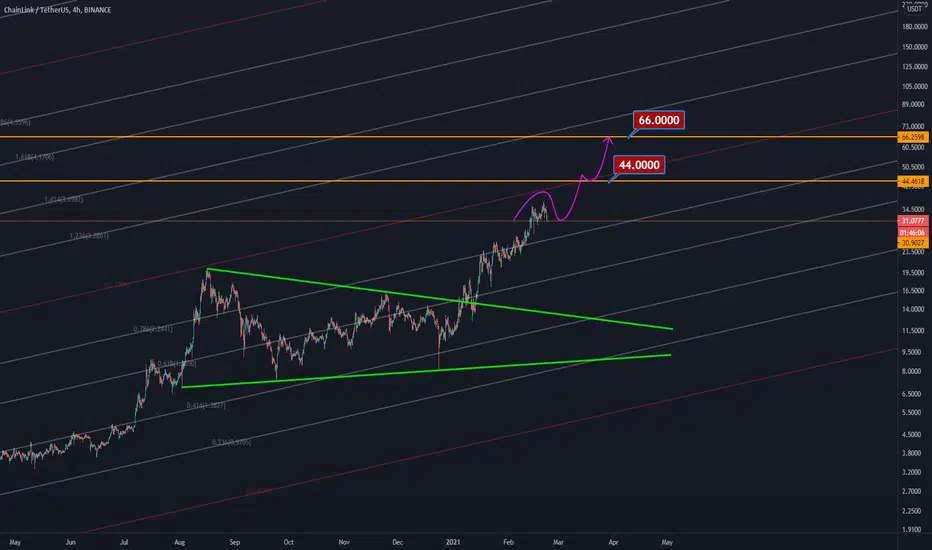
LINK/USDT bullish signals are pretty good!Hi every one
LINK/USDT
the LINK/USDT has formed a symmetrical triangle and also there is a hidden bullish divergence(+HD) as well. with these signals we can come to a concolusion that the price has a better chance of being bullish rather than being bearish! we just have to wait for the upward break out!
Traders, if you liked this idea or have your opinion on it, write in the comments, We will be glad.
Things can change...
The markets are always changing and even with all these signals, the market changes tend to be strong and fast!!
Thank you for seeing idea .
Have a nice day and Good luck


LINK/USDT upward movement explainedHi every one
LINK/USDT
The LINK/USDT has formed an ascending triangle which means the price is about to rise as much as the measured price movement ( AB=CD ) and you can see that the triangle is already broken but the price has not grown that much. we predict that the price would make a pullback to the upper line of the triangle and than continue It's bullish movement
Thank you for seeing idea .
Have a nice day and Good luck.