#LINK/USDT in upward mood !#LINK
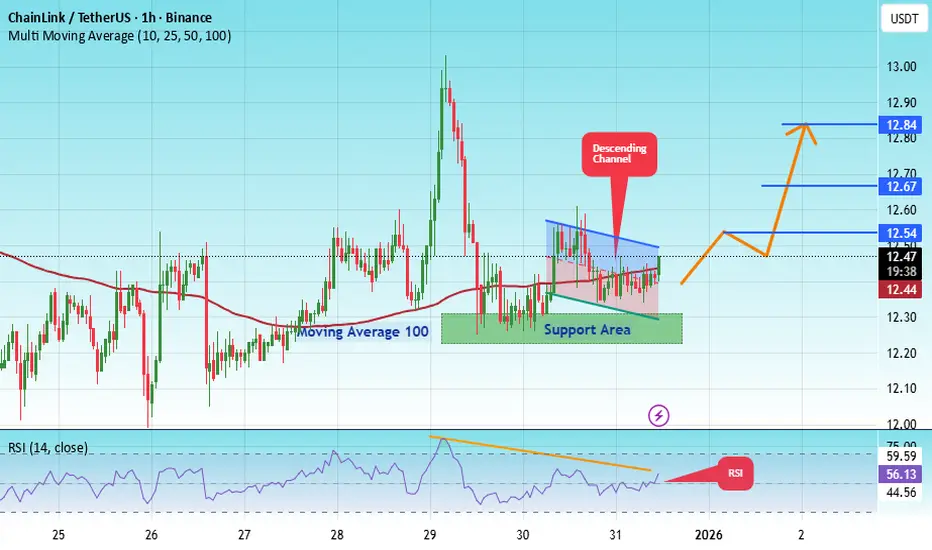
The price is moving in a descending channel on the 1-hour timeframe. It has reached the lower boundary and is heading towards breaking above it, with a retest of the upper boundary expected.
We have a downtrend on the RSI indicator, which has reached near the lower boundary, and an upward rebound is expected.
There is a key support zone in green at 12.26. The price has bounced from this zone multiple times and is expected to bounce again.
We have a trend towards stability above the 100-period moving average, as we are moving close to it, which supports the upward movement.
Entry price: 12.43
First target: 12.67
Second target: 12.54
Third target: 12.47
Stop loss: Below the support zone in green.
Don't forget a simple thing: capital management.
For inquiries, please leave a comment.
Thank you.
Linklong

#LINK/USDT – Triangle Pattern Breakout Loading?#LINK
The price is moving in a descending channel on the 1-hour timeframe. It has reached the lower boundary and is heading towards breaking above it, with a retest of the upper boundary expected.
We have a downtrend on the RSI indicator, which has reached near the lower boundary, and an upward rebound is expected.
There is a key support zone in green at 12.26. The price has bounced from this zone multiple times and is expected to bounce again.
We have a trend towards stability above the 100-period moving average, as we are moving close to it, which supports the upward movement.
Entry price: 12.43
First target: 12.67
Second target: 12.54
Third target: 12.47
Stop loss: Below the support zone in green.
Don't forget a simple thing: capital management.
For inquiries, please leave a comment.
Thank you.
#LINK/USDT – Triangle Pattern Breakout Loading?#LINK
The price is moving in a descending channel on the 1-hour timeframe. It has reached the lower boundary and is heading towards breaking above it, with a retest of the upper boundary expected.
We have a downtrend on the RSI indicator, which has reached near the lower boundary, and an upward rebound is expected.
There is a key support zone in green at 12.00. The price has bounced from this level multiple times and is expected to bounce again.
We have a trend towards consolidation above the 100-period moving average, as we are moving close to it, which supports the upward movement.
Entry price: 12.21
First target: 12.38
Second target: 12.62
Third target: 12.93
Don't forget a simple principle: money management.
Place your stop-loss below the support zone in green.
For any questions, please leave a comment.
Thank you.

#LINK/USDT LONG SIGNAL#LINK
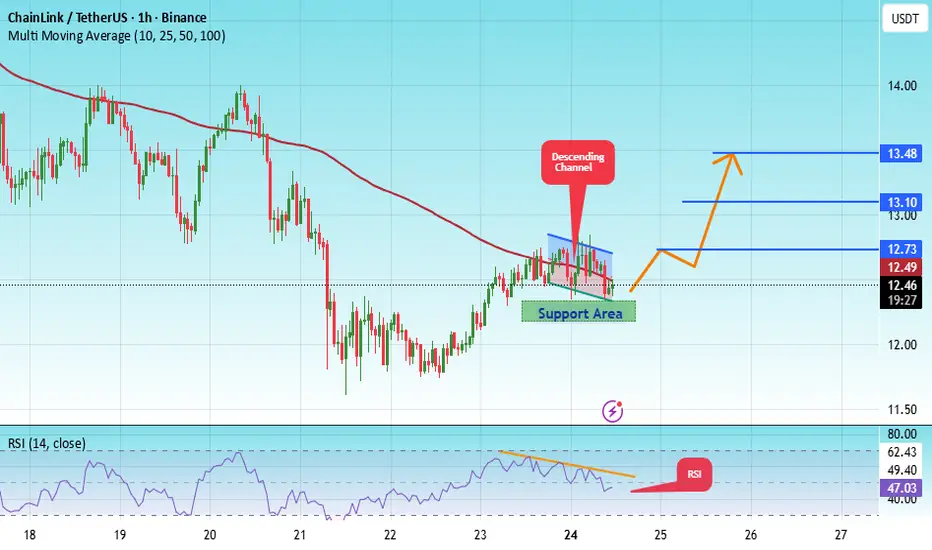
The price is moving within an ascending channel on the 1-hour timeframe and is adhering to it well. It is poised to break out strongly and retest the channel.
We have a downtrend line on the RSI indicator that is about to break and retest, which supports the upward move.
There is a key support zone in green at 12.27, representing a strong support point.
We have a trend to stabilize above the 100-period moving average.
Entry price: 12.48
First target: 12.73
Second target: 13.10
Third target: 13.48
Don't forget a simple money management rule:
Place your stop-loss order below the green support zone.
Once the first target is reached, save some money and then change your stop-loss order to an entry order.
For any questions, please leave a comment.
Thank you.
LINKPrice is still trading below the descending trendline, and the lower highs and lower lows structure suggests bearish momentum remains dominant. If the 14 دلار support breaks, the move toward 12.50 دلار becomes likely, while a breakout above the trendline may open the path to 15.30 دلار.
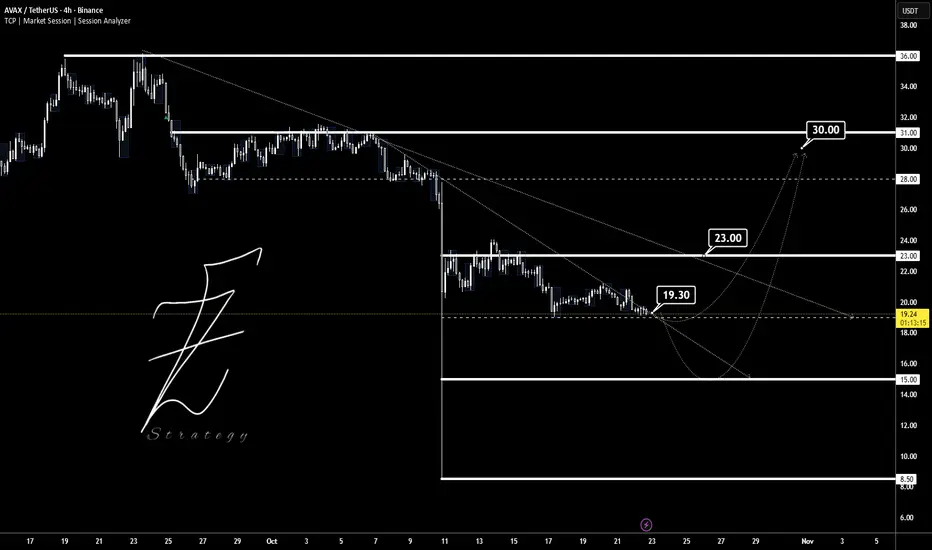
AVAXUSDTThis chart is The try that breakout trendline to way in 30$ target.
Supports: 19 - 15 -8.5
Resistance: 23 - 30 - 36
⚠️ Please control money management.
BINANCE:AVAXUSDT
LINK Spot LONG LINK Spot LONG📈
Due to the formation of a zigzag structure, I am more inclined to form a triangle and further exit from it upwards. I no longer consider it as an impulse.
Expectations have not changed, I plan to start recording after updating the global maximum of 53.00. Only the time of the scenario implementation has changed, which may take a long time.
All altcoins with potential show approximately the same picture, which is encouraging. This structure provides the most accurate goals for profit-taking and scenario cancellation.
LINK Analysis - October 18Price: $16.61
Up 0.81% (24h) after testing $16.96 resistance.
Technical Analysis:
Supports: $16.00, $15.50
Resistance: $17.00, $18.00
RSI: 46.75 (daily, neutral)
MACD: -0.19 (daily, sell)
EMAs: Below 50-day ($17.00), above 200-day ($15.00)
Bollinger: Near mid-band ($16.50)
LINK/BTC Chart Analysis:
Ratio: 0.000248
Supports: 0.000240, 0.000230
Resistance: 0.000260, 0.000270
RSI: 50 (daily, neutral)
MACD: Neutral, slight bearish divergence
Patterns: Symmetrical triangle forming (October 1–18)
Head and Shoulders potential (daily, bearish)
Bullish Engulfing: October 15
Plot on TradingView for visualization.
On-Chain Analysis:
MVRV: Neutral, fair valuation
Exchange Reserves: Stable, moderate selling
Whale Activity: 4,624 large transactions, 73% surge in accumulation
Coin Days Destroyed: Moderate, profit-taking
Glassnode Funding Rate: Neutral on CEXs (SorooshX/OKX perpetual futures ~0.01%, balanced leverage)
Fundamental News:
Macro: Fed rate cuts Q4 2025, easing inflation
Regulatory: S&P Global partners with Chainlink for on-chain stablecoin assessments
Institutional: Franklin Templeton, DTCC, Euroclear adopt Chainlink for tokenized assets
Social Sentiment:
450K+ #LINK mentions on X
60% bullish (S&P partnership, whale accumulation, $55 target predictions)
Trend & Chart Patterns:
Symmetrical Triangle: Forming (October 1–18)
Head and Shoulders: Potential bearish reversal on daily
Bullish Engulfing: October 15
Trend: Neutral short-term, breakout risk both ways
Long-term: $20–$55 (2026)
Buy/Sell Signal: Hold (55% confidence)
Rationale: Neutral RSI/MACD and funding rates suggest consolidation; whale accumulation and partnerships support upside, but Head and Shoulders risks pullback.
Hold or buy on dips: $16.00 or $15.50
Stop-loss: <$15.50
Target: $18.00 short-term, $55 (Q4 2026)
Disclaimer: Research before investing. #LINK

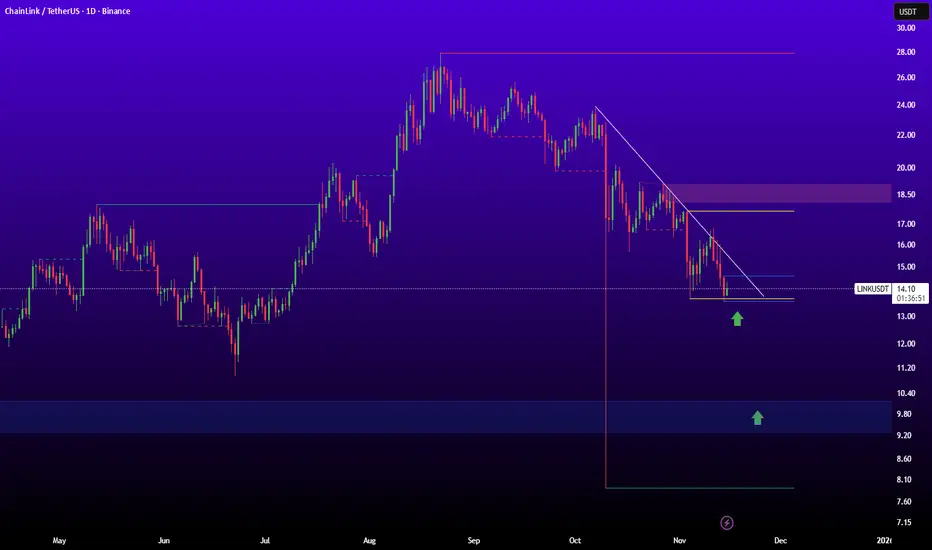
LINK/USDT — The Final Defense Zone: Will the Bulls Rise Again?Chainlink (LINK) has entered its final defense zone around $15.00–$17.00, a historically strong structural support area.
This zone isn’t just random — it’s the same level where the market once launched a major rally that drove LINK to $27.87.
The most recent daily candle shows a deep wick below the zone that was quickly reclaimed — a classic sign of a liquidity grab or false breakdown, hinting that the market might be accumulating before its next significant move.
Overall, the structure suggests a major retest phase: after a powerful breakout earlier this year, LINK is now retesting the origin of that move.
The key question — is this the start of re-accumulation before another leg higher, or the beginning of a market structure breakdown toward deeper lows?
---
Structure & Pattern
Yellow Zone ($15–$17) → Historical demand zone, validated by multiple previous bounces (marked by yellow arrows).
Macro Pattern → Retest of breakout zone, with the latest candle showing sweep and reclaim behavior.
Momentum → Sharp correction, but with a long lower wick and potential momentum divergence — a sign that the correction phase might be near its end.
Technical Context → Holding above this zone may form a double bottom or higher-low structure, indicating bullish strength recovery.
---
Bullish Scenario (Reversal Setup)
A daily close above $17 would confirm that buyers are defending the structure.
A sustained move above $19.99 could unlock upside targets at $21.69 → $23.30 → $25.12 → $26.82.
A strong rejection from the lower zone, combined with rising volume, may signal institutional accumulation in progress.
Market Narrative:
Bulls might be quietly preparing for Phase 2 of the rally after a classic shakeout.
As long as the $15–$17 zone holds, LINK retains the potential to resume its mid-term uptrend.
---
Bearish Scenario (Continuation Breakdown)
A daily close below $15 would signal structural failure and a loss of bullish control.
This could trigger a continuation drop toward $13.5 → $12.0 → $9.8.
A failed retest from below the zone ($16–$17 rejection) would further confirm bearish momentum.
Market Narrative:
If this support collapses, LINK may enter a distribution phase, where selling pressure strengthens and momentum fully flips bearish.
---
Conclusion & Perspective
The $15–$17 zone is the line between survival and surrender for LINK’s bullish structure.
As long as this level holds, the potential for a bullish reversal remains alive.
But once broken, the mid-term trend could shift decisively to bearish.
We are standing at a Decision Zone — the kind of area where institutions quietly position themselves and patient traders wait for confirmation before taking action.
---
LINK returns to its final defense zone at $15–$17 — the area separating a major reversal from a new downtrend.
The long wick signals a liquidity sweep, but confirmation awaits the next daily close.
Bulls are being tested — will they hold the line, or give in to market pressure?
Levels to watch:
Support: $15–$17
Resistance: $19.99 → $21.69 → $23.30 → $25.12 → $26.82 → $27.87
---
#LINK #Chainlink #LINKUSDT #CryptoAnalysis #TechnicalAnalysi #SupportAndResistance #CryptoMarket #PriceAction #Altcoins #MarketStructure #CryptoSetup #LINKPrice

LINK FOR BUYHello friends
After a long time of suffering, Link finally made a move and collected good liquidity that can make it prone to good growth. And the safest way, as I always tell you, is to buy in stages and with respect to capital and risk management.
The goals are also clear
*Trade safely with us*

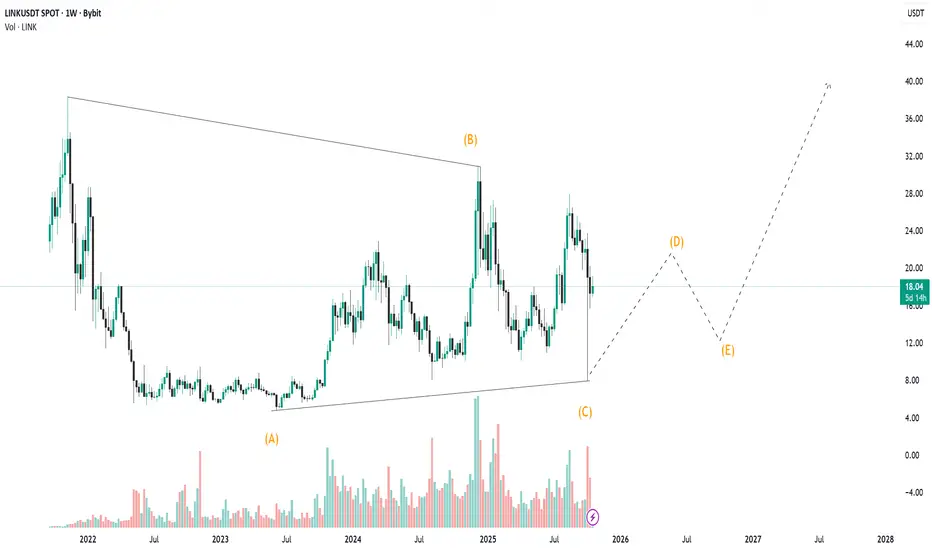
LINKUSD – Bullish Impulse Toward D-Point Target
LINKUSDT:
Title: LINKUSD – Bullish Impulse Toward D-Point Target
Price action has completed a corrective ABC structure, finding strong support at point C. The current breakout above mid-structure resistance confirms bullish momentum, aiming toward the D-point completion. Risk is managed below the breakout zone, with potential for trend continuation if price sustains above local support.
Risk Management Notes:
– Entry aligned with breakout confirmation
– Stop-loss below structural support (C-area)
– Take-profit near projected D-point completion

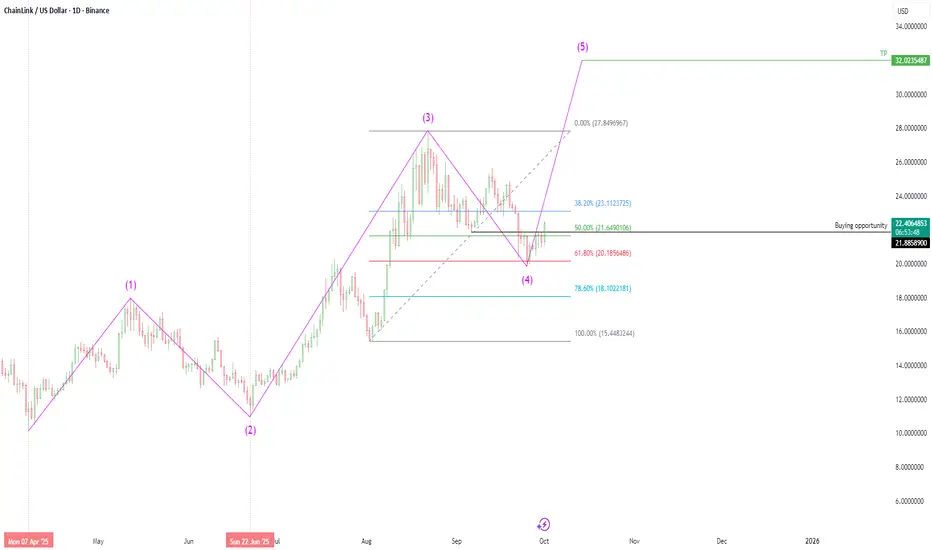
Chainlink (LINK/USD) - Elliott Wave AnalysisBased on Elliott Wave Theory, Chainlink (LINK/USD) appears to have successfully completed its corrective Wave 4, as evidenced by the recent stabilization and reversal patterns observed on the daily timeframe. This completion sets the stage for the anticipated impulsive Wave 5, which is now clearly visible on the daily chart. The structure suggests a continuation of the broader uptrend, with increased momentum likely to drive prices toward higher targets.
LINK/USDT - Ready for Takeoff? Major Bullish Reversal in Play!🚀 Trade Setup Details:
🕯 #LINK/USDT 🔼 Buy | Long 🔼
⌛️ TimeFrame: 1D
--------------------
🛡 Risk Management (Example):
🛡 Based on $10,000 Balance
🛡 Loss-Limit: 1% (Conservative)
🛡 The Signal Margin: $534.47
--------------------
☄️ En1: 20.74 (Amount: $53.45)
☄️ En2: 19.34 (Amount: $187.06)
☄️ En3: 18.4 (Amount: $240.51)
☄️ En4: 17.51 (Amount: $53.45)
--------------------
☄️ If All Entries Are Activated, Then:
☄️ Average.En: 18.87 ($534.47)
--------------------
☑️ TP1: 24.56 (+30.15%) (RR:1.61)
☑️ TP2: 27.87 (+47.69%) (RR:2.55)
☑️ TP3: 32.73 (+73.45%) (RR:3.93)
☑️ TP4: 40.16 (+112.82%) (RR:6.03)
☑️ TP5: 50.34 (+166.77%) (RR:8.91)
☑️ TP6: Open 🔝
--------------------
❌ SL: 15.34 (-18.71%) (-$100)
--------------------
💯 Maximum.Lev: 3X
⌛️ Trading Type: Swing Trading
‼️ Signal Risk: 🙂 Low-Risk! 🙂
🔎 Technical Analysis Breakdown:
This technical analysis is based on Price Action and Smart Money Concepts. All entry points, Target Points, and the Stop Loss are calculated using professional mathematical calculations. As a result, you can have an optimal trade setup based on great risk management.
Technically, LINK is bouncing off key support levels and forming a solid accumulation structure, suggesting strong hands are preparing for a breakout. With multiple confluences aligning — including long-term trend support and bullish divergence — this setup favors patient swing entries with impressive risk-to-reward potential.
📊 Sentiment & Market Context:
Chainlink (LINK) is showing signs of renewed bullish strength following a consolidation phase and broader market resilience. The crypto market has recently seen improved sentiment amid increasing institutional involvement and growing anticipation around real-world asset tokenization — a core use case for Chainlink's oracle solutions.
🔎 About LINK:
Chainlink is a decentralized oracle network that enables smart contracts to securely interact with real-world data. It plays a critical role in DeFi, insurance, gaming, and more — bridging on-chain and off-chain systems. As adoption of decentralized infrastructure grows, LINK continues to position itself as a key infrastructure asset in the blockchain ecosystem
⚠️ Disclaimer:
Trading involves significant risk, and past performance does not guarantee future results. This analysis is for informational purposes only and should not be considered financial advice. Always conduct your research and trade responsibly.
💡 Stay Updated:
Like this technical analysis? Follow me for more in-depth insights, technical setups, and market updates. Let's trade smarter together!

LINK/USDT Weekly FVG Tap
BINANCE:LINKUSDT has arrived right at a strong level that I see as a solid opportunity to enter.
This zone, together with the lower DCA area I highlighted as backup, looks like a prime region to build a spot position on LINK.
I’ll share another update if needed.

LINK LONG AND SHORT IDEAHi guys . i have this setup for BINANCE:LINKUSDT a double position . a long to upper FVG then short from there . in both case my SL above and blow major pivots.

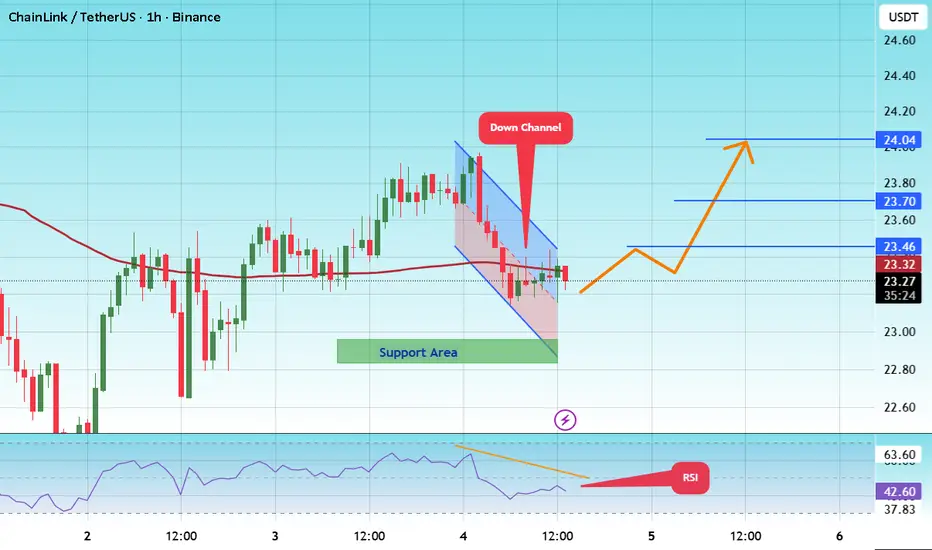
#LINK/USDT – Triangle Pattern Breakout Loading?#LINK
The price is moving within a descending channel on the 1-hour frame and is expected to break and continue upward.
We have a trend to stabilize above the 100 moving average once again.
We have a downtrend on the RSI indicator that supports the upward move with a breakout.
We have a support area at the lower boundary of the channel at 23.00, acting as strong support from which the price can rebound.
We have a major support area in green that pushed the price higher at 23.00.
Entry price: 23.26
First target: 23.46
Second target: 23.70
Third target: 24.00
To manage risk, don't forget stop loss and capital management.
When you reach the first target, save some profits and then change the stop order to an entry order.
For inquiries, please comment.
Thank you.
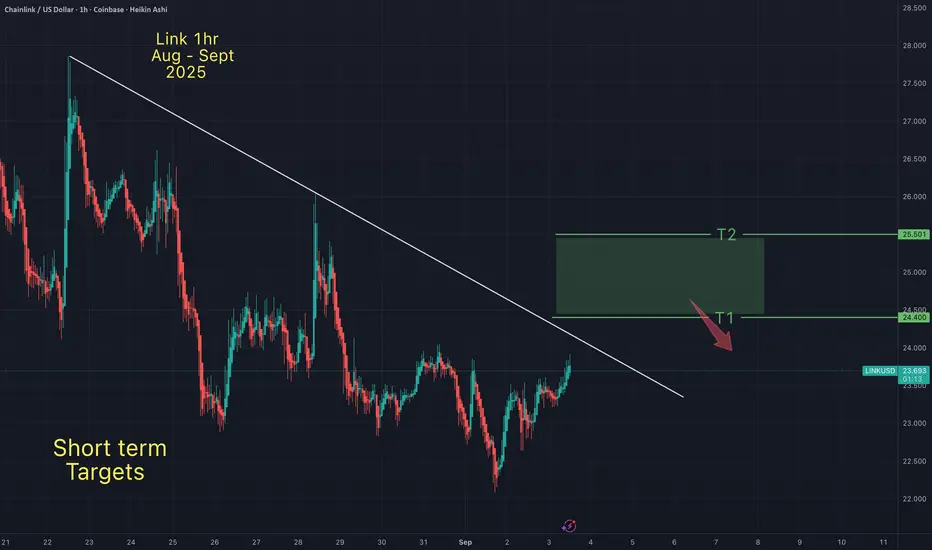
Link - Short term targetsI posted my midterm Link targets on my Aug 30th Link chart. These are my shorter term targets. I expect Link to follow Btc up to my Btc targets (see my Sept 2nd Btc chart). Then I expect both assets to retrace. At that point I will be on "lower low watch".
May the trends be with you.
LINKUSD HIGH PROBABILITY SETUP SOON!!🚨LINKUSD HIGH PROBABILITY BUY SETUP 🚨
* Here We Can See Clearly The Next Potential Moves For LINKUSD Coming Hours/Days.
* Keep Your Eyes Close On Your Trading Positions.
* Happy PIP Hunting Traders.
£ FXKILLA £

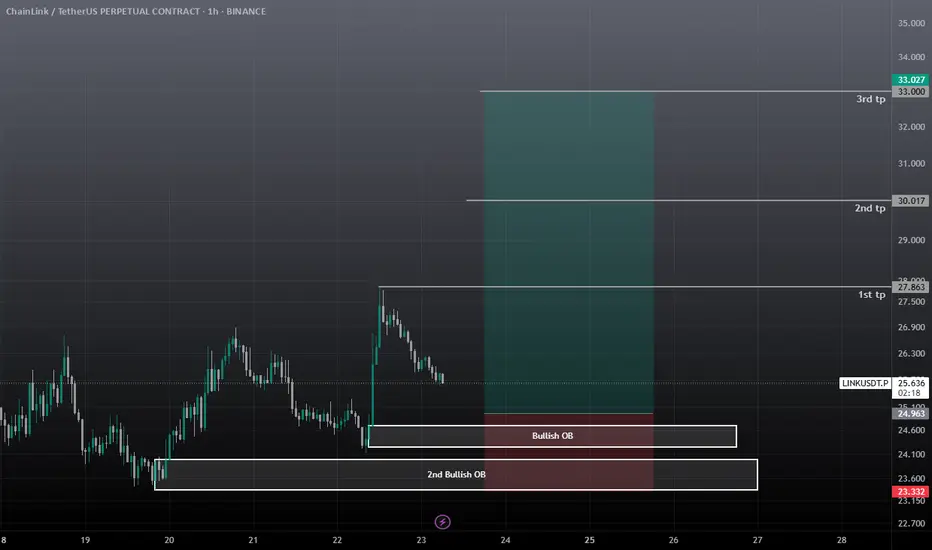
Link Long / Buy SetupLink has two Bullish OB, if first failed, 2nd OB will push the price, ETH bulish, link is also Bullish then. Use low risk as the pump was from an event so it can be a fakeout.
#LINK/USDT in upward mood !#LINK
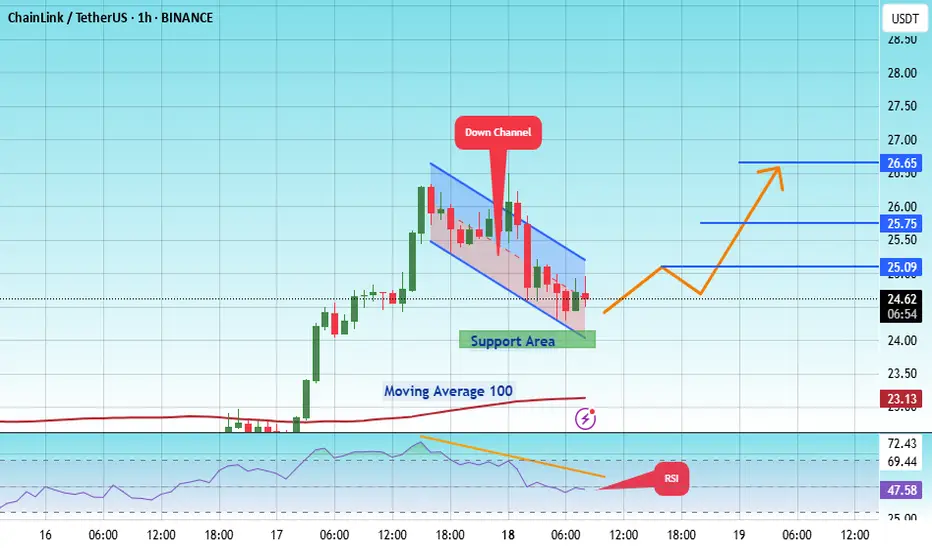
The price is moving within an ascending channel on the 1-hour frame, adhering well to it, and is on track to break it strongly upwards and retest it.
We have support from the lower boundary of the ascending channel, at 24.20.
We have a downtrend on the RSI indicator that is about to break and retest, supporting the upside.
There is a major support area in green at 24.00, which represents a strong basis for the upside.
Don't forget a simple thing: ease and capital.
When you reach the first target, save some money and then change your stop-loss order to an entry order.
For inquiries, please leave a comment.
We have a trend to hold above the 100 Moving Average.
Entry price: 24.60.
First target: 25.09.
Second target: 25.75.
Third target: 26.65.
Don't forget a simple thing: ease and capital.
When you reach your first target, save some money and then change your stop-loss order to an entry order.
For inquiries, please leave a comment.
Thank you.
LINKUSDTThis chart is in a bullish trend, but it broke a new high at $22.7. If BINANCE:LINKUSDT can keep the price above $20, we can expect it to reach a higher high.
Please control risk management.⚠️

LINK Macro signs pointing towards a buyHi,
This is a Macro analysis on the 1 Month timeframe for LINKUSD pair.
I've been looking for opportunities to trade in altcoin market. With BTC in price discovery mode and other signs appearing like altcoin only market cap charts point towards liquidity coming in, it is important now than ever to be spending time to scope out opportunities here.
I do think that not all altcoins will behave the same, im trying to use TA to find those with strong technicals.
LINKUSD sticks out due to several factors.
1. We are in an ascending channel, that i believe currently price action will eventually attempt to reach the upper trend line. (We could be at the very moment be attempting this.)
2. Momentum indicators are flashing bullish, though note that there is still a long way to go for the current monthly candle to close.
Both MACD and STOCH RSI are flashing buys in my opinion.
If our August Candle closes with:
MACD flashing histogram bar as deep green with bullish cross and
STOCH RSI flashing bullish cross and cross occurs above the 20 line.
This would indicate a potential for Macro Bullish move to the upside. ANd i believe that move to be at the very least to the previous highs, if not to new all time highs.
For the 1Month to stay bullish, we need to look for more bullish evidence such as in lower timeframes like the 1 week or 3 day to support 1 Month changes. And Bulls need to maintain dominance in those timeframes for 1 Month to print bullish.
Stay tuned for more updates.

#LINK/USDT targeting 17.77 $ ?#LINK
The price is moving within a descending channel on the 1-hour frame and is expected to break and continue upward.
We have a trend to stabilize above the 100 moving average once again.
We have a downtrend on the RSI indicator that supports the upward break.
We have a support area at the lower boundary of the channel at 15.60, acting as strong support from which the price can rebound.
We have a major support area in green that pushed the price higher at 15.30.
Entry price: 15.84
First target: 16.47
Second target: 17.00
Third target: 17.77
To manage risk, don't forget stop loss and capital management.
When you reach the first target, save some profits and then change the stop order to an entry order.
For inquiries, please comment.
Thank you.
