#LINK Crash Incoming? Why strong support always Weak...
Yello Paradisers! Did you catch the early signs of this breakdown, or are you still stuck in the trap? As we warned in our previous market commentaries, #LINKUSDT was setting up for a deeper move — and now the chart is confirming that view.
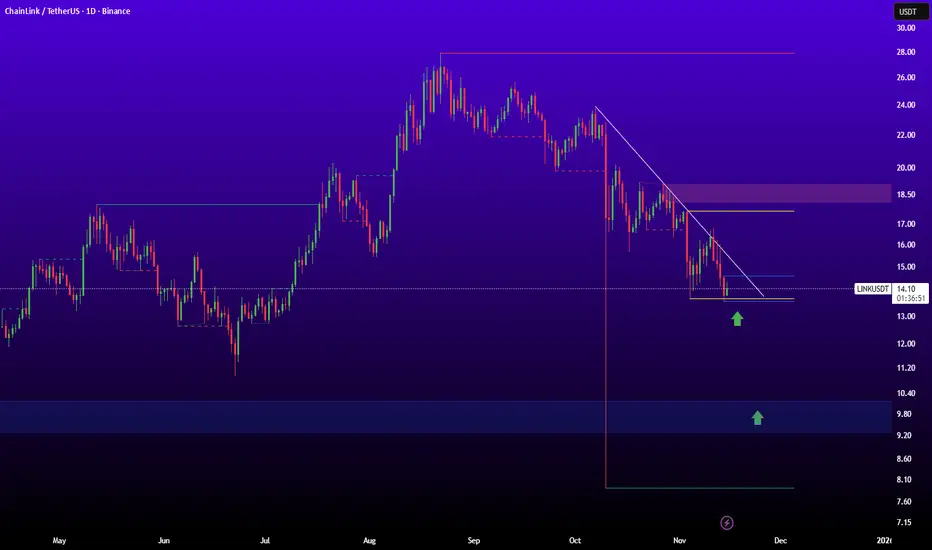
💎After a clean rejection from the trendline resistance, #LINK has decisively broken below a key structural support, confirming a shift in market sentiment. This wasn’t just a random bounce or a short-term wick — the break below structure was accompanied by clear momentum loss on the higher timeframes, which increases the probability of a sustained leg lower. The trendline rejection aligns perfectly with the broader structure, and we’re now seeing continuation as price respects the bearish market geometry.
💎What makes this setup even more compelling is the presence of hidden bearish divergence on the RSI as price retested resistance. This is a technical sign of strength in the prevailing downtrend — price was making lower highs, but RSI was printing higher highs. That kind of signal often goes unnoticed by retail traders but is a critical continuation indicator for experienced analysts. It confirmed that bears were in control and buyers were lacking conviction on the retests.
💎Moreover, the broken support level had been tested three times prior to the breakdown, and many retail traders fell into the trap of interpreting that as strength. But as we’ve mentioned many times in our updates, repeated testing of a level weakens it, not strengthens it. What we saw here was a classic liquidity trap — smart money absorbed retail demand at support, engineered a false sense of safety, and then triggered a breakdown to the downside once enough positions were lured in. It’s a strategy often used to generate liquidity before the real move begins.
💎Now that structure has shifted, the technical landscape becomes clearer. The RSI is currently holding below the 40 level — a zone typically associated with strong bearish control. Until we see a sustained reclaim of that range or a divergence forming closer to oversold levels, there is no reason to assume momentum has faded. The trend remains firmly to the downside.
💎Looking at key levels, the next major support comes in around the $8 region. This zone is significant both psychologically and structurally — a breakdown into that area would align with prior consolidation ranges and potentially trigger more long liquidations. On the upside, the $15 level now acts as strong resistance. Unless that level is reclaimed with conviction, all rallies should be viewed as potential selling opportunities within a broader bearish context.
As always, we’re not here to gamble or chase noise. The structure is breaking down, and our job is to stay on the right side of probability. That is why we are playing it safe right now. If you want to be consistently profitable, you need to be extremely patient and always wait only for the best, highest probability trading opportunities. This is the only way how you can get inside the winner circle. Stay sharp, Paradisers — and let the rest chase shadows.
MyCryptoParadise
iFeel the success🌴
LINKUSD

#LINK/USDT – Triangle Pattern Breakout Loading?#LINK
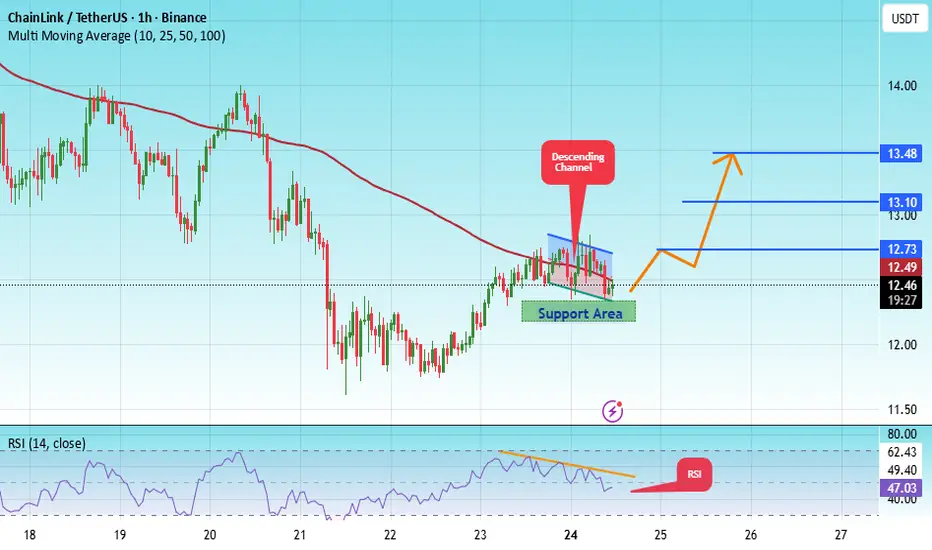
The price is moving within a descending channel on the hourly timeframe. It has reached the lower boundary and is heading towards a breakout, with a retest of the upper boundary expected.
The Relative Strength Index (RSI) is showing a downward trend, approaching the lower boundary, and an upward bounce is anticipated.
There is a key support zone in green at 11.75, and the price has bounced from this level several times. Another bounce is expected.
The indicator is showing a trend towards consolidation above the 100-period moving average, which we are approaching, supporting the upward move.
Entry Price: 11.95
First Target: 12.10
Second Target: 12.38
Third Target: 12.69
Stop Loss: Below the green support zone.
Remember this simple thing: Money management.
For any questions, please leave a comment.
Thank you.

LINK Market Cap - Descending Wedge at $9.25B | Bullish Breakout Executive Summary
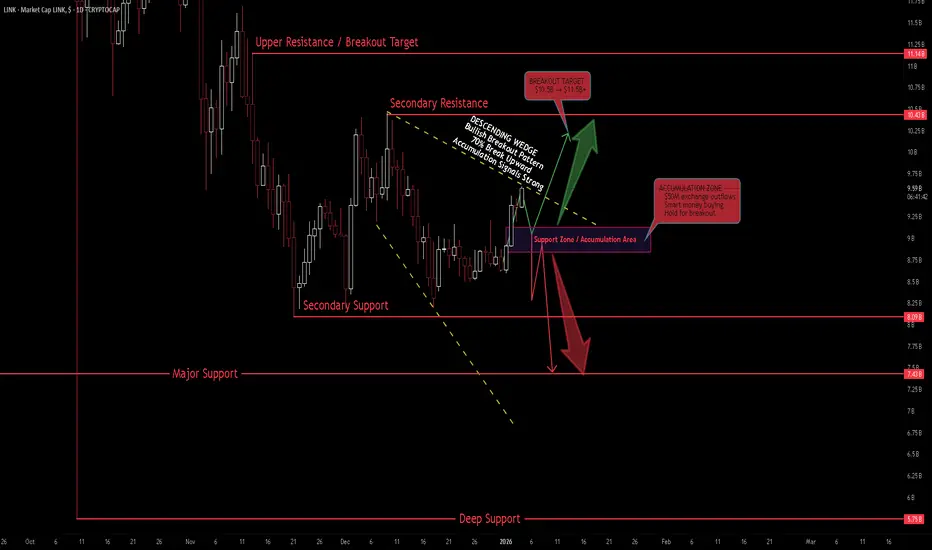
Chainlink (LINK) market cap trading at $9.25B within a descending wedge on the 1D timeframe. Price holding key support while forming bullish structure. Strong accumulation signals with $50M in exchange outflows from Binance. Expecting bullish breakout past the highs as selling pressure fades and smart money accumulates.
BIAS: BULLISH - Breakout Structure Forming
Current Market Context
LINK broke 21-day MA - altcoins looking for "upward run" in next 2-3 months
$50M in exchange outflows from Binance (accumulation signal)
Holding 200-day MA and long-term trendline support
Grayscale highlights LINK's role in tokenization
Top DeFi project by development activity
Cleaner setup than Hyperliquid heading into 2026
Fundamental Strength
Strong connections with policymakers and financial institutions
Founder met with US lawmakers, Federal Reserve, key political figures
Key player in compliant crypto projects
Leading role in tokenizing real-world assets (RWA)
Ranked top DeFi project by GitHub development activity
Positioned well for regulatory clarity in 2026
Technical Structure - 1D
Descending Wedge Pattern:
Falling resistance and support trendlines (yellow dashed)
Wedge narrowing - compression before breakout
Typically bullish reversal (70% break up)
Price holding support zone
Key Levels (Market Cap):
Resistance:
$9.5B - Immediate resistance
$10.5B - Secondary resistance (red line)
$11.5B - Upper resistance / breakout target
Support:
$9.0B - $9.25B - Current support zone (purple)
$8.0B - Secondary support (red line)
$7.4B - Major support (red line)
$5.7B - Deep support (red line at bottom)
SCENARIO ANALYSIS
BULLISH (Primary): Wedge Breakout
Break above descending wedge resistance
Target $10.5B, then $11.5B+
Accumulation signals support breakout
Altcoin season catalyst
BEARISH: Wedge Breakdown
If support at $9.0B fails
Drop to $8.0B, then $7.4B
Invalidates bullish thesis
My Assessment
Descending wedge with strong accumulation signals. $50M exchange outflows = smart money buying. Holding long-term support while selling pressure fades. Bullish structure forming for breakout past the highs. LINK positioned well for 2026 with regulatory clarity and RWA tokenization narrative.
Strategy:
Long on wedge breakout confirmation
Target $10.5B, then $11.5B+
Stop below $8.0B support
Accumulate at $9.0B-$9.25B support zone
Let me know what you think in the comments below for the next move!
#LINK/USDT in upward mood !#LINK
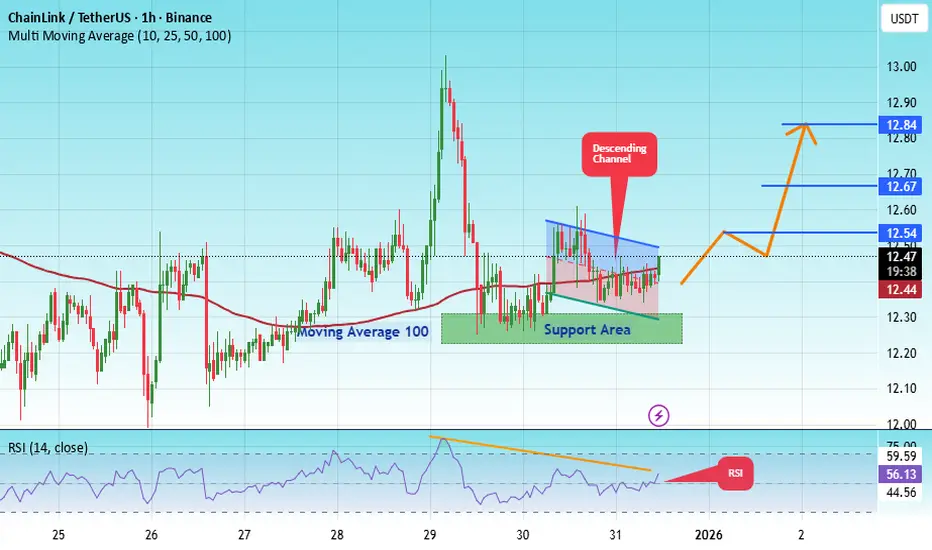
The price is moving in a descending channel on the 1-hour timeframe. It has reached the lower boundary and is heading towards breaking above it, with a retest of the upper boundary expected.
We have a downtrend on the RSI indicator, which has reached near the lower boundary, and an upward rebound is expected.
There is a key support zone in green at 12.26. The price has bounced from this zone multiple times and is expected to bounce again.
We have a trend towards stability above the 100-period moving average, as we are moving close to it, which supports the upward movement.
Entry price: 12.43
First target: 12.67
Second target: 12.54
Third target: 12.47
Stop loss: Below the support zone in green.
Don't forget a simple thing: capital management.
For inquiries, please leave a comment.
Thank you.

LINKUSDT | Short Term Bearish RejectionHello traders,
As you can see on the chart, LINK reached a local resistance and opened a very good R:R short trade targeting the below corrective uptrend.
Target $12.22
SL above $13.22
Good Luck

LINK/USDT — Descending Trendline Test: Break or Rejection?LINK/USDT on the 12H timeframe is still moving within a medium-term bearish structure, but price is currently testing a major descending trendline resistance that has capped upside movement since the previous highs. This places LINK in a critical decision zone.
---
📐 Pattern & Price Structure
Primary Pattern: Descending Trendline (Bearish Structure)
Price has been forming consistent lower highs and lower lows.
Price is now approaching a dynamic resistance (yellow trendline), which has:
Acted as strong resistance for months
Become a key validation level for either continuation or reversal
Additionally, price is consolidating in a tight accumulation range below the trendline, often a precursor to a strong breakout or breakdown.
---
🧱 Key Levels
Resistance:
13.55 – 14.70 → Minor resistance / supply zone
16.50 → Next structural resistance
18.50 – 19.90 → Extended bullish targets after a confirmed breakout
23.40 → Major resistance / previous distribution area
Support:
12.40 – 12.00 → Nearest support & demand zone
11.70 → Critical support (bullish invalidation)
11.10 → Extreme support / last defense
---
🟢 Bullish Scenario
Price breaks and closes decisively above the descending trendline on the 12H timeframe.
Ideal confirmation includes:
Strong candle body
Trendline retest holding as support
Potential upside targets:
14.70 → 16.50
Extension toward 18.50 – 19.90
A valid breakout would:
End the lower-high structure
Signal a medium-term trend reversal or bullish continuation
---
🔴 Bearish Scenario
Price fails to break the trendline and prints a clear rejection (long upper wick / bearish engulfing).
A breakdown below the current range opens downside potential toward:
12.00 retest
Extension to 11.70 – 11.10
As long as price remains below the descending trendline, the primary bias stays bearish / corrective.
---
🧠 Conclusion
LINK/USDT is trading at one of the most important technical zones in recent months.
Price reaction at the descending trendline will define the next major move:
Breakout → structure shift & bullish opportunity
Rejection → continuation of the downtrend
Patience and confirmation are key to avoiding false breakouts in this area.
---
#LINK #LINKUSDT #Chainlink #CryptoAnalysis #TechnicalAnalysis #Altcoins #Downtrend #Trendline #Breakout #CryptoTrading

#LINK/USDT – Triangle Pattern Breakout Loading?#LINK
The price is moving in a descending channel on the 1-hour timeframe. It has reached the lower boundary and is heading towards breaking above it, with a retest of the upper boundary expected.
We have a downtrend on the RSI indicator, which has reached near the lower boundary, and an upward rebound is expected.
There is a key support zone in green at 12.26. The price has bounced from this zone multiple times and is expected to bounce again.
We have a trend towards stability above the 100-period moving average, as we are moving close to it, which supports the upward movement.
Entry price: 12.43
First target: 12.67
Second target: 12.54
Third target: 12.47
Stop loss: Below the support zone in green.
Don't forget a simple thing: capital management.
For inquiries, please leave a comment.
Thank you.
#LINK/USDT – Triangle Pattern Breakout Loading?#LINK
The price is moving in a descending channel on the 1-hour timeframe. It has reached the lower boundary and is heading towards breaking above it, with a retest of the upper boundary expected.
We have a downtrend on the RSI indicator, which has reached near the lower boundary, and an upward rebound is expected.
There is a key support zone in green at 12.00. The price has bounced from this level multiple times and is expected to bounce again.
We have a trend towards consolidation above the 100-period moving average, as we are moving close to it, which supports the upward movement.
Entry price: 12.21
First target: 12.38
Second target: 12.62
Third target: 12.93
Don't forget a simple principle: money management.
Place your stop-loss below the support zone in green.
For any questions, please leave a comment.
Thank you.

LINK: The Spring is About to BreakWe're sitting at the apex of a textbook converging wedge with just $0.07 of room left. 20 touches on ascending support ($12.19), 13 touches on descending resistance ($12.26), and price currently at $12.30. The coiled spring scenario is here—something gives within the next few bars.
1. THE TECHNICAL REALITY 📉
• Wedge compression: Width contracted from $14.62 to $0.07 over 467 bars—apex reached
• Macro structure: Price below EMA50 ($12.42) and EMA200 ($13.22)—bearish trend intact
• Current position: Testing middle Bollinger Band ($12.27), just above EMA20 ($12.29)
• ADX at 41.3: Strong trending environment confirmed
2. THE INDICATORS ⚖️
Bearish Signals:
• Bearish order block overhead at $12.31-$12.52 acting as supply
• Volume 63% below average ($622K vs $1.66M)—weak conviction on bounce
• Swing trend bearish despite trading in discount zone
• Upper wick 29.3% showing rejection at resistance
Bullish Signals:
• MACD bullish crossover (MACD -0.0311 above Signal -0.0451)
• Lower wick 59.8% showing strong support attempts
• Bullish order block below at $12.21-$12.63 providing demand
• RSI neutral at 54.4, MFI at 67.3 (elevated but not extreme)
The Conflict:
MACD suggests momentum shift, but volume tells the opposite story. Without conviction behind this bounce, the 59.8% lower wick represents indecision rather than strength. Structure trumps oscillators here.
3. THE TRADE SETUP 🎯
🔴 Scenario A: Wedge Breakdown (Higher Probability - 68%)
• Trigger: 4H close below $12.21 (bullish OB support break)
• Entry: Confirmation below $12.21 with volume
• Target: $11.73 (weak low liquidity sweep, 4.70% distance)
• Stop: 4H close above $12.52
Logic: Price rejects at $12.52 bearish OB (aligns with descending resistance), breaks 20-touch ascending support at $12.19, sweeps equal lows at $11.73 where unprotected buy-side liquidity sits. Converging wedges typically break in direction of prior trend—which is down.
🟢 Scenario B: Breakout Reversal
• Trigger: Decisive break above $12.52 with volume
• Entry: 4H close above $12.52 (breaks bearish OB + descending resistance)
• Target: $14.19 (premium zone threshold, triggers CHoCH bullish)
• Invalidation: Rejection back below $12.52
Logic: Reclaiming $14.19 invalidates entire bearish structure and signals bulls have control. Given positioning below EMA50/200 and bearish swing trend, assigning lower probability to this outcome.
MY VERDICT
Risk-reward favors the breakdown. The 20-touch ascending support at $12.19 breaking on volume would be a significant technical event that accelerates selling. Wait for confirmation rather than front-running—the wedge apex doesn't care about your bias, it breaks based on order flow.

Be careful with LINK !!!The price on the 4h timeframe is within an ascending triangle, which can be promising. If the price breaks this pattern with bullish candles, it could easily rise by the distance of AB=CD.

LINK - Huge Weekly Bullflag A triangle can be used to show the flag part of the structure
The earlier price movement acts as flag pole
Basically a massive bullflag on this Weekly timeframe
Bullish on altcoins

LINK/USDT - Bearish Flag Breakdown in Play (17.12.2025)📝 Description🔹 Setup WHITEBIT:LINKUSDT
LINK/USDT formed a classic Bearish Flag pattern after a strong impulsive drop (flagpole).
Price is now consolidating inside a rising channel, but remains below Ichimoku Cloud resistance and key EMAs — signaling weak bullish momentum.
As long as price stays below the flag resistance, bearish continuation remains the higher probability.
📌 Trading Plan
Primary Bias: 🔴 Bearish continuation
Watch for flag breakdown confirmation below minor support
Momentum confirmation = strong bearish candle close
🔴 1st Support: 12.12
🔴 2nd Support (Flag Target): 11.69
Measured Move: Flagpole height projection aligns with lower target
#LINKUSDT #Chainlink #CryptoTrading #BearishFlag #PriceAction #TechnicalAnalysis #CryptoMarket #TradingView #Altcoins #Kabhi_TA_Trading
⚠️ Disclaimer
This analysis is for educational purposes only.
Crypto markets are highly volatile — always use proper risk management and stop-loss.
❤️ Support the Work 👍 Like if this setup makes sense 💬 Comment your LINK view (bullish or bearish? )
🔁 Share to help more traders learn Your support keeps these breakdowns coming 🙌

LINK to 3 dollars -- Last exit before the elevator down.Chainlink is flashing a head and shoulders.
It is looking to break the previous bear market lows.
And there are fib retracement confluence projections that align with single digit prices.

LINKUSD | Revisiting an Old Down TrendHello traders,
I remember I traded LINKUSD back in 2017/2018 and I hated myself doing so. This coin is very slow and boring and I can't help it but feel that way.
Since Jun, 2023 LINK has been printing high lows on HTF and on a steady uptrend.
I think when ALT season starts, it might reach $22 price territory before it will go in another coma. Because that is what LINK always does, right?
Lets see how it plays out.
Good Luck!
Please drop a like and share your thoughts traders

LINK/USDT — Historical Block: Bull Revival or Demand Breakdown?LINK is now approaching the most critical level of its multi-year market structure. The price has returned to the exact same demand block that triggered the major bullish expansion in previous cycles. This isn’t just support — it’s a historical liquidity zone where smart money repeatedly positioned itself before every significant rally.
And once again, the market is testing this area.
---
**✨ Market Narrative:
“Back to Where the Trend Began”**
From 2023 to 2025, every approach to the $10–$8.8 zone resulted in heavy absorption, long wicks, and strong reversals. This proves that this area acts as a primary liquidity pool for institutional accumulation.
This current revisit could become:
A bullish revival into a new multi-month uptrend,
or
A full breakdown into deeper distribution if the zone fails.
Simply put:
👉 This is LINK’s “make or break” level.
---
📈 Bullish Scenario — “Demand Awakening”
The bullish thesis activates if price:
Holds above $10–$8.8,
Forms a new higher low,
And closes strongly above $13–$14 on the 4D timeframe.
Signs of accumulation:
Long downside wicks inside the block
Increasing volume after compression
Higher timeframe candle reclaiming previous breakdown points
If confirmed, upside targets unfold naturally:
🎯 Target 1: $15–$17
🎯 Target 2: $21–$26
🎯 Target 3: Retest of the 2024 macro highs (expansion phase)
A reclaim of $17 would signal that the macro bullish trend is re-establishing itself.
---
📉 Bearish Scenario — “Demand Collapse”
The bearish thesis confirms ONLY when price:
Prints a decisive 4D close below $8.8,
Followed by continuation (not just a liquidity wick).
If the demand block breaks, the market shifts from accumulation to full distribution.
Downside targets become likely:
🎯 Target 1: $6–$5
🎯 Target 2: $4.7 (historical low & liquidity magnet)
🎯 Target 3: Full macro range retracement
This breakdown would represent a structural trend shift on the higher timeframe.
---
📊 Pattern & Market Structure Breakdown
Historical Demand Revisit: Price has returned to the core area that defined the previous rally.
Liquidity Grab Evidence: Deep wicks below the block — classic stop hunts before accumulation.
Macro Range Structure: LINK remains inside a multi-year range, hovering at its lower boundary.
Trend Context: Lower highs formed in 2025, and now price is searching for macro direction.
This isn’t ordinary price action —
this is where accumulation and distribution collide.
#LINK #Chainlink #Crypto #Altcoins #TechnicalAnalysis #DemandZone #PriceAction #MarketStructure #SmartMoney #CryptoAnalysis #SupportResistance

CHAINLINK – LONG - A WHISPER BEFORE THE BREAKOUTTraders,
I believe BINANCE:LINKUSDT is quietly setting up for another leg up. Let me walk you through the logic.
HTF structure - wedge breakout and retest
Price has broken out of a HTF falling wedge that has been guiding price action for weeks. A falling wedge is a compression pattern where:
Highs and lows are both trending lower
The upper trendline is steeper than the lower one
So sellers are still in control on the surface, but every push down is getting less effective. Once price breaks above the upper wedge line with an impulsive move, it usually means:
Most of the aggressive sell pressure inside the pattern has been absorbed
New buyers are willing to chase higher outside of that structure
That is exactly what I see on $LINKUSDT.
After the breakout, price rotated back down and is currently testing an imbalance zone around 13.75. This area:
Is the origin of the last impulsive leg up
Lines up with a clean Fib potential reversal zone on the LTF
So from a pure structure point of view this is a classic breakout → retest → potential continuation setup.
Order flow - hidden bull divergence and absorption
To see if the idea is backed by real flows, I zoomed into the CVDs and open interest.
On the pullback into 13.7 to 13.8:
Aggregated CVD Spot makes lower lows
Aggregated CVD Futures (stablecoin margined and coin margined) also print lower lows
While price holds a higher low compared to the previous swing
That is a hidden bullish divergence between price and CVD. In simple language: more market selling is hitting the books, but price refuses to break down. This usually means:
Sell pressure is being absorbed by passive buyers
Strong hands are using the dip to accumulate rather than distribute
Open interest supports that idea:
Stablecoin margined OI bled lower during the pullback, which suggests late longs getting flushed and some short covering
Coin margined OI is starting to curl up from the lows, which often signals new directional positioning right where CVD is making new lows and price is holding
That combination looks more like reloading than topping.
Targets and TPO weak highs
Now to the upside magnets. On the HTF and weekly TPO I am watching a series of weak highs that have not been properly tested:
1. 19.03 area - weekly TPO weak high
Formed with very little excess on the profile
Built mostly outside RTH, so it carries less conviction
These kinds of highs often get swept for liquidity before any real reversal happens
2. 20.20 area - second weekly TPO weak high
Similar story, clean horizontal high, thin rejection
Again, not much time spent there, so it looks more like an unfinished auction than a completed top
In my view, both of these levels are liquidity pools rather than solid resistance. If the current wedge breakout plays out, I expect price to at least probe and likely run these highs. From there, my HTF roadmap looks roughly like this:
Major Target 1: sweep the 19.0 weak high and push into the 20.0 to 20.2 block
Major Target 2: extension toward the 10 October liquidation event local high, which I have marked on the chart, and beyond that into the 22.7 to 23.6 region if momentum really kicks in
I also believe that altcoins as a group are eyeing that 10 October liquidation event local high. Many charts show similar untested spikes there, so a broad alt sweep of that zone would fit nicely with this BINANCE:LINKUSDT structure.
Invalidation
No setup is complete without an invalidation. For me the idea loses its edge if:
Price accepts back inside the broken wedge, not just a wick, but clear trade and structure back under the upper wedge line
Especially if that happens with CVD rolling over and OI expanding to the downside
If we get that, it would tell me that the breakout was a trap and that the current demand at 13.7 to 13.8 was not strong enough to hold.
Until that happens, as long as price is holding above the wedge and above the imbalance, I treat this as a constructive continuation setup with unfinished business at those weekly weak highs and the October local high.
As always, the market speaks softly before it moves loudly . Listen well, Nomads.
---------------------------------------------------------------------
If this helped, feel free to like, comment, or share your thoughts below.
---------------------------------------------------------------------
Abbreviation List
HTF – Higher Time Frame
LTF – Lower Time Frame
CVD – Cumulative Volume Delta
OI – Open Interest
TPO – Time Price Opportunity
PRZ – Potential Reversal Zone
RTH – Regular Trading Hours

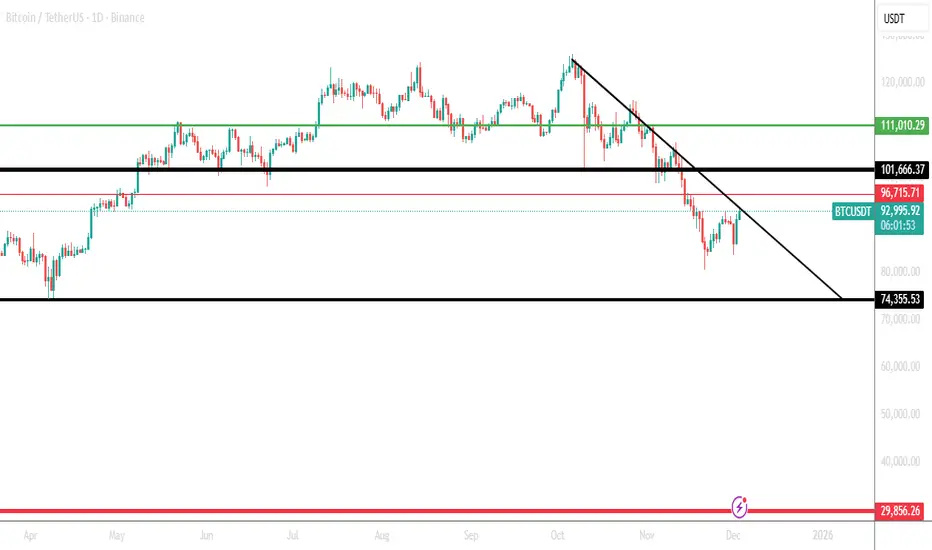
Bitcoin needs to break above the 101–103k zone.Bitcoin needs to break above the 101–103k zone.
If it manages to do that, the next target would be around 111k.
If it does not reach that level and does not break the downward trendline, then the next important level is 73k.
This area is likely to be strongly defended by investors to prevent the price from reaching it or falling below it.
If the price drops below that zone, then the bottom for the next cycle would be around 30k.
This is purely a technical analysis view.
If I personally wanted to invest, I would focus on prices that include the digit “5” in Bitcoin’s price.
I would be looking to enter at:
105k
135k in case of further upside
75k
35k in case of deeper downside
These levels are not guesses and not the result of a simple mathematical formula.
They come from a technical view of Bitcoin.
After Bitcoin broke below the 50-week moving average the week before last, the price quickly dropped by about 20%.
Right now, Bitcoin is breaking the 200-period moving average consecutively on the 3-hour timeframe. This is a positive sign, and it is also forming a low followed by a higher low. Along with the volume, this is creating a positive divergence.
But my final assessment to the question:
“Has the bearish wave really reversed now?”
My answer is: 0 out of 3.
That is my honest answer, not based on emotion or trying to please anyone.
In the end, and always: this is not investment advice.
Note: I am only translating and polishing your own analysis here, not adding any investment recommendation from my side.
LINK/USD LONG SET UP(Swing Trade)Entry 1 $12.50
Entry 2 $10.00
Stop loss $8.50
Take profit 1- $16.50
(Close 25%)
Take profit 2- $20.50
(Close 50%)
Take profit 3-$24.50
(Close 75%)
Take profit 4-$28.50
(Close 100%)

ChainLink LINK price analysis#LINK is literally standing on the edge…
Right now the price is hanging by a thread:
⚠️ a daily close below $11.50 is highly undesirable — this could open the door to a much deeper drop.
🕒 On the 3D timeframe, the OKX:LINKUSDT chart looks extremely intriguing.
Where do you see #LINK six months from now?
➡️ A push toward $53
or
⬅️ A slide into the $5.50–7.00 zone?
📊 Current #Chainlink market cap: $8B.
Hypothetically, in six months it could be either:
🔻 $4–5B, if the market keeps pressing lower
or
🔺 $37B, if the trend flips and demand flows back in.
❓ What scenario are you leaning toward? A long-term rebound or a deeper liquidity sweep first?
______________
◆ Follow us ❤️ for daily crypto insights & updates!
🚀 Don’t miss out on important market moves
🧠 DYOR | This is not financial advice, just thinking out loud

LINKUSD - ChainLink | Biggest Oracle In CryptoHi,
Chainlink is the biggest blockchain platform that bridges blockchain-based smart contracts and real-time external data.
This is not a trading advice.
Thanks
Gex

#LINK/USDT LONG SIGNAL#LINK
The price is moving within an ascending channel on the 1-hour timeframe and is adhering to it well. It is poised to break out strongly and retest the channel.
We have a downtrend line on the RSI indicator that is about to break and retest, which supports the upward move.
There is a key support zone in green at 12.27, representing a strong support point.
We have a trend to stabilize above the 100-period moving average.
Entry price: 12.48
First target: 12.73
Second target: 13.10
Third target: 13.48
Don't forget a simple money management rule:
Place your stop-loss order below the green support zone.
Once the first target is reached, save some money and then change your stop-loss order to an entry order.
For any questions, please leave a comment.
Thank you.
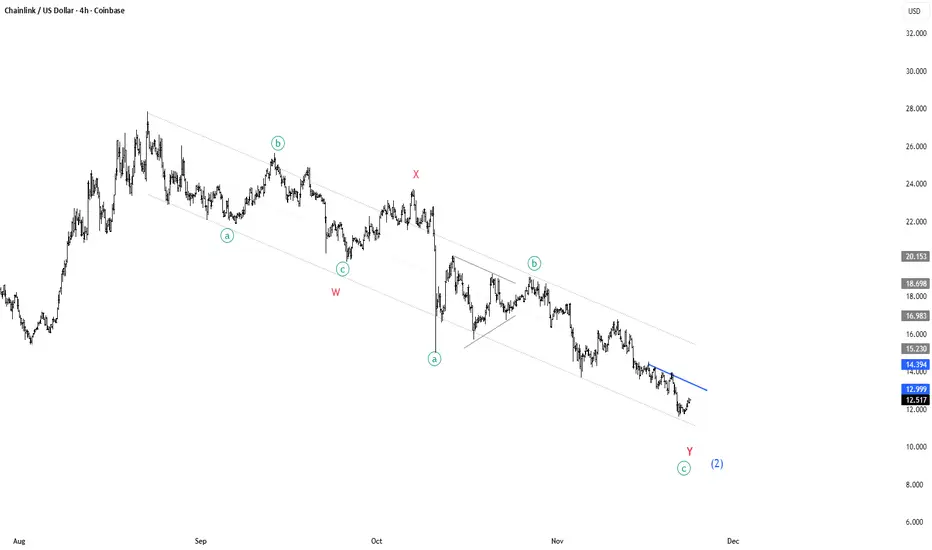
CHAINLINK is turning around for a massive rally!🔗 CRYPTOCAP:LINK – Elliott Wave Breakdown (4H Chart)
Current structure still fits a W–X–Y corrective decline, but we’re now approaching a critical trigger level. A clean punch through the blue trendline = buy signal. 🎯
🟦 What the structure shows:
🔻 Wave W complete:
• Clear a–b–c zigzag
• Strong reaction into the X connector
🔷 Wave X at the mid-channel zone:
• Acts as the next major upside target if we break out
• Provides structural symmetry between W and Y
🔻 Wave Y in progress:
• Again forming a–b–c
• C-leg looks terminal, aligning with channel support
📉 Price is compressing under the descending blue trendline (b-wave resistance of Y)
🚀 Trade trigger:
A decisive breakout above the blue trendline = start of the next impulsive leg
Upside target: the region around the prior X high
That zone is both:
• 🔹 Structural retracement
• 🔹 Upper channel magnet
• 🔹 Ideal first take-profit region
📌 Summary:
Break the blue line ➜ bullish confirmation ➜ target = X-level.
Still corrective, but the next impulse is close. ⚡
LINKPrice is still trading below the descending trendline, and the lower highs and lower lows structure suggests bearish momentum remains dominant. If the 14 دلار support breaks, the move toward 12.50 دلار becomes likely, while a breakout above the trendline may open the path to 15.30 دلار.