#LINK/USDT LONG SIGNAL#LINK
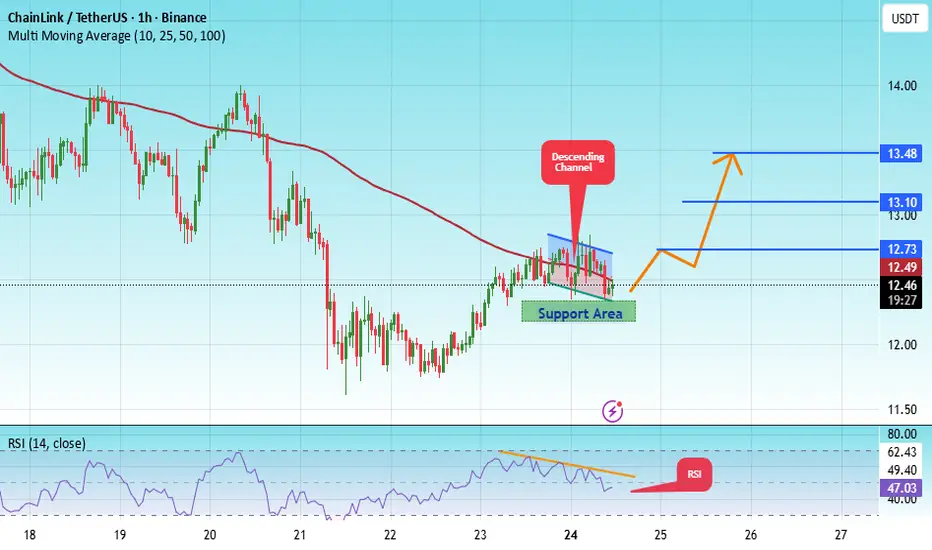
The price is moving within an ascending channel on the 1-hour timeframe and is adhering to it well. It is poised to break out strongly and retest the channel.
We have a downtrend line on the RSI indicator that is about to break and retest, which supports the upward move.
There is a key support zone in green at 12.27, representing a strong support point.
We have a trend to stabilize above the 100-period moving average.
Entry price: 12.48
First target: 12.73
Second target: 13.10
Third target: 13.48
Don't forget a simple money management rule:
Place your stop-loss order below the green support zone.
Once the first target is reached, save some money and then change your stop-loss order to an entry order.
For any questions, please leave a comment.
Thank you.
LINKUSD
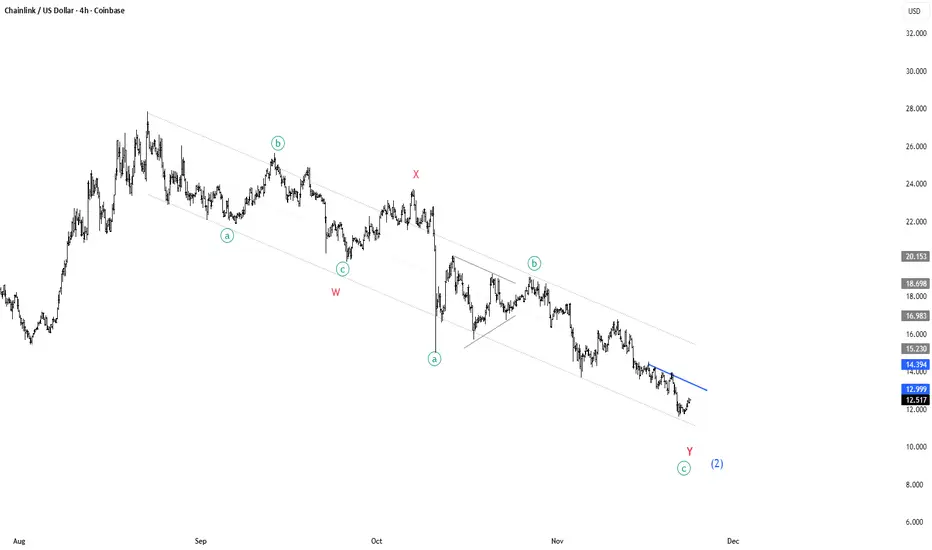
CHAINLINK is turning around for a massive rally!🔗 CRYPTOCAP:LINK – Elliott Wave Breakdown (4H Chart)
Current structure still fits a W–X–Y corrective decline, but we’re now approaching a critical trigger level. A clean punch through the blue trendline = buy signal. 🎯
🟦 What the structure shows:
🔻 Wave W complete:
• Clear a–b–c zigzag
• Strong reaction into the X connector
🔷 Wave X at the mid-channel zone:
• Acts as the next major upside target if we break out
• Provides structural symmetry between W and Y
🔻 Wave Y in progress:
• Again forming a–b–c
• C-leg looks terminal, aligning with channel support
📉 Price is compressing under the descending blue trendline (b-wave resistance of Y)
🚀 Trade trigger:
A decisive breakout above the blue trendline = start of the next impulsive leg
Upside target: the region around the prior X high
That zone is both:
• 🔹 Structural retracement
• 🔹 Upper channel magnet
• 🔹 Ideal first take-profit region
📌 Summary:
Break the blue line ➜ bullish confirmation ➜ target = X-level.
Still corrective, but the next impulse is close. ⚡
LINKPrice is still trading below the descending trendline, and the lower highs and lower lows structure suggests bearish momentum remains dominant. If the 14 دلار support breaks, the move toward 12.50 دلار becomes likely, while a breakout above the trendline may open the path to 15.30 دلار.
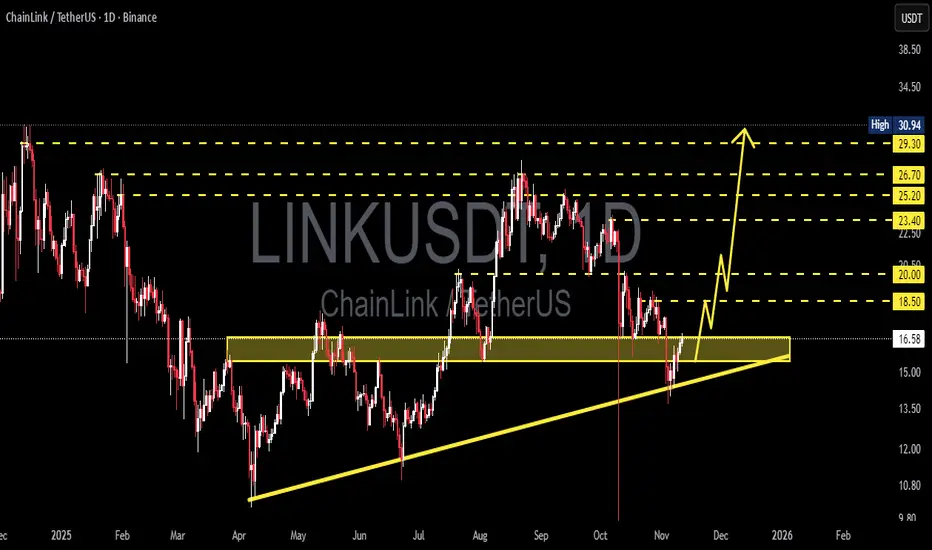
LINK/USDT - Ready to Explode? Uptrend Structure Tested?Chainlink (LINK) is now positioned at the most crucial zone in its mid-term technical structure — the 16.6–15.5 USDT area is not just a simple support, but a confluence zone between horizontal support and an ascending trendline that has been holding since April 2025.
Currently, price is reacting positively within this area, indicating that market participants are still defending the broader uptrend structure. However, if this zone fails to hold, the structure may collapse — paving the way for a deeper correction.
---
Pattern & Market Structure
Ascending Trendline Support: formed since April and still holding selling pressure.
Yellow Demand Zone (16.6–15.5): a strong accumulation area, tested multiple times this year.
Range-to-Trend Formation: price attempting to break out from sideways range into trend continuation.
Layered Resistances Above: 18.5 → 20.0 → 23.4 → 25.2 → 26.7 → 29.3 acting as step-by-step upside targets if the trend continues.
---
Bullish Scenario — Potential Reversal from a Strong Base
If price manages to hold and bounce strongly from the 16.6–15.5 zone, it opens the door for forming a new higher low that could become the foundation for the next rally.
Bullish confirmation: Daily close above 16.6 with reversal candle (hammer/bullish engulfing) and increasing volume.
Step-by-step upside targets:
18.5 → first psychological resistance.
20.0 → prior supply reaction area.
23.4–25.2 → potential breakout continuation zone.
Extended target: If momentum sustains, the ultimate target sits around 29.3–30.9, the yearly high.
Strategy:
Gradual buy within support zone with disciplined stop loss below 15.0. Additional confirmation entry if daily close >18.5.
---
Bearish Scenario — Breakdown as the Start of a Deeper Correction
However, if price breaks below 15.5 with strong volume, the bullish structure will be invalidated.
Bearish confirmation: Daily close below both trendline and 15.5.
Downside targets:
13.0 → previous horizontal support from May.
10.8 → macro base from 2024.
Additional signals: RSI breakdown, or failed retest below 16.6 after the break.
Strategy:
Wait for a failed retest around 15.5–16.0 for a short/hedge setup targeting 13.0.
---
Technical Perspective
The market is currently in a strategic neutral zone — between a potential major reversal and a confirmed breakdown. This is a decision phase, where volume and daily candle patterns will dictate the next dominant direction.
From a mid-term perspective, holding the ascending trendline means maintaining the macro uptrend structure, which could drive LINK back toward the 25–30 USD region. Conversely, losing this support may shift the structure into a new downtrend toward the long-term accumulation area below 13 USD.
---
Final Note
The 16.6–15.5 zone is more than just a number — it’s the psychological boundary between conviction and doubt.
Short-term traders look for a bounce, while long-term investors await directional confirmation.
Watch the daily close, volume, and trendline reaction closely. This is where the market decides: rebound toward 20+ or fall back to 13.
---
#Chainlink #LINKUSDT #CryptoAnalysis #TechnicalAnalysis #SupportAndResistance #Trendline #CryptoSetup #PriceAction #CryptoMarket
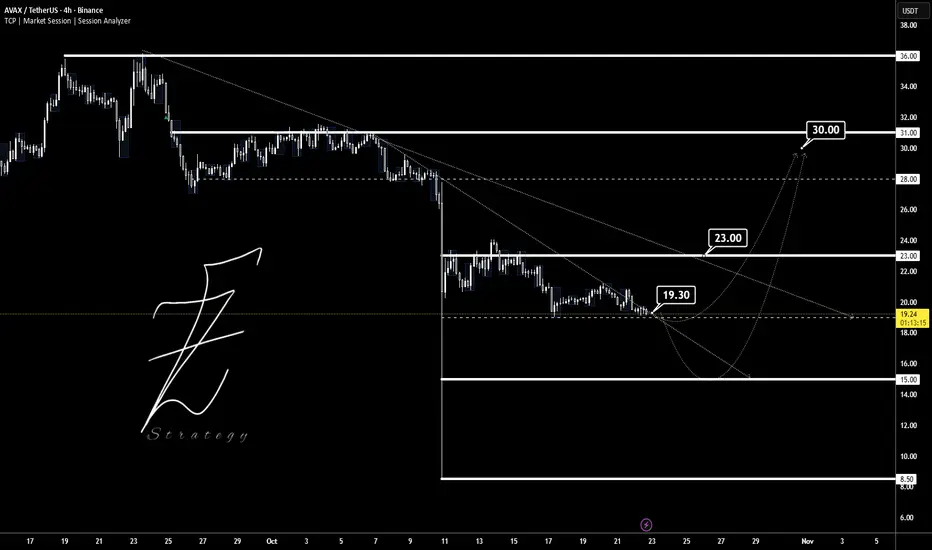
AVAXUSDTThis chart is The try that breakout trendline to way in 30$ target.
Supports: 19 - 15 -8.5
Resistance: 23 - 30 - 36
⚠️ Please control money management.
BINANCE:AVAXUSDT
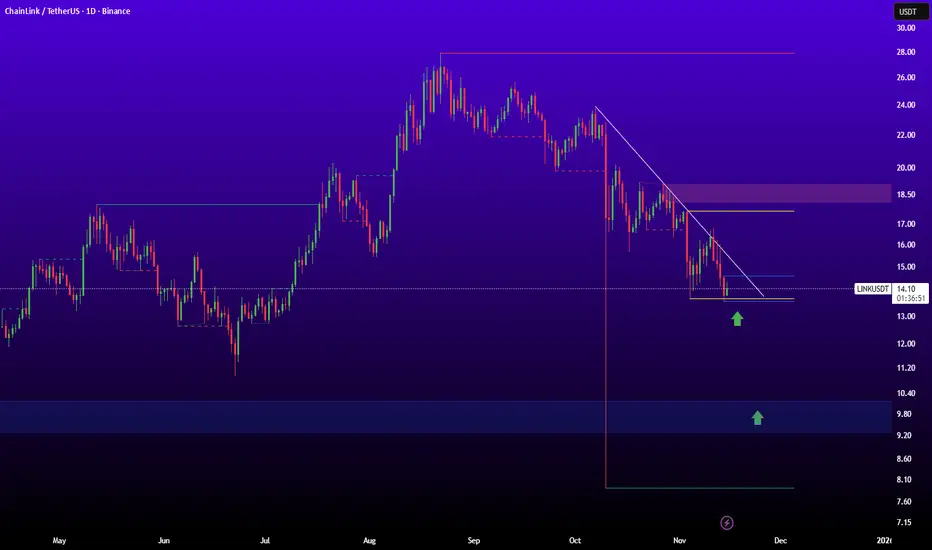
CHAINLINK LINK - 1D - 1W TFAfter the end of the bear trend, price started forming a clean ascending channel.
The midline of the channel (dashed zone) marks a phase of uncertainty, often leading to shakeouts or temporary consolidations.
Area between the white dashed and green line can be viewed as a position-building zone, where smart money accumulates before a short-term or long-term upward move (ellipses).
Once the price breaks and confirms above this range, the probability of a move toward the upper boundary of the channel increases significantly.

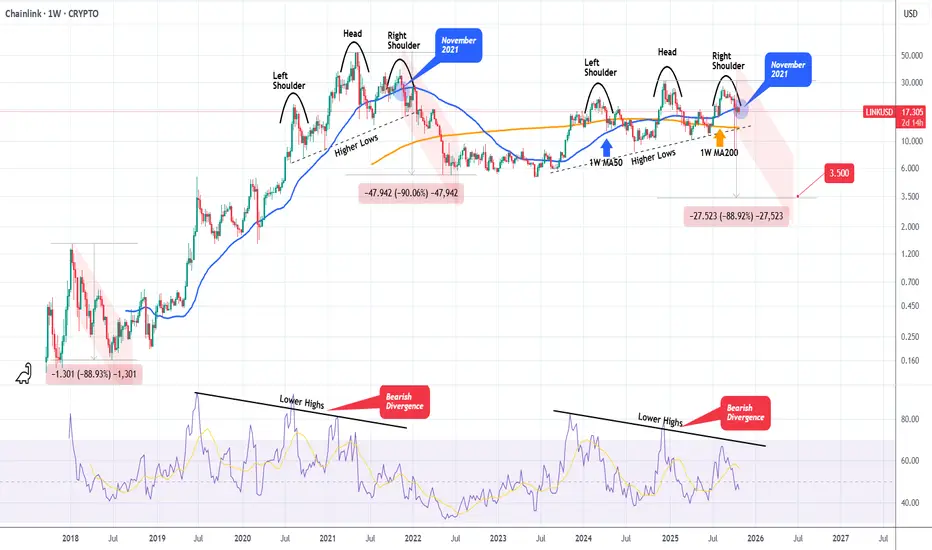
LINKUSD Massive Head and Shoulders starting the new Bear Cycle. Chainlink (LINKUSD) has been steadily rising within a Channel Up during this Bull Cycle but on the recent August 18 2025 High, it failed to make a Higher High and got rejected instead.
The Channel Up seems to have transitioned into a Head and Shoulders (H&S) pattern, while the 1W RSI has been on a Bearish Divergence (Lower Highs trend-line against the price's Higher Highs).
We saw a similar H&S forming at the end of the previous Bull Cycle (2021), which essentially paved the way to the 2022 Bear Cycle. Symmetrically it appears to also work quite well as right now we are on a similar spot (1W MA50, blue trend-line) as November 2021.
The two Bear Cycles of LINK declined by -88.90% and -90.00% respectively. As a result, if history repeats, we are looking at a potential bottom at at least $3.500 (-88.90%).
Do you think that's a realistic expectation?
-------------------------------------------------------------------------------
** Please LIKE 👍, FOLLOW ✅, SHARE 🙌 and COMMENT ✍ if you enjoy this idea! Also share your ideas and charts in the comments section below! This is best way to keep it relevant, support us, keep the content here free and allow the idea to reach as many people as possible. **
-------------------------------------------------------------------------------
💸💸💸💸💸💸
👇 👇 👇 👇 👇 👇
LINK: Shows Upward Momentum LINK has recently shown modest upward momentum. Under our primary scenario, we anticipate that turquoise wave 1 will push price above the resistance level at $30.95, followed by a corrective wave 2. However, if price continues to decline and falls below support at $8.25, we will expect a new wave alt.(B) low in magenta to form within our similarly colored alternative Target Zone ranging from $7.04 to $2.12 (probability: 37%).

LINK FOR BUYHello friends
After a long time of suffering, Link finally made a move and collected good liquidity that can make it prone to good growth. And the safest way, as I always tell you, is to buy in stages and with respect to capital and risk management.
The goals are also clear
*Trade safely with us*

$LINK – PREPARING FOR A BIG DUMP – SQUEEZE TRAIN LOADING Traders,
I BELIEVE THE CRYPTO MARKET IS SETTING UP FOR A BIG, BIG, BIG DUMP!, NOT JUST LINK!
Last time, we nailed the BIST:LINK short from $24.55 — it hit Target 1 and Target 2 (the two boxes below) pixel perfect.
From $20.00 we expected a retrace back up toward the $23.00 region, before a potential dump to $17.00.
That scenario may now be unfolding.
Let’s break it down:
CVD & Market Participation – Bearish Divergence Building
Aggregated CVD Spot → still relatively flat → tells us there’s no real spot demand or accumulation. Spot buyers are not fueling this push.
Aggregated CVD Futures (Stablecoin-margined) → moving aggressively higher → lots of leveraged traders chasing the move up.
Aggregated CVD Futures (Coin-margined) → also moving aggressively higher → even riskier longs, since collateral is crypto itself (double downside risk if LINK sells off).
👉 Why this is a bearish divergence:
Price is being pushed higher only by aggressive leveraged longs, while spot (the foundation of demand) is not confirming. This creates a fragile rally that can easily unwind into a long squeeze.
Order Flow – Signs of Absorption
On Binance & Bybit perps, we see aggressive buyers stepping in (CVD making higher highs).
But price is not moving higher accordingly.
This is a classic absorption signal: passive limit sellers are absorbing the buying pressure, preparing for reversal.
Market Context – Entering the PRZ ($23–24)
HTF VAL (Value Area Low) at this region.
LTF VAL aligns perfectly here too.
Single Prints (TPO profile) → thinly traded zones where price moved quickly in the past, often acting as magnets and reversal points.
Imbalances stacking at these levels, showing inefficiency that can flip.
AVWAP Confluence → multiple anchored VWAPs cluster in this zone, creating strong resistance.
All of this builds a confluence-heavy Potential Reversal Zone (PRZ) at $23–24.
My Take
We are entering a Reversal Zone packed with:
No real spot demand,
Leveraged longs chasing,
Absorption in order flow,
Strong technical confluence (VALs, TPO singles, Imbalances, AVWAP).
⚠️ This is the perfect fuel for a long squeeze dump back toward $17.00.
Trade safe, manage risk. Adios 🚀🔪

LINKUSD – Bullish Impulse Toward D-Point Target
LINKUSDT:
Title: LINKUSD – Bullish Impulse Toward D-Point Target
Price action has completed a corrective ABC structure, finding strong support at point C. The current breakout above mid-structure resistance confirms bullish momentum, aiming toward the D-point completion. Risk is managed below the breakout zone, with potential for trend continuation if price sustains above local support.
Risk Management Notes:
– Entry aligned with breakout confirmation
– Stop-loss below structural support (C-area)
– Take-profit near projected D-point completion

LINKUSD - Breaking Out of Symmetrical TriangleA symmetrical Triangle on LINKUSD
These are considered a bullish pattern on this weekly timeframe
Looking for a breakout

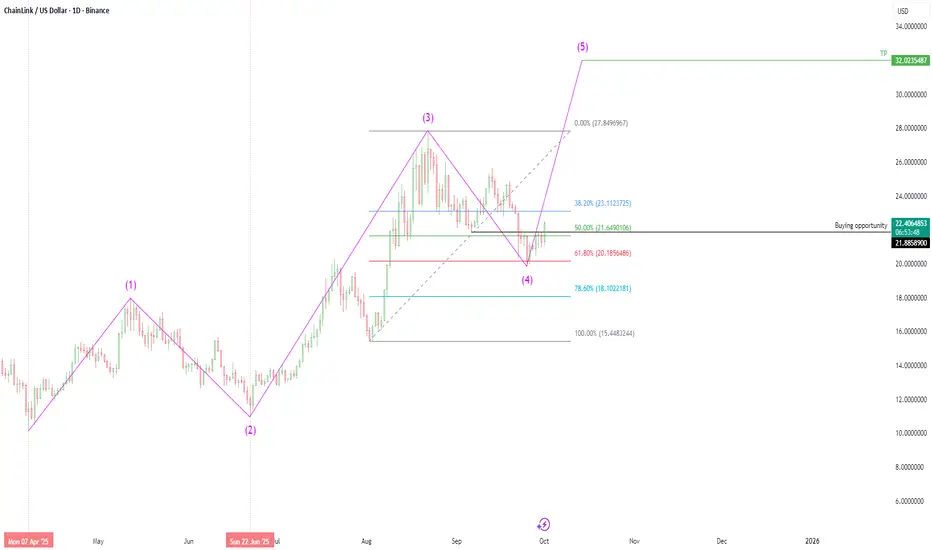
Link UPDATE (1D)LINK is about to complete its accumulation phase. On the daily chart, it’s breaking out of a clearly visible bull flag pattern, and according to Elliott Wave Theory, the 5th wave is now beginning.
If LINK manages to hold above $20, it could be on its way toward a target zone between $34 and $35.

Chainlink (LINK/USD) - Elliott Wave AnalysisBased on Elliott Wave Theory, Chainlink (LINK/USD) appears to have successfully completed its corrective Wave 4, as evidenced by the recent stabilization and reversal patterns observed on the daily timeframe. This completion sets the stage for the anticipated impulsive Wave 5, which is now clearly visible on the daily chart. The structure suggests a continuation of the broader uptrend, with increased momentum likely to drive prices toward higher targets.
LINK/USDT - Ready for Takeoff? Major Bullish Reversal in Play!🚀 Trade Setup Details:
🕯 #LINK/USDT 🔼 Buy | Long 🔼
⌛️ TimeFrame: 1D
--------------------
🛡 Risk Management (Example):
🛡 Based on $10,000 Balance
🛡 Loss-Limit: 1% (Conservative)
🛡 The Signal Margin: $534.47
--------------------
☄️ En1: 20.74 (Amount: $53.45)
☄️ En2: 19.34 (Amount: $187.06)
☄️ En3: 18.4 (Amount: $240.51)
☄️ En4: 17.51 (Amount: $53.45)
--------------------
☄️ If All Entries Are Activated, Then:
☄️ Average.En: 18.87 ($534.47)
--------------------
☑️ TP1: 24.56 (+30.15%) (RR:1.61)
☑️ TP2: 27.87 (+47.69%) (RR:2.55)
☑️ TP3: 32.73 (+73.45%) (RR:3.93)
☑️ TP4: 40.16 (+112.82%) (RR:6.03)
☑️ TP5: 50.34 (+166.77%) (RR:8.91)
☑️ TP6: Open 🔝
--------------------
❌ SL: 15.34 (-18.71%) (-$100)
--------------------
💯 Maximum.Lev: 3X
⌛️ Trading Type: Swing Trading
‼️ Signal Risk: 🙂 Low-Risk! 🙂
🔎 Technical Analysis Breakdown:
This technical analysis is based on Price Action and Smart Money Concepts. All entry points, Target Points, and the Stop Loss are calculated using professional mathematical calculations. As a result, you can have an optimal trade setup based on great risk management.
Technically, LINK is bouncing off key support levels and forming a solid accumulation structure, suggesting strong hands are preparing for a breakout. With multiple confluences aligning — including long-term trend support and bullish divergence — this setup favors patient swing entries with impressive risk-to-reward potential.
📊 Sentiment & Market Context:
Chainlink (LINK) is showing signs of renewed bullish strength following a consolidation phase and broader market resilience. The crypto market has recently seen improved sentiment amid increasing institutional involvement and growing anticipation around real-world asset tokenization — a core use case for Chainlink's oracle solutions.
🔎 About LINK:
Chainlink is a decentralized oracle network that enables smart contracts to securely interact with real-world data. It plays a critical role in DeFi, insurance, gaming, and more — bridging on-chain and off-chain systems. As adoption of decentralized infrastructure grows, LINK continues to position itself as a key infrastructure asset in the blockchain ecosystem
⚠️ Disclaimer:
Trading involves significant risk, and past performance does not guarantee future results. This analysis is for informational purposes only and should not be considered financial advice. Always conduct your research and trade responsibly.
💡 Stay Updated:
Like this technical analysis? Follow me for more in-depth insights, technical setups, and market updates. Let's trade smarter together!

LINK/USDT Weekly FVG Tap
BINANCE:LINKUSDT has arrived right at a strong level that I see as a solid opportunity to enter.
This zone, together with the lower DCA area I highlighted as backup, looks like a prime region to build a spot position on LINK.
I’ll share another update if needed.

LINKUSDTLast week BINANCE:LINKUSDT , after touching 24.80 dollars 🚀, the price failed to hold and moved into correction. The overall structure still shows a range between key support and resistance, with compression signaling the potential start of the next trend. Currently, momentum leans slightly bearish 📉, but the market has not yet confirmed a clear direction.
Key Levels:
Initial support: 23.18 dollars 🛡️
Next supports: 22.50 dollars – 21.60 dollars
Nearby resistance: 24.40 dollars
Higher resistances: 25.20 dollars – 26.50 to 27.50 dollars 🎯

LINK LONG AND SHORT IDEAHi guys . i have this setup for BINANCE:LINKUSDT a double position . a long to upper FVG then short from there . in both case my SL above and blow major pivots.

LINK / USDT : Showing strong momentum LINK/USDT is showing strong momentum and preparing to break out of a symmetrical triangle.
📌 Entry: $23.60 – $24.38
🎯 Targets: $26 – $28 – $30
⛔ Stop Loss: $22.30
Always manage risk properly and DYOR ✅

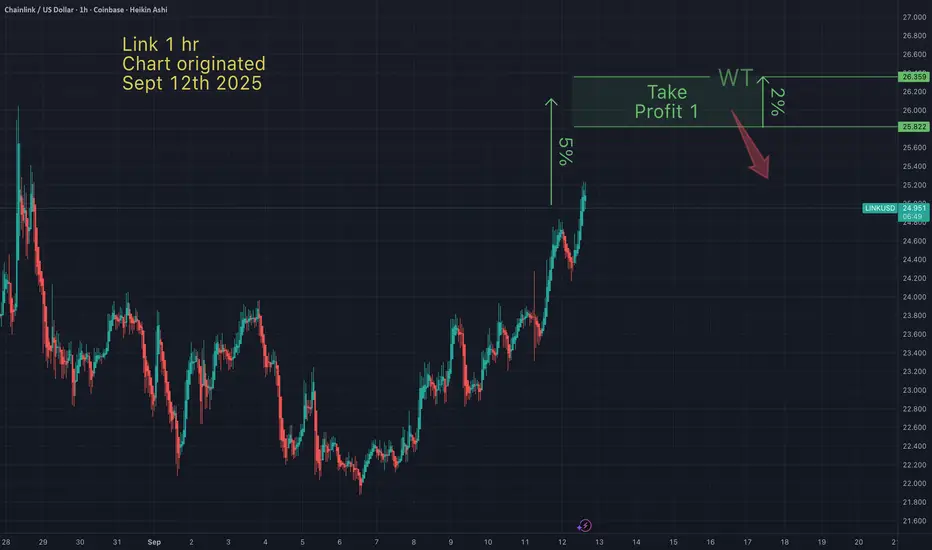
Link - Take profit targetI anticipate Link will hit my take profit this weekend. I bought the bottom last Sunday, so I'm happy with my profits, even if Link goes higher than my TP.
May the trends be with you.
DeGRAM | LINKUSD is forming a triangle📊 Technical Analysis
● LINK/USD is consolidating at the $21.37 support zone, with accumulation signals suggesting buyers are defending this level.
● The price structure remains within an ascending channel, and a rebound here could trigger a push toward $24.00 and potentially the $27.87 resistance.
💡 Fundamental Analysis
● Chainlink adoption continues to expand, with fresh integrations into DeFi protocols and rising oracle usage boosting long-term demand, reinforcing bullish sentiment.
✨ Summary
Bullish above $21.37; targets $24.00 → $27.87. Invalidation on a close below $21.00.
-------------------
Share your opinion in the comments and support the idea with a like. Thanks for your support!

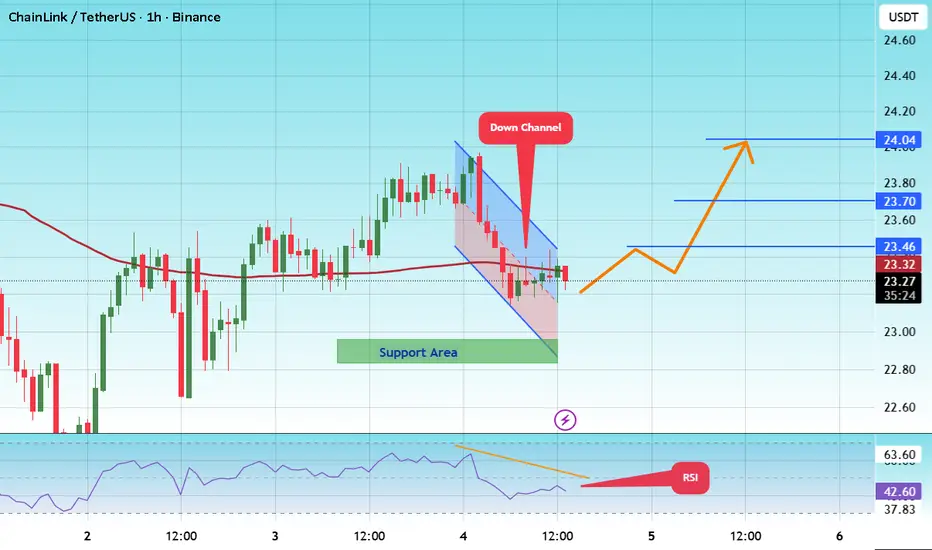
#LINK/USDT – Triangle Pattern Breakout Loading?#LINK
The price is moving within a descending channel on the 1-hour frame and is expected to break and continue upward.
We have a trend to stabilize above the 100 moving average once again.
We have a downtrend on the RSI indicator that supports the upward move with a breakout.
We have a support area at the lower boundary of the channel at 23.00, acting as strong support from which the price can rebound.
We have a major support area in green that pushed the price higher at 23.00.
Entry price: 23.26
First target: 23.46
Second target: 23.70
Third target: 24.00
To manage risk, don't forget stop loss and capital management.
When you reach the first target, save some profits and then change the stop order to an entry order.
For inquiries, please comment.
Thank you.
LINK/USDT — Golden Zone Will Decide the Next Move!?Current Price: ~23.47 USDT
Chainlink (LINK) has just completed a strong rally from the yearly low at 10.10 to the peak of 30.94. Now, the price is consolidating and retesting the Fibonacci Golden Pocket — a critical area that will decide whether the uptrend continues or a deeper pullback occurs.
---
🔎 Market Structure Analysis
Primary Trend: Strong bullish reversal since June 2025, with higher highs and higher lows forming.
Current Condition: Price is pulling back from the recent top (30.94) and consolidating around 23–25, right above the Golden Pocket (21.18–19.86).
Key Demand Zone: The yellow area (19.8–21.2), previously a strong resistance, is now acting as support (supply → demand flip). Holding this zone is crucial for the next big move.
---
🟢 Bullish Scenario
If LINK holds above 21.18–19.86, the current move is likely just a healthy retracement before continuation.
Confirmation: Daily close above 25.24–26.65 with rising volume.
Upside Targets:
🎯 Target 1: 25.24 (minor resistance)
🎯 Target 2: 26.65 (key breakout level)
🎯 Target 3: 29.20
🎯 Target 4: 30.8–31.0 (previous high)
Breaking above 30.8 could open the door for new highs in the coming months.
---
🔴 Bearish Scenario
If price fails to defend the 19.86–21.18 zone, a deeper correction may unfold.
Confirmation: Daily close below 19.8 with strong selling volume.
Downside Targets:
⚠️ Target 1: 15.63 (Fib 0.5)
⚠️ Target 2: 14.69 (Fib 0.618)
⚠️ Extreme Target: 10.10 (yearly low in case of panic sell).
---
📌 Key Technical Patterns
Bullish Flag / Consolidation: Current price action resembles a bull-flag formation after a strong impulse.
Supply-Demand Flip: The yellow zone (19.8–21.2) flipped from resistance into support — a decisive area for market structure.
Golden Pocket Fib: 0.5–0.618 retracements are historically strong levels for trend continuation.
---
🧠 Conclusion & Strategy
LINK is currently at a make-or-break golden zone.
Bullish Case: Holding above 19.8–21.2 keeps the bullish structure intact → targets at 26.6, 29.2, and 31.
Bearish Case: A breakdown below 19.8 opens risk for a correction toward 14–15 or even back to 10.1.
Trading Plan:
Accumulate near 21–23 if signs of bounce appear.
Breakout entry above 26.65 for swing targets at 29–31.
Place stop-loss below 19.8 to protect long setups.
Take partial profits at each resistance level.
---
📌 LINK is standing at a critical decision zone. Will buyers defend this golden pocket to fuel another leg up toward 30+? Or will sellers drag the price back to 15 and below?
#LINK #LINKUSDT #Chainlink #CryptoAnalysis #Altcoins #SwingTrading #TechnicalAnalysis #CryptoTA #Fibonacci #PriceAction
