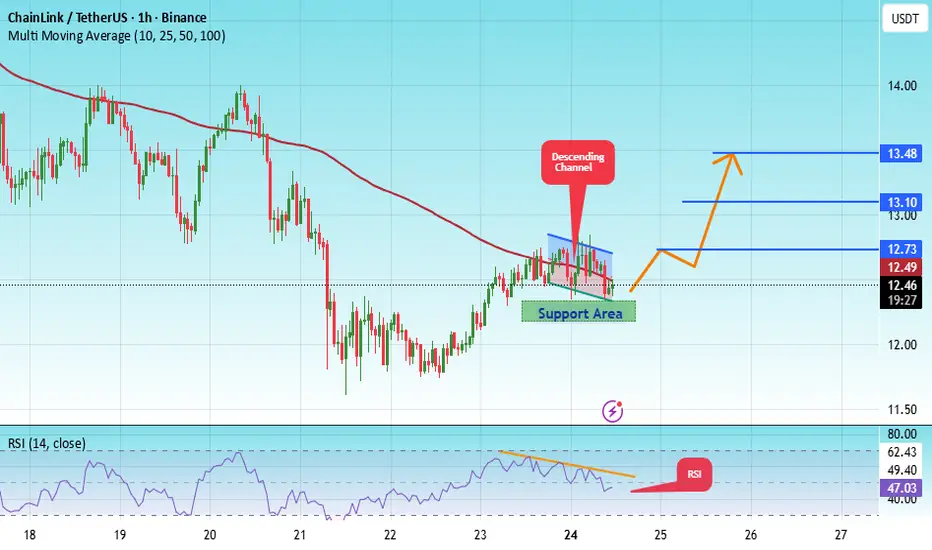
#LINK/USDT LONG SIGNAL#LINK
The price is moving within an ascending channel on the 1-hour timeframe and is adhering to it well. It is poised to break out strongly and retest the channel.
We have a downtrend line on the RSI indicator that is about to break and retest, which supports the upward move.
There is a key support zone in green at 12.27, representing a strong support point.
We have a trend to stabilize above the 100-period moving average.
Entry price: 12.48
First target: 12.73
Second target: 13.10
Third target: 13.48
Don't forget a simple money management rule:
Place your stop-loss order below the green support zone.
Once the first target is reached, save some money and then change your stop-loss order to an entry order.
For any questions, please leave a comment.
Thank you.
Linkusdsignals
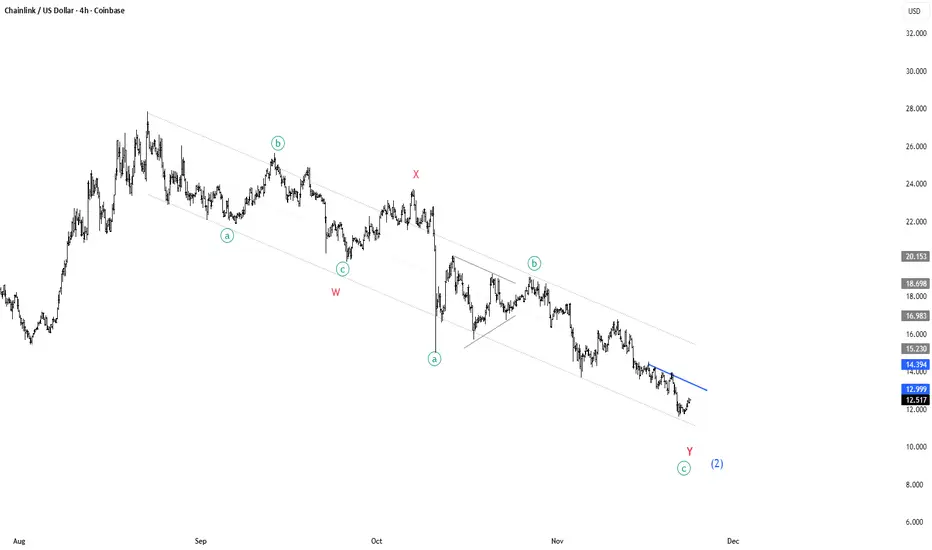
CHAINLINK is turning around for a massive rally!🔗 CRYPTOCAP:LINK – Elliott Wave Breakdown (4H Chart)
Current structure still fits a W–X–Y corrective decline, but we’re now approaching a critical trigger level. A clean punch through the blue trendline = buy signal. 🎯
🟦 What the structure shows:
🔻 Wave W complete:
• Clear a–b–c zigzag
• Strong reaction into the X connector
🔷 Wave X at the mid-channel zone:
• Acts as the next major upside target if we break out
• Provides structural symmetry between W and Y
🔻 Wave Y in progress:
• Again forming a–b–c
• C-leg looks terminal, aligning with channel support
📉 Price is compressing under the descending blue trendline (b-wave resistance of Y)
🚀 Trade trigger:
A decisive breakout above the blue trendline = start of the next impulsive leg
Upside target: the region around the prior X high
That zone is both:
• 🔹 Structural retracement
• 🔹 Upper channel magnet
• 🔹 Ideal first take-profit region
📌 Summary:
Break the blue line ➜ bullish confirmation ➜ target = X-level.
Still corrective, but the next impulse is close. ⚡
LINKPrice is still trading below the descending trendline, and the lower highs and lower lows structure suggests bearish momentum remains dominant. If the 14 دلار support breaks, the move toward 12.50 دلار becomes likely, while a breakout above the trendline may open the path to 15.30 دلار.
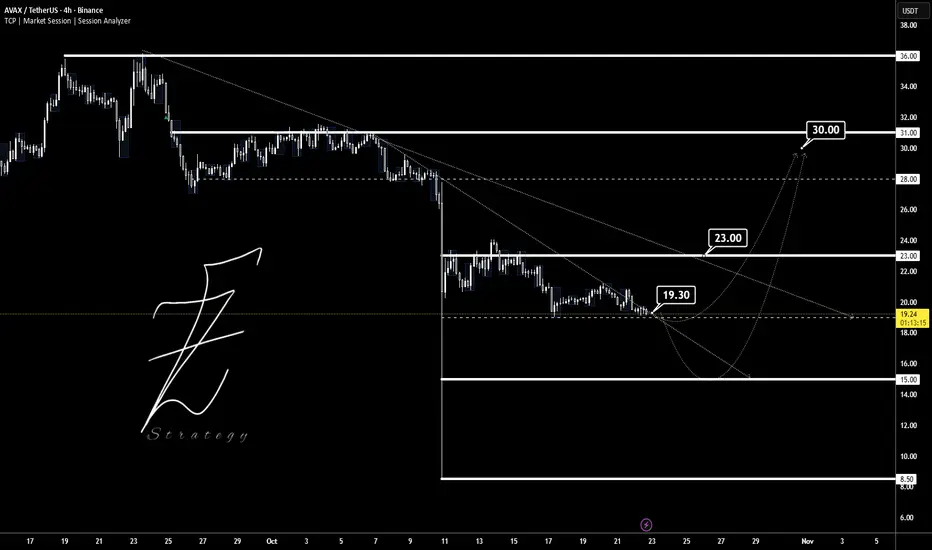
AVAXUSDTThis chart is The try that breakout trendline to way in 30$ target.
Supports: 19 - 15 -8.5
Resistance: 23 - 30 - 36
⚠️ Please control money management.
BINANCE:AVAXUSDT
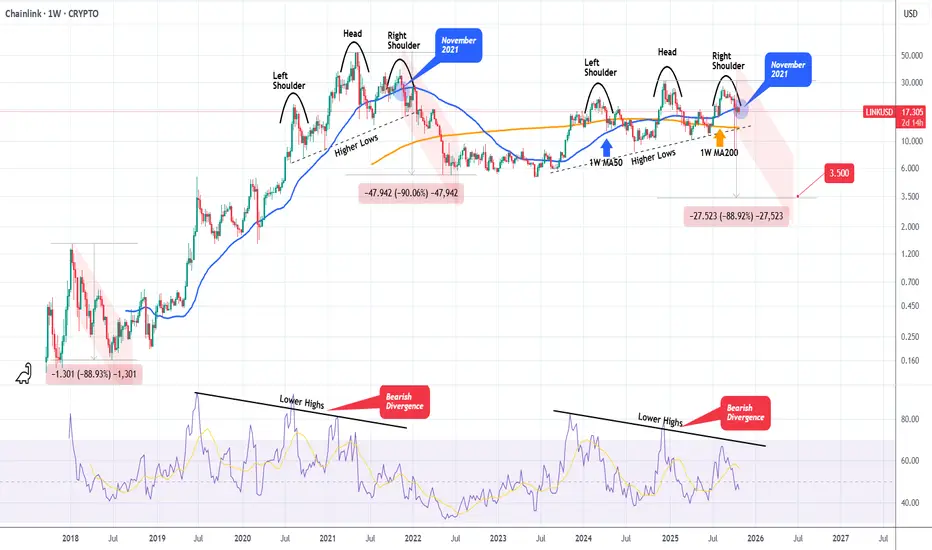
LINKUSD Massive Head and Shoulders starting the new Bear Cycle. Chainlink (LINKUSD) has been steadily rising within a Channel Up during this Bull Cycle but on the recent August 18 2025 High, it failed to make a Higher High and got rejected instead.
The Channel Up seems to have transitioned into a Head and Shoulders (H&S) pattern, while the 1W RSI has been on a Bearish Divergence (Lower Highs trend-line against the price's Higher Highs).
We saw a similar H&S forming at the end of the previous Bull Cycle (2021), which essentially paved the way to the 2022 Bear Cycle. Symmetrically it appears to also work quite well as right now we are on a similar spot (1W MA50, blue trend-line) as November 2021.
The two Bear Cycles of LINK declined by -88.90% and -90.00% respectively. As a result, if history repeats, we are looking at a potential bottom at at least $3.500 (-88.90%).
Do you think that's a realistic expectation?
-------------------------------------------------------------------------------
** Please LIKE 👍, FOLLOW ✅, SHARE 🙌 and COMMENT ✍ if you enjoy this idea! Also share your ideas and charts in the comments section below! This is best way to keep it relevant, support us, keep the content here free and allow the idea to reach as many people as possible. **
-------------------------------------------------------------------------------
💸💸💸💸💸💸
👇 👇 👇 👇 👇 👇
LINK Spot LONG LINK Spot LONG📈
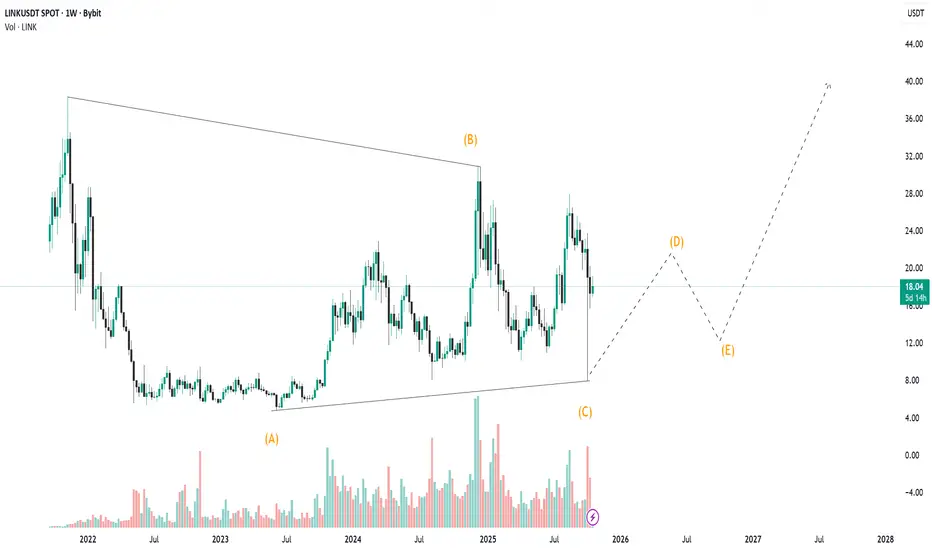
Due to the formation of a zigzag structure, I am more inclined to form a triangle and further exit from it upwards. I no longer consider it as an impulse.
Expectations have not changed, I plan to start recording after updating the global maximum of 53.00. Only the time of the scenario implementation has changed, which may take a long time.
All altcoins with potential show approximately the same picture, which is encouraging. This structure provides the most accurate goals for profit-taking and scenario cancellation.
LINK FOR BUYHello friends
After a long time of suffering, Link finally made a move and collected good liquidity that can make it prone to good growth. And the safest way, as I always tell you, is to buy in stages and with respect to capital and risk management.
The goals are also clear
*Trade safely with us*

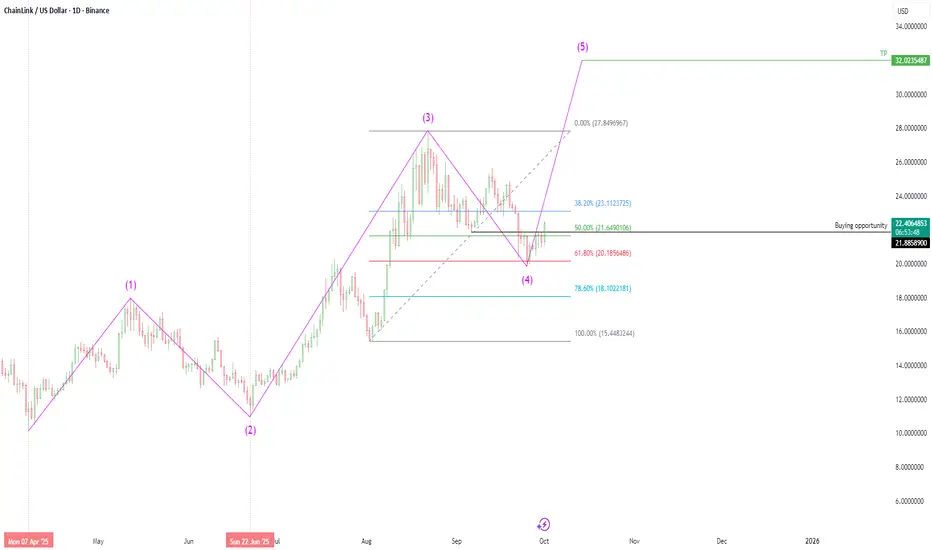
Chainlink (LINK/USD) - Elliott Wave AnalysisBased on Elliott Wave Theory, Chainlink (LINK/USD) appears to have successfully completed its corrective Wave 4, as evidenced by the recent stabilization and reversal patterns observed on the daily timeframe. This completion sets the stage for the anticipated impulsive Wave 5, which is now clearly visible on the daily chart. The structure suggests a continuation of the broader uptrend, with increased momentum likely to drive prices toward higher targets.
LINK/USDT Weekly FVG Tap
BINANCE:LINKUSDT has arrived right at a strong level that I see as a solid opportunity to enter.
This zone, together with the lower DCA area I highlighted as backup, looks like a prime region to build a spot position on LINK.
I’ll share another update if needed.

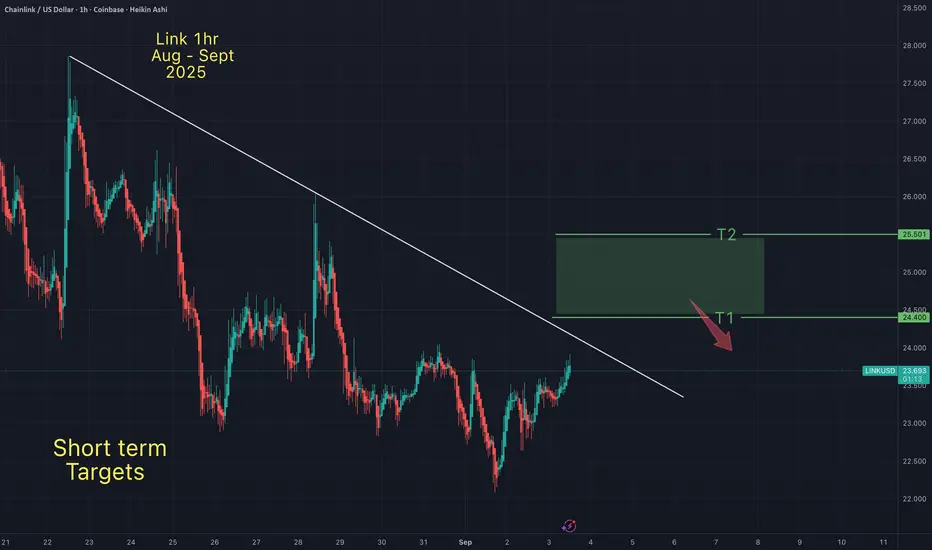
LINKUSDTLast week BINANCE:LINKUSDT , after touching 24.80 dollars 🚀, the price failed to hold and moved into correction. The overall structure still shows a range between key support and resistance, with compression signaling the potential start of the next trend. Currently, momentum leans slightly bearish 📉, but the market has not yet confirmed a clear direction.
Key Levels:
Initial support: 23.18 dollars 🛡️
Next supports: 22.50 dollars – 21.60 dollars
Nearby resistance: 24.40 dollars
Higher resistances: 25.20 dollars – 26.50 to 27.50 dollars 🎯

Link - Take profit targetI anticipate Link will hit my take profit this weekend. I bought the bottom last Sunday, so I'm happy with my profits, even if Link goes higher than my TP.
May the trends be with you.
BREAKING: Grayscale just filed for Chainlink $LINK ETF🚨BREAKING: Grayscale just filed for Chainlink CRYPTOCAP:LINK ETF with the SEC.
🟩20% + correction from previous monthly level Given
🟩Clean falling wedge & continuation pattern 📈
🟩Weekly ichimoku flipped bullish
🟩Long term uptrend keep supporting prices
🚀Next step: 30$+
Key support to be maintained for bull scenario:
20.00 - 19.50$

Chainlink 4H Update | LINK Testing $23.50My bias is still more upside mid-term. On the 4-hour chart, if LINK reclaims 23.50, the path opens toward 24.83 and 26.71. If it fails and drops below 22.78, the next supports are 21.92 and 21.62. The immediate battle is all about whether buyers can flip 23.50 back in their favor.

Link - Short term targetsI posted my midterm Link targets on my Aug 30th Link chart. These are my shorter term targets. I expect Link to follow Btc up to my Btc targets (see my Sept 2nd Btc chart). Then I expect both assets to retrace. At that point I will be on "lower low watch".
May the trends be with you.
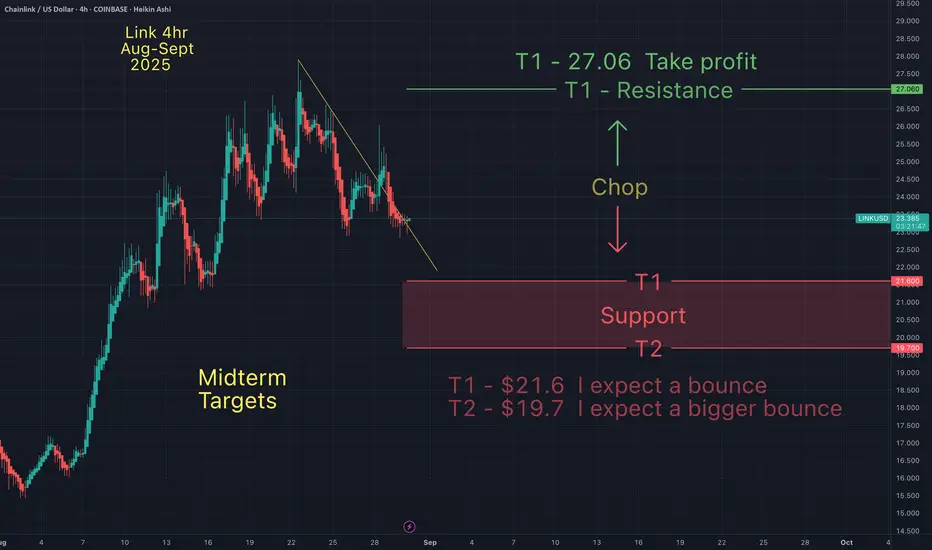
Link - Midterm support and resistance & my take profit targetsRecently, Link has been one of my favorite altcoins to trade. This chart shows my support and resistance levels & my take profits. Until the market reveals its trend duration, I anticipate chop between my support and resistance. But ultimately, these targets represent my ideal entries and exit.
May the trends be with you.
LINKUSD HIGH PROBABILITY SETUP SOON!!🚨LINKUSD HIGH PROBABILITY BUY SETUP 🚨
* Here We Can See Clearly The Next Potential Moves For LINKUSD Coming Hours/Days.
* Keep Your Eyes Close On Your Trading Positions.
* Happy PIP Hunting Traders.
£ FXKILLA £

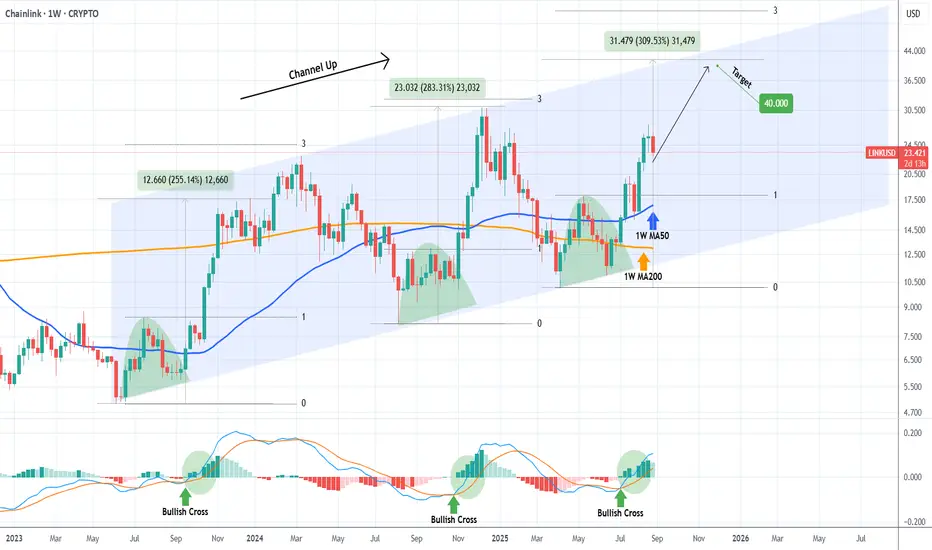
LINKUSD rally far from over, targeting $40 at least.Chainlink (LINKUSD) has been trading within a Channel Up since the June 05 2023 Low and in the past 4 months it has been unfolding the 3rd Bullish Leg of this pattern.
With the 1W MACD past a Bullish Cross (which has confirmed it), the previous Bullish Leg was about +30% stronger than the previous.
Assuming this holds for the current as well, we expect the rally to reach at least $40.00, which will be close to the pattern's top (Higher Highs trend-line) but still way below the 3.0 Fibonacci extension, a level the previous two Bullish Legs approached.
-------------------------------------------------------------------------------
** Please LIKE 👍, FOLLOW ✅, SHARE 🙌 and COMMENT ✍ if you enjoy this idea! Also share your ideas and charts in the comments section below! This is best way to keep it relevant, support us, keep the content here free and allow the idea to reach as many people as possible. **
-------------------------------------------------------------------------------
💸💸💸💸💸💸
👇 👇 👇 👇 👇 👇
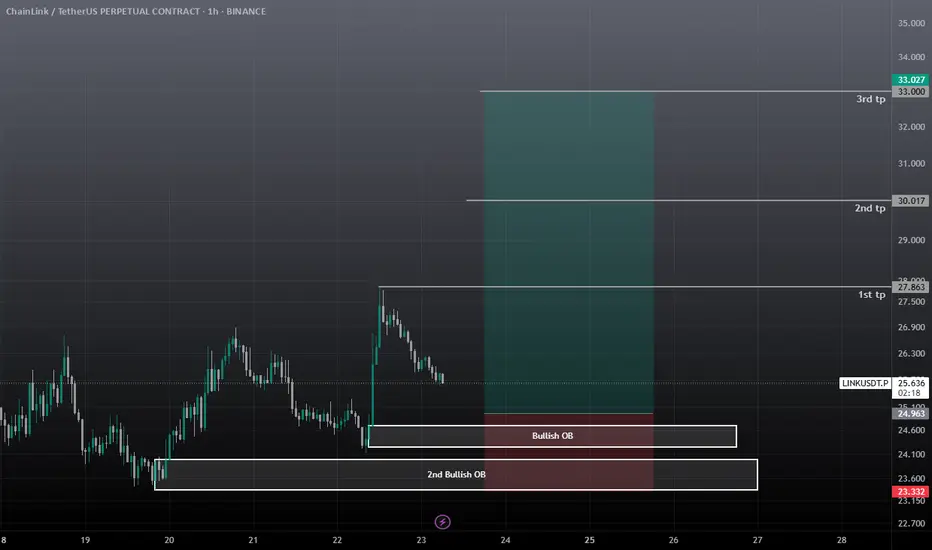
Link Long / Buy SetupLink has two Bullish OB, if first failed, 2nd OB will push the price, ETH bulish, link is also Bullish then. Use low risk as the pump was from an event so it can be a fakeout.
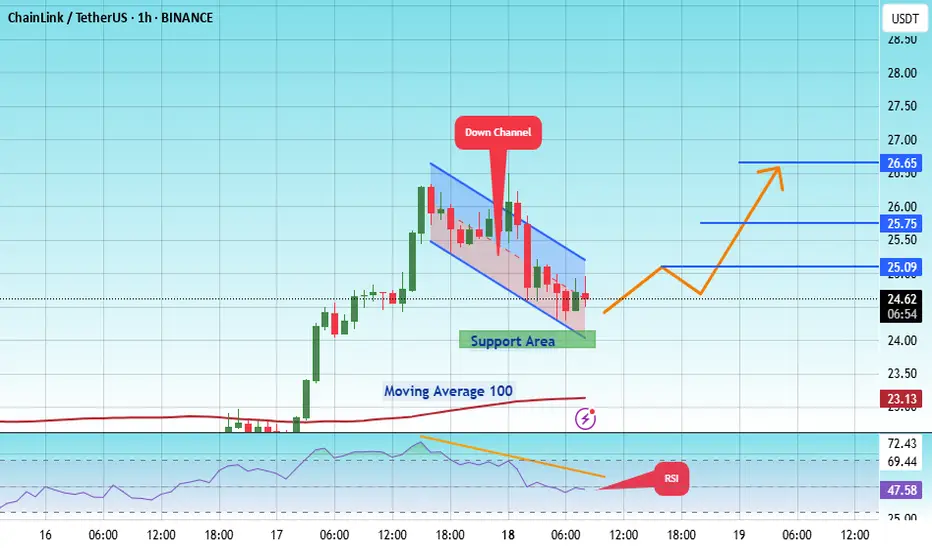
#LINK/USDT in upward mood !#LINK
The price is moving within an ascending channel on the 1-hour frame, adhering well to it, and is on track to break it strongly upwards and retest it.
We have support from the lower boundary of the ascending channel, at 24.20.
We have a downtrend on the RSI indicator that is about to break and retest, supporting the upside.
There is a major support area in green at 24.00, which represents a strong basis for the upside.
Don't forget a simple thing: ease and capital.
When you reach the first target, save some money and then change your stop-loss order to an entry order.
For inquiries, please leave a comment.
We have a trend to hold above the 100 Moving Average.
Entry price: 24.60.
First target: 25.09.
Second target: 25.75.
Third target: 26.65.
Don't forget a simple thing: ease and capital.
When you reach your first target, save some money and then change your stop-loss order to an entry order.
For inquiries, please leave a comment.
Thank you.
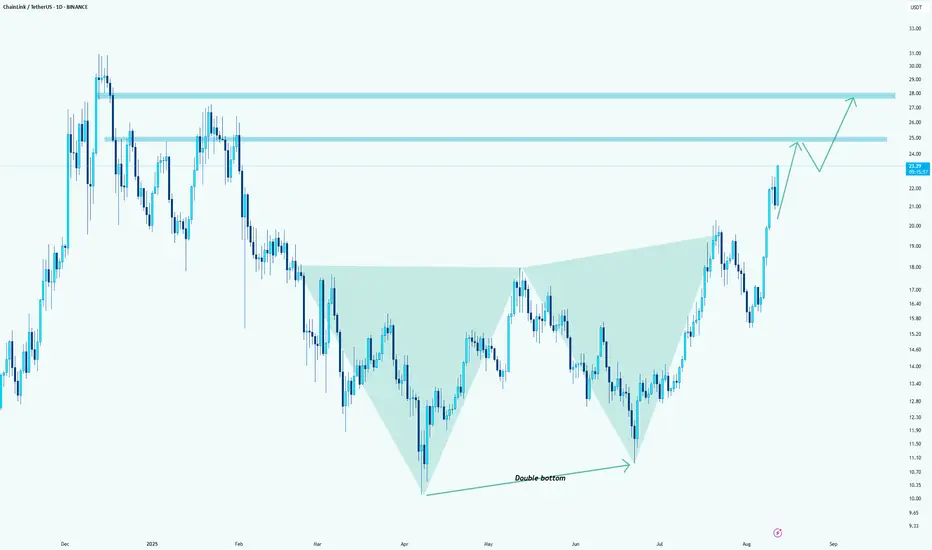
Link: it formed a double bottomHello guys.
Link formed a double bottom and a divergence at the same time!
You can count on longs here.
Target1: 25
Target2: 28
The pressure from buyers is high! I hope you can get it on the pullbacks
LINKUSDTThis chart is in a bullish trend, but it broke a new high at $22.7. If BINANCE:LINKUSDT can keep the price above $20, we can expect it to reach a higher high.
Please control risk management.⚠️

$LINK is up 54% from recent lows, now at $24. CRYPTOCAP:LINK is up 54% from recent lows, now at $24. Price is consolidating after the strong rally — holding above $20 could sustain momentum toward $28–$32, while losing this zone risks a deeper correction back to $15.

LINK Macro signs pointing towards a buyHi,
This is a Macro analysis on the 1 Month timeframe for LINKUSD pair.
I've been looking for opportunities to trade in altcoin market. With BTC in price discovery mode and other signs appearing like altcoin only market cap charts point towards liquidity coming in, it is important now than ever to be spending time to scope out opportunities here.
I do think that not all altcoins will behave the same, im trying to use TA to find those with strong technicals.
LINKUSD sticks out due to several factors.
1. We are in an ascending channel, that i believe currently price action will eventually attempt to reach the upper trend line. (We could be at the very moment be attempting this.)
2. Momentum indicators are flashing bullish, though note that there is still a long way to go for the current monthly candle to close.
Both MACD and STOCH RSI are flashing buys in my opinion.
If our August Candle closes with:
MACD flashing histogram bar as deep green with bullish cross and
STOCH RSI flashing bullish cross and cross occurs above the 20 line.
This would indicate a potential for Macro Bullish move to the upside. ANd i believe that move to be at the very least to the previous highs, if not to new all time highs.
For the 1Month to stay bullish, we need to look for more bullish evidence such as in lower timeframes like the 1 week or 3 day to support 1 Month changes. And Bulls need to maintain dominance in those timeframes for 1 Month to print bullish.
Stay tuned for more updates.
