Chainlink (LINK) – Spot Long Setup DevelopingWe're watching LINK closely as it approaches a key support zone that could act as a springboard for a reversal on the higher time frames. A pullback into this area may offer a high-risk/reward long entry, especially if bullish structure begins to form again.
🔹 Entry Zone: $12.50 – $13.50
🔹 Take Profit 1: $15.50 – $16.50
🔹 Take Profit 2: $19.00 – $21.00
🔹 Stop Loss: Weekly close below $12.00
This setup relies on price respecting the major support level. If we see a weekly candle close below $12, that would invalidate the idea and call for reassessment. Until then, it's a technical setup worth tracking for patient spot traders.
LINKUSDT

LINK next target is 10% gain toward 15.30$hi
BINANCE:LINKUSDT has completed the breakout of the descending channel to the upside and if breakout of the next weekly resistance area happen we can see more gain at least 10% toward 15.30$

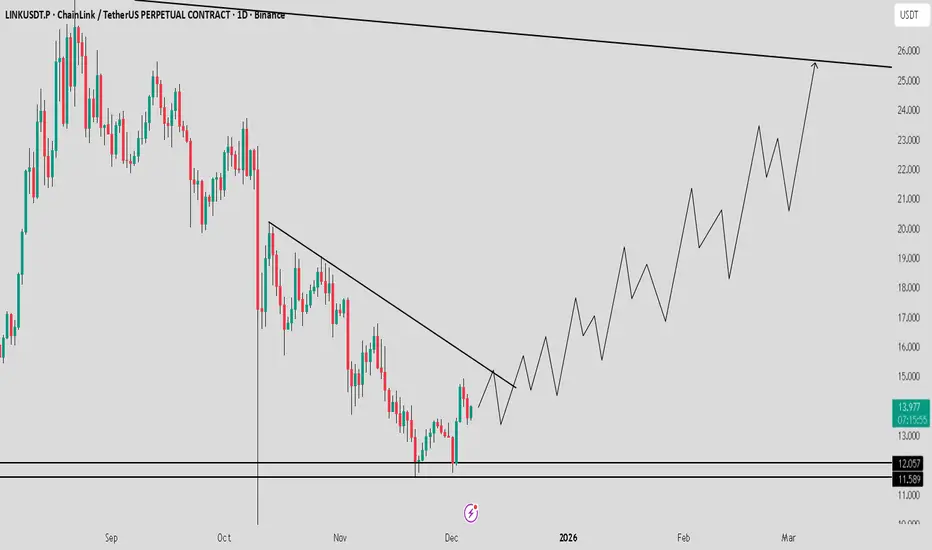
LINK/USDT 1W Chart Long-Term📌 PRICE STRUCTURE
Long-term trend: still up, confirmed by the ascending trendline (orange).
The price respects the trendline – each dip below was bought.
We are now in the midst of a strong upward impulse correction (peak ~$26–27).
🟢 KEY LEVELS
Support
$13.7–14.7 → current demand zone/consolidation
$11.63 → strong HTF support (low of previous reactions)
$7.84 → worst-case scenario (only in the event of a market breakdown)
Resistance
$18.85 → key HTF resistance (mid-range)
$22–24 → supply zone after the last impulse
$26–30 → ATH range/supply zone
📈 PRICE ACTION
Price is consolidating above the trendline → this is bullish behavior
No downward impulse – more likely accumulation
Candles with long downward wicks = supply absorption
➡️ This doesn't look like distribution, but rather a base for a move.
📊 INDICATORS
Stochastic RSI
Was in the oversold zone
Starting to curve upwards → potential buy signal (HTF)
CHOP
Falls to around 40
This indicates the end of consolidation and preparation for a trend
Perfect for an upside breakout in the coming weeks
🔮 SCENARIOS
🟢 BASELINE SCENARIO (most likely)
Sustaining $13.7–14.7
Breakout $18.85
Targets:
$22–24
Next $26–28
📌 Typical range → weekly breakout.
🔴 NEGATIVE SCENARIO
Weekly close below $11.63
Trendline negated
Decline to:
$9–$8
Strong long-term accumulation zone there

Yesterday vs today on $LINK viewYesterday vs today on CRYPTOCAP:LINK view 🔥
My charts are just too powerfull 🔮
14.5$ is programmed? 📈

#LINK/USDT in upward mood !#LINK
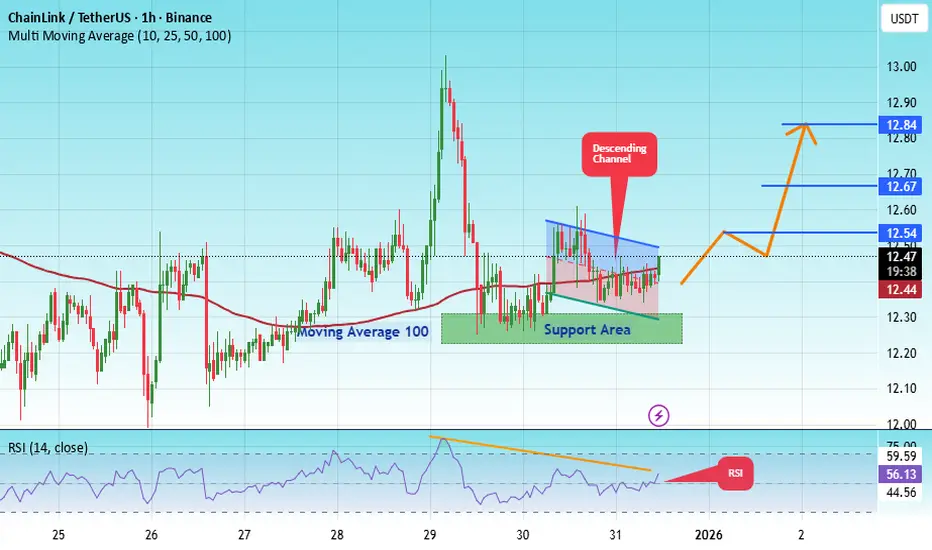
The price is moving in a descending channel on the 1-hour timeframe. It has reached the lower boundary and is heading towards breaking above it, with a retest of the upper boundary expected.
We have a downtrend on the RSI indicator, which has reached near the lower boundary, and an upward rebound is expected.
There is a key support zone in green at 12.26. The price has bounced from this zone multiple times and is expected to bounce again.
We have a trend towards stability above the 100-period moving average, as we are moving close to it, which supports the upward movement.
Entry price: 12.43
First target: 12.67
Second target: 12.54
Third target: 12.47
Stop loss: Below the support zone in green.
Don't forget a simple thing: capital management.
For inquiries, please leave a comment.
Thank you.

LINKUSDT | Short Term Bearish RejectionHello traders,
As you can see on the chart, LINK reached a local resistance and opened a very good R:R short trade targeting the below corrective uptrend.
Target $12.22
SL above $13.22
Good Luck

LINK/USDT — Descending Trendline Test: Break or Rejection?LINK/USDT on the 12H timeframe is still moving within a medium-term bearish structure, but price is currently testing a major descending trendline resistance that has capped upside movement since the previous highs. This places LINK in a critical decision zone.
---
📐 Pattern & Price Structure
Primary Pattern: Descending Trendline (Bearish Structure)
Price has been forming consistent lower highs and lower lows.
Price is now approaching a dynamic resistance (yellow trendline), which has:
Acted as strong resistance for months
Become a key validation level for either continuation or reversal
Additionally, price is consolidating in a tight accumulation range below the trendline, often a precursor to a strong breakout or breakdown.
---
🧱 Key Levels
Resistance:
13.55 – 14.70 → Minor resistance / supply zone
16.50 → Next structural resistance
18.50 – 19.90 → Extended bullish targets after a confirmed breakout
23.40 → Major resistance / previous distribution area
Support:
12.40 – 12.00 → Nearest support & demand zone
11.70 → Critical support (bullish invalidation)
11.10 → Extreme support / last defense
---
🟢 Bullish Scenario
Price breaks and closes decisively above the descending trendline on the 12H timeframe.
Ideal confirmation includes:
Strong candle body
Trendline retest holding as support
Potential upside targets:
14.70 → 16.50
Extension toward 18.50 – 19.90
A valid breakout would:
End the lower-high structure
Signal a medium-term trend reversal or bullish continuation
---
🔴 Bearish Scenario
Price fails to break the trendline and prints a clear rejection (long upper wick / bearish engulfing).
A breakdown below the current range opens downside potential toward:
12.00 retest
Extension to 11.70 – 11.10
As long as price remains below the descending trendline, the primary bias stays bearish / corrective.
---
🧠 Conclusion
LINK/USDT is trading at one of the most important technical zones in recent months.
Price reaction at the descending trendline will define the next major move:
Breakout → structure shift & bullish opportunity
Rejection → continuation of the downtrend
Patience and confirmation are key to avoiding false breakouts in this area.
---
#LINK #LINKUSDT #Chainlink #CryptoAnalysis #TechnicalAnalysis #Altcoins #Downtrend #Trendline #Breakout #CryptoTrading

#LINK/USDT – Triangle Pattern Breakout Loading?#LINK
The price is moving in a descending channel on the 1-hour timeframe. It has reached the lower boundary and is heading towards breaking above it, with a retest of the upper boundary expected.
We have a downtrend on the RSI indicator, which has reached near the lower boundary, and an upward rebound is expected.
There is a key support zone in green at 12.26. The price has bounced from this zone multiple times and is expected to bounce again.
We have a trend towards stability above the 100-period moving average, as we are moving close to it, which supports the upward movement.
Entry price: 12.43
First target: 12.67
Second target: 12.54
Third target: 12.47
Stop loss: Below the support zone in green.
Don't forget a simple thing: capital management.
For inquiries, please leave a comment.
Thank you.
#LINK/USDT – Triangle Pattern Breakout Loading?#LINK
The price is moving in a descending channel on the 1-hour timeframe. It has reached the lower boundary and is heading towards breaking above it, with a retest of the upper boundary expected.
We have a downtrend on the RSI indicator, which has reached near the lower boundary, and an upward rebound is expected.
There is a key support zone in green at 12.00. The price has bounced from this level multiple times and is expected to bounce again.
We have a trend towards consolidation above the 100-period moving average, as we are moving close to it, which supports the upward movement.
Entry price: 12.21
First target: 12.38
Second target: 12.62
Third target: 12.93
Don't forget a simple principle: money management.
Place your stop-loss below the support zone in green.
For any questions, please leave a comment.
Thank you.

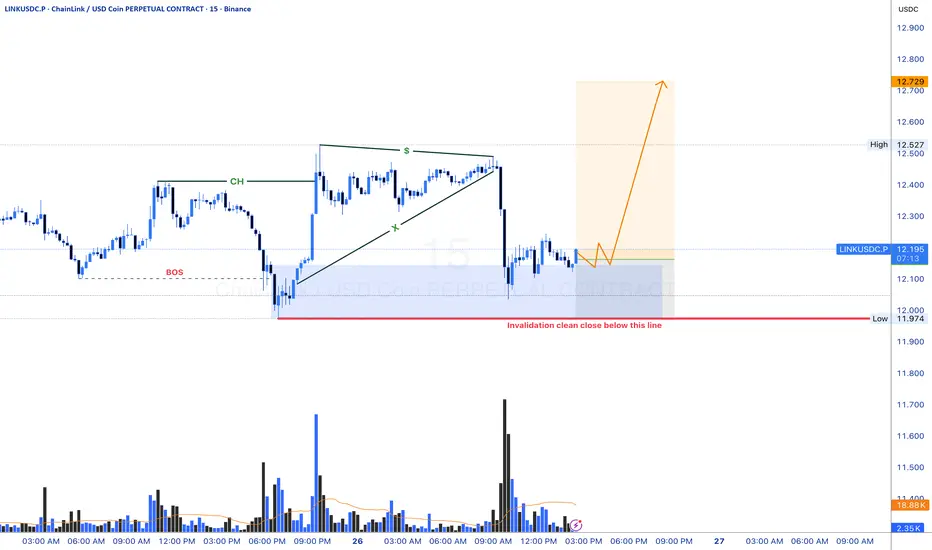
Link USD LONG IDEA. (BULLISH ORDER FLOW)Market Structure Context
Overall structure remains bullish (higher highs & higher lows).
Recent downside move is corrective, not impulsive.
No bearish break of structure on the higher timeframe → trend intact.
Key Zones (Institutional Interest)
Bullish Order Block at the origin of the last impulsive up-move.
⚠️ Disclaimer
This setup assumes normal market conditions.
Avoid trading during major news releases.
LINK: The Spring is About to BreakWe're sitting at the apex of a textbook converging wedge with just $0.07 of room left. 20 touches on ascending support ($12.19), 13 touches on descending resistance ($12.26), and price currently at $12.30. The coiled spring scenario is here—something gives within the next few bars.
1. THE TECHNICAL REALITY 📉
• Wedge compression: Width contracted from $14.62 to $0.07 over 467 bars—apex reached
• Macro structure: Price below EMA50 ($12.42) and EMA200 ($13.22)—bearish trend intact
• Current position: Testing middle Bollinger Band ($12.27), just above EMA20 ($12.29)
• ADX at 41.3: Strong trending environment confirmed
2. THE INDICATORS ⚖️
Bearish Signals:
• Bearish order block overhead at $12.31-$12.52 acting as supply
• Volume 63% below average ($622K vs $1.66M)—weak conviction on bounce
• Swing trend bearish despite trading in discount zone
• Upper wick 29.3% showing rejection at resistance
Bullish Signals:
• MACD bullish crossover (MACD -0.0311 above Signal -0.0451)
• Lower wick 59.8% showing strong support attempts
• Bullish order block below at $12.21-$12.63 providing demand
• RSI neutral at 54.4, MFI at 67.3 (elevated but not extreme)
The Conflict:
MACD suggests momentum shift, but volume tells the opposite story. Without conviction behind this bounce, the 59.8% lower wick represents indecision rather than strength. Structure trumps oscillators here.
3. THE TRADE SETUP 🎯
🔴 Scenario A: Wedge Breakdown (Higher Probability - 68%)
• Trigger: 4H close below $12.21 (bullish OB support break)
• Entry: Confirmation below $12.21 with volume
• Target: $11.73 (weak low liquidity sweep, 4.70% distance)
• Stop: 4H close above $12.52
Logic: Price rejects at $12.52 bearish OB (aligns with descending resistance), breaks 20-touch ascending support at $12.19, sweeps equal lows at $11.73 where unprotected buy-side liquidity sits. Converging wedges typically break in direction of prior trend—which is down.
🟢 Scenario B: Breakout Reversal
• Trigger: Decisive break above $12.52 with volume
• Entry: 4H close above $12.52 (breaks bearish OB + descending resistance)
• Target: $14.19 (premium zone threshold, triggers CHoCH bullish)
• Invalidation: Rejection back below $12.52
Logic: Reclaiming $14.19 invalidates entire bearish structure and signals bulls have control. Given positioning below EMA50/200 and bearish swing trend, assigning lower probability to this outcome.
MY VERDICT
Risk-reward favors the breakdown. The 20-touch ascending support at $12.19 breaking on volume would be a significant technical event that accelerates selling. Wait for confirmation rather than front-running—the wedge apex doesn't care about your bias, it breaks based on order flow.

TradeCityPro | LINK Compressing in Triangle, Breakout Ahead👋 Welcome to TradeCity Pro!
In this analysis, I want to review LINK, one of the RWA projects, which with a market cap of $8.78 billion is ranked 12th on CoinMarketCap.
⏳ 4-hour timeframe
On the 4-hour timeframe, LINK has a support zone near the $12 area, and together with a descending trendline, it has formed a descending triangle.
🎯 The trigger for breaking this triangle to the downside is the break of the $12 support zone, and 12.16 will be the first short trigger.
⚡️ However, if the triangle breaks to the upside, we can open a long position using the 12.80 trigger. In this case, the price can move toward 14.65.
📊 The volume on this coin has been decreasing for about a week and is gradually getting lower. If the breakout of either trigger is accompanied by increasing volume, the new trend can continue.
💥 Overall, since the price is currently between 12.16 and 14.65, the market does not have strong momentum, and for this reason, we can open both long and short positions.
📝 Final Thoughts
Stay calm, trade wisely, and let's capture the market's best opportunities!
This analysis reflects our opinions and is not financial advice.
Share your thoughts in the comments, and don’t forget to share this analysis with your friends! ❤️

LINK/USDT 4H Short-Term🔍 Market structure
• Local trend: it was upward (black trend line), it was broken down
• This means lost momentum for the bulls and a transition into correction/consolidation
• No higher low structure yet → the trend is not rebuilt
⸻
📉 Price vs levels (key zones)
🔴 Support:
• 12.20 – upcoming, very important
• 12.00 – psychological + technical
• 11.74 – last line of defense for the bulls
👉 Going below 12.20 increases the chances of 11.74
🟢 Resistances:
• 12.61 – currently strong resistance (flip S/R)
• 12.95 – local peak
• 13.21 – main target when the trend returns
⸻
📊 Momentum – Stochastic RSI
• Indicator close to the oversold zone
• Possible:
• short technical bounce
• BUT without trend confirmation (no HH/HL)
⚠️ Rebound ≠ trend change
⸻
📌 Scenarios (Highlights)
🟡 Scenario A – corrective reflection
• Weapon price 12.20
• Move up to 12.61
• Perfect place for supply response
👉 If 12.61 is rejected → further consolidation or decline
⸻
🔴 Scenario B – continued decline
• 4H close below 12.20
• Movement towards 12.00 → 11.74
• Only there is reasonable demand
⸻
🟢 Scenario C – bulls return (least likely now)
• Breakout and holding above 12.61
• Structure confirmation (HH + HL)
• Targets: 12.95 → 13.21

LINKUSDT – Weekly TimeframePrice is currently reacting at a major support zone that has been respected multiple times in the past.
This area previously acted as both support and resistance, making it a key decision point for the market.
Market structure
Higher timeframe structure is still correcting
Price is testing a previous support area
Momentum has slowed down, showing hesitation
Scenario 1 – Support holds (bullish):
If buyers step in and this support holds, we could see a relief move towards the next resistance zone, where price was previously rejected.
Scenario 2 – Support fails (bearish):
If this support breaks with a strong close, price may continue towards the lower support zone, which acted as a base earlier in the structure.
Conclusion:
Price is at a make-or-break area. Waiting for confirmation is safer than anticipating the move.
Do you expect a bounce from support or a breakdown continuation?
MrC

Be careful with LINK !!!The price on the 4h timeframe is within an ascending triangle, which can be promising. If the price breaks this pattern with bullish candles, it could easily rise by the distance of AB=CD.

$LINK - price update: BIST:LINK - price update:
Weekly demand zone is holding well.
Current price remains bearish (weekly & daily), but a triple bottom is possible at $ 11.80 ..
The reality:
Support is holding for now, but momentum remains pretty bearish inside the downtrend channel... 📉
Key levels:
🎯 $ 11.00
🎯 $ 10.20
🎯 $ 11.70
🎯 $ 13.30
🎯 $ 14.70

LINK/USDT - Bearish Flag Breakdown in Play (17.12.2025)📝 Description🔹 Setup WHITEBIT:LINKUSDT
LINK/USDT formed a classic Bearish Flag pattern after a strong impulsive drop (flagpole).
Price is now consolidating inside a rising channel, but remains below Ichimoku Cloud resistance and key EMAs — signaling weak bullish momentum.
As long as price stays below the flag resistance, bearish continuation remains the higher probability.
📌 Trading Plan
Primary Bias: 🔴 Bearish continuation
Watch for flag breakdown confirmation below minor support
Momentum confirmation = strong bearish candle close
🔴 1st Support: 12.12
🔴 2nd Support (Flag Target): 11.69
Measured Move: Flagpole height projection aligns with lower target
#LINKUSDT #Chainlink #CryptoTrading #BearishFlag #PriceAction #TechnicalAnalysis #CryptoMarket #TradingView #Altcoins #Kabhi_TA_Trading
⚠️ Disclaimer
This analysis is for educational purposes only.
Crypto markets are highly volatile — always use proper risk management and stop-loss.
❤️ Support the Work 👍 Like if this setup makes sense 💬 Comment your LINK view (bullish or bearish? )
🔁 Share to help more traders learn Your support keeps these breakdowns coming 🙌

LINKUSD | Revisiting an Old Down TrendHello traders,
I remember I traded LINKUSD back in 2017/2018 and I hated myself doing so. This coin is very slow and boring and I can't help it but feel that way.
Since Jun, 2023 LINK has been printing high lows on HTF and on a steady uptrend.
I think when ALT season starts, it might reach $22 price territory before it will go in another coma. Because that is what LINK always does, right?
Lets see how it plays out.
Good Luck!
Please drop a like and share your thoughts traders

linkusdt Double Bottom Structure BIST:LINK CRYPTOCAP:USDT
The BIST:LINK usdt pair on the 4-hour timeframe has established a bullish double bottom structure, signaling a potential trend reversal. This pattern is confirmed as the price action has broken the previous lower high (the neckline) and subsequently initiated a new move toward a higher high, indicating a shift in market structure from bearish to bullish
⚠️ Disclaimer:
This setup is shared for educational purposes only. It is not financial advice. Always do your own analysis and apply proper risk management before trading any setup

LINK - BULLISH SETUP ONGOING #LINK - My H4 setup is still ongoing 📈
The current price broke above a 2+ month downtrend channel structure.
It's currently consolidating nicely, likely confirming a breakout & retest before the next big move & trend shift 📈
Big support levels:
13.30− 13.00 - $12.60
Levels to watch for a SWING play:
🎯 $ 14.80
🎯 $ 15.40
🎯 $ 15.80
🎯 $ 16.50
🎯 $17.00
Not financial advice. Educational TA only. DYOR & trade at your own risk.

LINK It will grow soon...The wedge pattern will break in the direction it is breached, and the price will move in that direction. In my opinion, the price could be Bullish and may up to $17.

LINK Showing Strong Spot Structure_Double Bottom Point Toward 25If you want to accumulate a strong spot coin, LINK / USDT is one of the best options right now. It has formed a clean double bottom and is showing strong upward momentum. I expect a continuation move toward $25 soon. Manage risk wisely and always follow confirmations.
LINK/USDT — Historical Block: Bull Revival or Demand Breakdown?LINK is now approaching the most critical level of its multi-year market structure. The price has returned to the exact same demand block that triggered the major bullish expansion in previous cycles. This isn’t just support — it’s a historical liquidity zone where smart money repeatedly positioned itself before every significant rally.
And once again, the market is testing this area.
---
**✨ Market Narrative:
“Back to Where the Trend Began”**
From 2023 to 2025, every approach to the $10–$8.8 zone resulted in heavy absorption, long wicks, and strong reversals. This proves that this area acts as a primary liquidity pool for institutional accumulation.
This current revisit could become:
A bullish revival into a new multi-month uptrend,
or
A full breakdown into deeper distribution if the zone fails.
Simply put:
👉 This is LINK’s “make or break” level.
---
📈 Bullish Scenario — “Demand Awakening”
The bullish thesis activates if price:
Holds above $10–$8.8,
Forms a new higher low,
And closes strongly above $13–$14 on the 4D timeframe.
Signs of accumulation:
Long downside wicks inside the block
Increasing volume after compression
Higher timeframe candle reclaiming previous breakdown points
If confirmed, upside targets unfold naturally:
🎯 Target 1: $15–$17
🎯 Target 2: $21–$26
🎯 Target 3: Retest of the 2024 macro highs (expansion phase)
A reclaim of $17 would signal that the macro bullish trend is re-establishing itself.
---
📉 Bearish Scenario — “Demand Collapse”
The bearish thesis confirms ONLY when price:
Prints a decisive 4D close below $8.8,
Followed by continuation (not just a liquidity wick).
If the demand block breaks, the market shifts from accumulation to full distribution.
Downside targets become likely:
🎯 Target 1: $6–$5
🎯 Target 2: $4.7 (historical low & liquidity magnet)
🎯 Target 3: Full macro range retracement
This breakdown would represent a structural trend shift on the higher timeframe.
---
📊 Pattern & Market Structure Breakdown
Historical Demand Revisit: Price has returned to the core area that defined the previous rally.
Liquidity Grab Evidence: Deep wicks below the block — classic stop hunts before accumulation.
Macro Range Structure: LINK remains inside a multi-year range, hovering at its lower boundary.
Trend Context: Lower highs formed in 2025, and now price is searching for macro direction.
This isn’t ordinary price action —
this is where accumulation and distribution collide.
#LINK #Chainlink #Crypto #Altcoins #TechnicalAnalysis #DemandZone #PriceAction #MarketStructure #SmartMoney #CryptoAnalysis #SupportResistance
