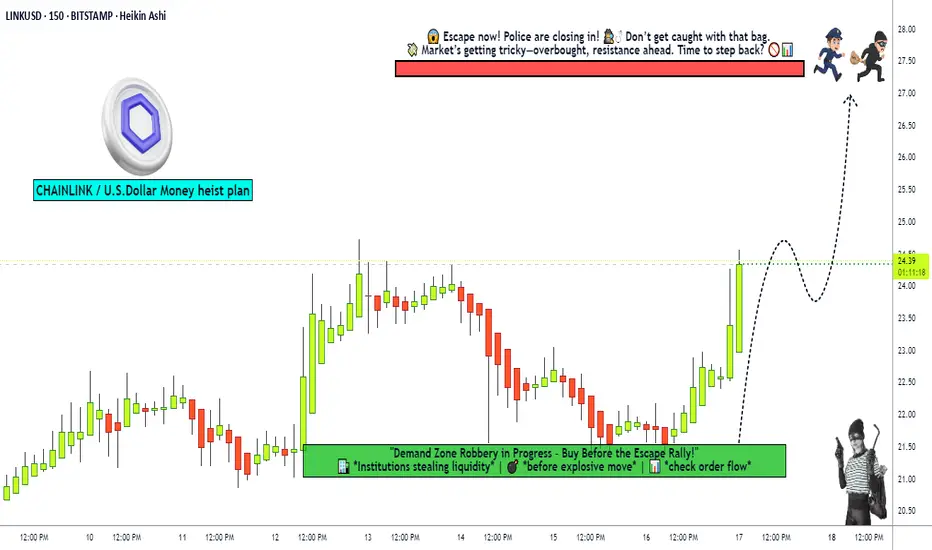
"Chainlink robbery in progress! Are you in or missing out?"🚨 LINK/USD "CHAINLINK vs U.S DOLLAR" HEIST PLAN 🚨
🔰 PLAN: BULLISH HEIST (STEAL & ESCAPE BEFORE COPS ARRIVE!)
💎 ENTRY: ANY PRICE (BUT THIEFS USE LAYERS!)
🤑 THIEF ENTRY STRAT (LAYERED LIMIT ORDERS):
"The vault is open! SWIPE THE LOOT IN LAYERS!"
📍 BUY LIMIT LAYERS:
👉 24.40 (First dip grab!)
👉 24.00 (Double dip!)
👉 23.50 (Triple steal!)
👉 23.00 (Last call before cops!)
(Add more layers if you’re a PRO THIEF!)
🛑 STOP LOSS (THIEF OG STYLE):
"If the cops breach @ 22.00, ABORT MISSION!"
(Adjust SL based on your risk—don’t be a reckless robber!)
🎯 TARGET: ESCAPE BEFORE POLICE BARRICADE @ 28.00!
"Take profits @ 27.50 & vanish like a ghost! 👻💰"
💣 THIEF TRADER RULES (MUST FOLLOW!):
✔ SCALPERS: Only rob LONG side! Use trailing SL to lock stolen cash!
✔ SWING THIEFS: Stack layers & escape before the blue ATR trap!
✔ NEWS ALERT! 🚨 Avoid fresh heists during high-impact news—cops (whales) set traps!
🔥 WHY THIS HEIST WILL WORK?
📈 Bullish momentum!
🔗 Chainlink whales loading!
💵 Weak dollar = MORE LOOT!
💖 SUPPORT THE HEIST SQUAD!
"Hit 👍 LIKE & 🔄 SHARE to boost our next robbery!"
"More boosts = More stolen money for YOU! 🤑🚀"
⚠️ WARNING (THIEF DISCLAIMER):
❌ Not financial advice!
❌ Risk management = Don’t get caught slippin’!
❌ Market changes fast—adapt or get REKT!
🚀 SEE YOU IN THE NEXT HEIST! STAY STEALTHY, THIEFS! 🐱👤💎
🔥 THIEF TRADER STYLE = MAX GAINS, MIN REGRETS! 🔥
(Boost this idea & let’s rob the market together!) 💰🎯🚨
LINKUSDT
TradeCityPro | LIKNUSDT Best Opportunity for Trading👋 Welcome to TradeCityPro Channel!
Let’s go to the LINK chart, the popular cryptocurrency, and analyze it together.
🌐 Overview of Bitcoin
Before starting the analysis, I want to remind you again that we moved the Bitcoin analysis section from the analysis section to a separate analysis at your request, so that we can discuss the status of Bitcoin in more detail every day and analyze its charts and dominances together.
This is the general analysis of Bitcoin dominance, which we promised you in the analysis to analyze separately and analyze it for you in longer time frames.
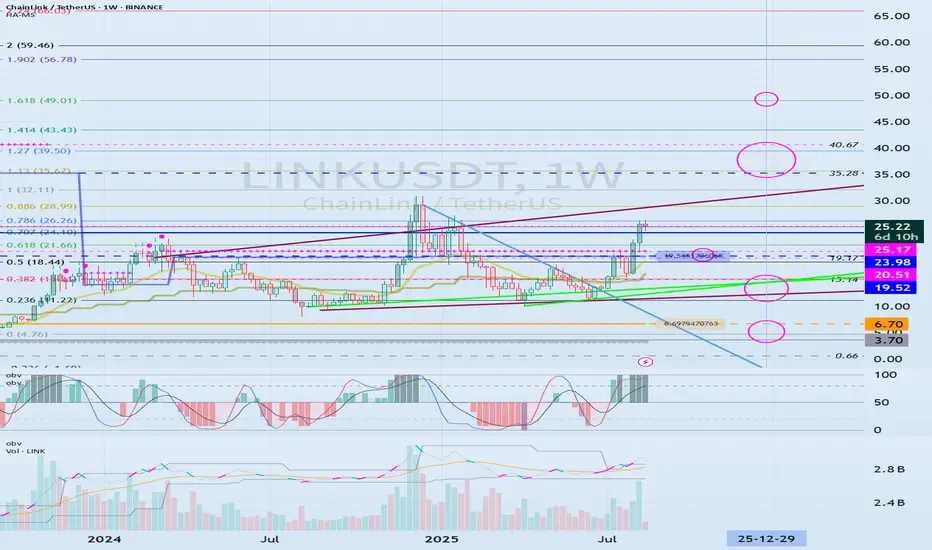
📊 Weekly Timeframe
On the weekly timeframe, LINK has been one of the cryptocurrencies that remained in a range for 500 days. After breaking out, we have seen the beginning of an uptrend.
This is exactly what I mean by avoiding capital lock-up. We waited weeks for the 8.06 trigger to break, allowing us to buy with momentum confirmation rather than buying inside the range and waiting in a high-risk market.
You might say, "Why not buy inside the range to avoid missing the 8.06 breakout?" My answer is that hundreds of coins are still stuck in similar ranges without showing any bullish moves, and even now, they could trap your capital for a long time, causing frustration!
📊 Daily Timeframe
In the daily timeframe, after being inside the range box between 11.58 and 15.50 and ranging in this area, we finally broke out and formed a curve movement.
Currently, after our uptrend, we have reached the 26.88 resistance, which previously rejected us from this area and is our most important resistance.
If we form a higher low in this area, we can make our spot buy after breaking 26.88.
📈 4H Timeframe
In the 4-hour timeframe, we experienced a very good uptrend and then entered a range phase, which increases the probability of a correction.
For a short position, after breaking 23.05, we can open a position with low risk and take profit quickly because the trend is bullish and we are not supposed to hold short positions for too long.
For a long position, we need to break the continuation trendline, and after activating the 23.89 trigger, we can open our long position. Our main trigger will be 26.5.
📝 Final Thoughts
Stay calm, trade wisely, and let's capture the market's best opportunities!
This analysis reflects our opinions and is not financial advice.
Share your thoughts in the comments, and don’t forget to share this analysis with your friends! ❤️

Big Weekly Crypto Review: Altcoins Trend Structures This week’s review covers major altcoins and selected mid/low-cap tokens (see separate update for BTC and ETH). Focus is on macro structures, key support/resistance zones, and expected mid-term scenarios through Autumn.
BINANCE:BNBUSDT
Pulled back to the local support highlighted earlier this week. I would prefer to see a more prolonged consolidation before the next higher low forms and one more break-out into the macro resistance zone at 930–1000. However, a sustained break above Thursday’s high would increase the odds of more immediate upside momentum, potentially bypassing the longer consolidation phase.
Chart:
BINANCE:XRPUSDT
Is following the corrective structure outlined in the previous weekly report. A double bottom formation is possible at current levels, but as long as price remains below the 50DMA, the odds favor further downside into the macro support zone at 2.52–2.35 before a higher low can be established.
Chart:
CRYPTO:HYPEHUSD
Is following the price structure outlined in the previous weekly report, holding the mid-term support zone and reversing to the upside. A quick shake-out below recent August lows is possible in the coming weeks, but the next break above 50 has high odds of follow-through toward the next resistance around 65+. The price action remains among the strongest in the crypto space, suggesting potential outperformance versus most other coins during the next upside phase.
Chart:
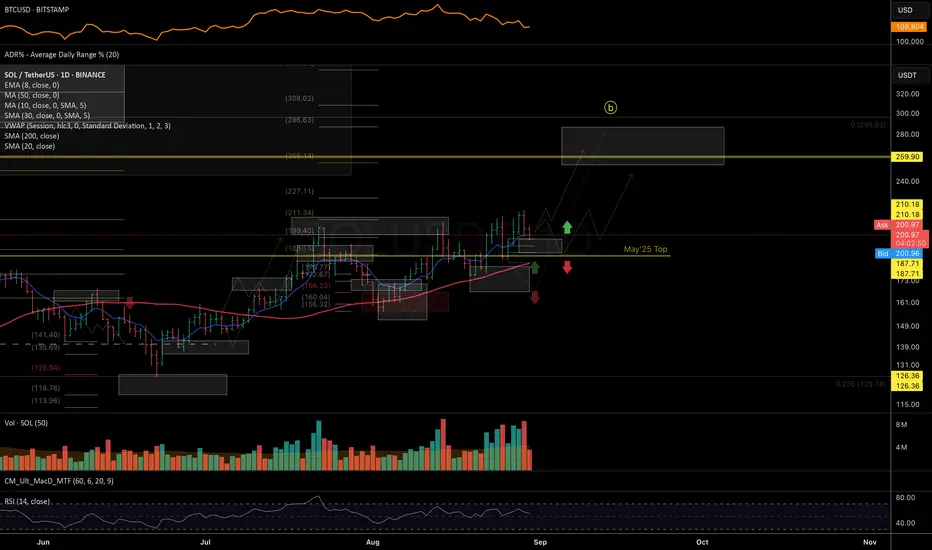
BINANCE:SOLUSDT
Is following the trend structure outlined in the previous crypto market review: holding mid-term support and continuing its upside momentum. The near-term trend looks bullish, supported by a high-level constructive consolidation. Given seasonality, a more prolonged autumn consolidation with a series of higher lows would be constructive for a more sustainable breakout later toward year-end.
Chart:
BINANCE:LINKUSDT
Is following the trend structure suggested in previous August updates. I expect a more prolonged Autumn consolidation and base building within the higher levels of macro support: 19.5–17.5, before the next upside leg. The macro trend structure remains bullish and has a wide margin of safety, indicating potential outperformance during the next upward momentum.
Chart:
BINANCE:LTCUSDT
Price respected the mid-term resistance levels outlined in the previous August update. Mid-term support for the impulsive structure is 114–105. If these levels fail to hold, or if price cannot break above the Aug 24 highs, a more prolonged consolidation within the 108–95 macro support zone is likely.
Chart:
BINANCE:SUIUSDT
Price respected the mid-term resistance levels outlined in the previous August update and is now consolidating orderly within the mid-term support zone. Expecting a higher low to form within 3.10–2.75, continuing base formation before a potential larger-degree breakout.
Chart:
BYBIT:ONDOUSDT
Is showing potential for a double bottom formation in the coming sessions. However, if price fails to break above 1–1.05 on any recovery attempt, the risk of a deeper correction toward macro support at 0.80–0.75 increases.
Chart:
CRYPTO:TONUSD price continues to respect the mid-term support zone at 3.25–3.00, in line with the structure outlined in the Aug 9 weekly review. As long as 3.00 holds (with potential max downside extension toward 2.82), the bias remains for a higher-low formation and eventual resumption of the broader uptrend.
Chart:
BINANCE:RENDERUSDT
Price is consolidating within the mid-term support zone at 3.50–3.25. The macro structure remains bullish, but there is still a risk of further downside toward the 3–2.75 macro support if price fails to reclaim the 50DMA on any recovery attempt.
Chart:
BINANCE:UNIUSDT is following the larger-degree structure outlined in the previous August update. Key mid-term support for the impulsive structure lies at 9.70–8.80. If price fails to close above the August 22 highs or breaks below 8.80, the odds increase for a more complex corrective structure and extended consolidation.
Chart:
BINANCE:DOGEUSDT
0.22–0.20 marks a key mid-term support zone where price could form a higher low before continuing upside momentum. Failure to reclaim August highs on any breakout attempt may lead to continued selling pressure toward macro support below early August lows.
Chart:
BINANCE:TAOUSDT is evolving within a complex corrective structure. Key macro support levels are at 287–270–250. Any short-term bounce that fails to close above the 50DMA may face renewed selling pressure toward the macro support zone.
Chart:
BINANCE:FETUSDT
Was unable to close above the local resistance zone highlighted in the previous August update and continues showing downside potential. Price may attempt to form a double bottom with early August lows, followed by a bounce toward the declining 50DMA. Macro support remains at 0.50–0.45. The weekly structure stays bullish for the long term, as long as price holds above April lows.
Daily chart:
Weekly chart:
BINANCE:VIRTUALUSDT.P
Is trading within the macro support zone 1.30–0.95–0.80, following the larger-degree corrective structure first suggested in July. I am looking for price to start forming a higher low within this range.
Chart:
BYBIT:POPCATUSDT is forming a complex corrective structure. Key macro support for a potential larger-degree higher low sits at 0.23–0.19.
Chart:
$1000FLOKIUSDT key support zone to maintain macro bullish structure stands at 0.097–0.085–0.075. Holding above these levels keeps odds in favor of long-term upside continuation.
Chart:
BINANCE:SUPERUSDT is approaching the mid-term support area at 0.53–0.50. This zone may provide conditions for a higher-low formation and potential trend continuation.
Chart:
$1000000MOGUSDT.P corrective structure remains complex, but as long as price holds within the mid-term support zone at 0.89–0.77–0.70, the odds favor a potential upside reversal with a new base formation developing.
Chart:
CRYPTO:BRETT2USD is consolidating within the mid-term support zone highlighted since the Aug 9 weekly review. Watching for a higher-low formation inside 0.044–0.038 support before potential trend continuation.
Chart:
BINANCE:BONKUSDT price is in a mid-term support zone where a higher low formation could develop, setting up at least a bounce. A break below 0.0000183 would open the door to the next support levels at 0.0000165–0.0000145.
Chart:
Chainlink Rising "Mid-Air" · Long-Term Support FoundThis is perfect. Here we can see Chainlink growing in "mid-air." Can that be said?
"Mid-air" because the rise keeps on happening and the retrace finds support where there is no support; that is, LINKUSDT continues to grow straight up. This is as good as it gets.
We had only five days red and LINK turns green again. This doesn't change anything on the smaller or bigger picture, market dynamics remain the same.
If this day is red, the next day red and another 3, 5, 9 days red; it doesn't matter, we are in a bullish wave.
If this day is green, the next day green, then red, then green and so on; it doesn't matter, you are looking at market noise.
The noise will continue and at times it will even intensify. Volatility will also increase as prices continue to increase. Trading complexity will be up. Risk will be higher but, right now, it is still early because Chainlink can easily hit $100+. Knowing this, I buy and hold.
Namaste.

LINK CORRECTION COIMING?? We don't want to hear it, but could it be possible?
COINBASE:LINKUSD
LINK our favourite has made an automatic rally up to the 78.6 fib and is now correcting.
Do you think it is over and we go deeper or we are climbing higher?
Write your comment!

LINKUSDT SETUP.LINKUSDT | 1H Bullish Setup
📌 Key Structure Update
Price broke previous highs with a strong impulse and is now retracing. A clean OB + FVG = POI is marked around 24.5 – 24.7.
📍 POI Level
Demand zone + FVG overlap (confluence zone).
📝 Trade Plan
Wait for confirmation at POI before entry. Potential bullish reaction expected if price respects the demand zone.
🎯 Targets
TP1: 26.0
TP2: 27.0
❌ Invalidation
Setup invalid if price closes below 24.3.

LINKI think LINKUSDT move up
in touch order block in 1H
yellow Line is risk free position (SL = Entry)

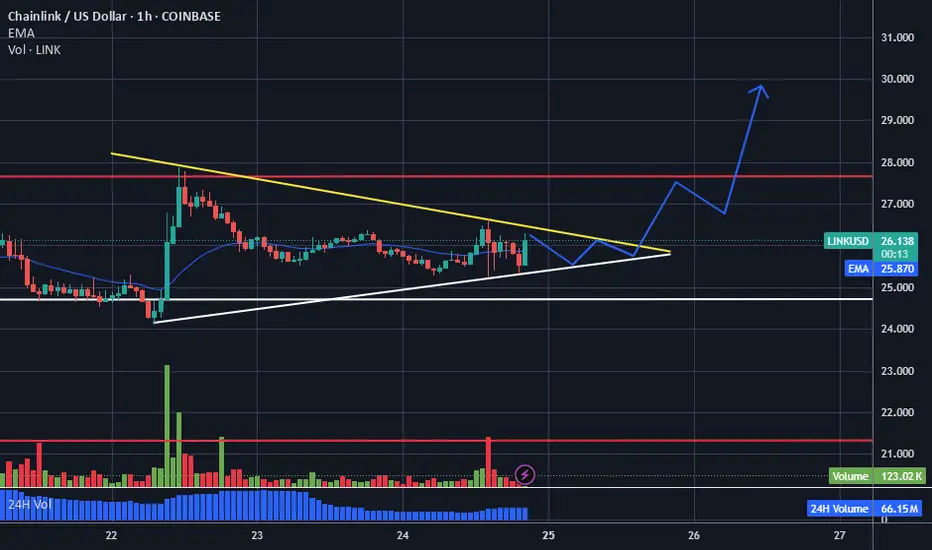
Chainlink (LINK) Ascending Triangle — Eyeing $30 BreakoutPattern: Clear ascending triangle forming (higher lows + flat resistance near $26.8–27.0).
EMA: Price ($26.13) is slightly above EMA ($25.87) → short-term bullish tilt.
Volume: Increasing on up-moves, decreasing on pullbacks → bullish accumulation signal.
🔹 Key Levels
Support:
$25.5–25.8 (EMA + ascending trendline)
$24.7–25.0 (secondary support)
$23.7 (major breakdown level)
Resistance:
$26.8–27.0 (triangle breakout trigger)
$28.5 (next supply zone)
$30.0–30.5 (psychological + measured breakout target)
🔹 Breakout Targets (from triangle height)
Base of triangle ~ $23.7 → top $26.8 (~$3 range).
Breakout projection = $30.0 zone (matches your arrow).
🔹 Trade Outlook
Bullish Scenario:
Breakout above $27.0 with volume → run to $28.5 → $30.0.
Bearish Scenario:
Breakdown below $25.5 → retest $24.7, worst-case $23.7.
Targets: $28.5 → $30.0.
📌 Summary: LINK is consolidating inside an ascending triangle. Break above $27 = bullish continuation toward $30+. Breakdown below $25.5 flips structure bearish
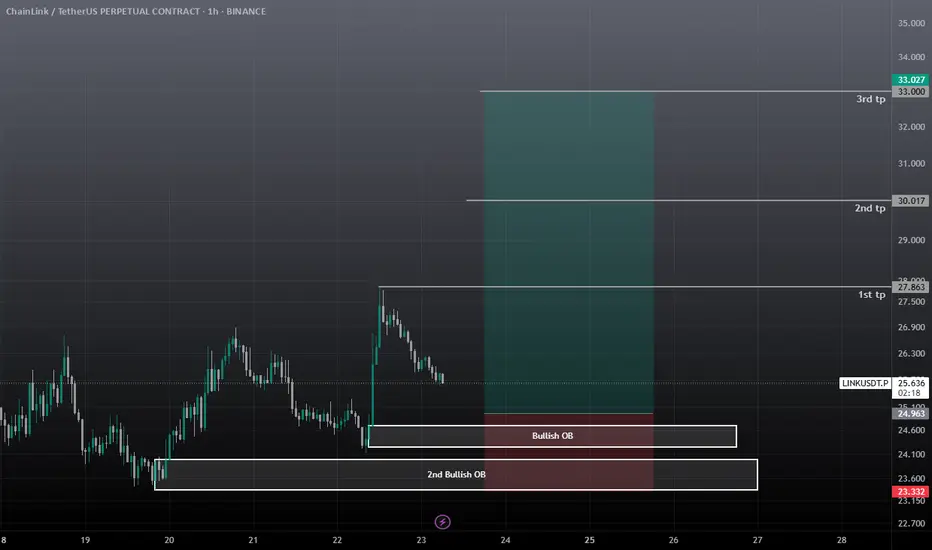
Link Long / Buy SetupLink has two Bullish OB, if first failed, 2nd OB will push the price, ETH bulish, link is also Bullish then. Use low risk as the pump was from an event so it can be a fakeout.
LINK Update Mega pump caught in 4KLink we caught the bottom it was beautiful entry pumped 17 percent and I believe it has more fuel to reach 28 30 zone
Enjoy

Chainlink LINK price analysis#LINK – Possible Breakout Setup?
🔹 Recent news indicates rising institutional interest in #Chainlink
🔹 The rally on OKX:LINKUSDT has been nearly correction-free
🔹 Next short-term targets: $28–31
🔹 Ideal pullback zone: $17–18, above the long-term blue trendline (since 2019)
🔹 If the trend holds, we could see a new impulse wave — possibly with ATH retest
🔍 What's your #LINKUSD target by end of 2025? 👇
______________
◆ Follow us ❤️ for daily crypto insights & updates!
🚀 Don’t miss out on important market moves
🧠 DYOR | This is not financial advice, just thinking out loud.

LinkUSDT: Elliot Waves AnalysisHello friends, I have opened such a trade on the LINK currency. The strategy is based on Elliott waves and price action. I hope you can be profitable.

Check if it finds support around 23.98-25.17 and rises
Hello, fellow traders!
Follow us to get the latest information quickly.
Have a great day.
-------------------------------------
Chainlink is one of the coins connected to many ecosystems.
Therefore, I believe it's worth holding for the medium to long term.
(LINKUSDT 1M chart)
The key is whether the price can find support around 23.98-25.17 and rise along the uptrend line.
If not, caution is advised as it may touch the lower uptrend line.
-
(1W chart)
If the price finds support around 23.98-25.17 and rises,
1st: 35.28-40.67
2nd: Fibonacci ratio 1.618 (49.01)
It is expected to rise to the 1st and 2nd levels above.
After that, a bearish turn appears likely.
Based on the current price, if it falls below the 19.52-20.51 range, it is recommended to stop trading and wait and see how the situation develops.
-
(1D chart)
Ultimately, the key is whether the price can break above the uptrend line (1).
If not, you should check for support within the circled area marked on the chart.
However, if the price falls below the M-Signal indicator on the 1M chart, you should stop trading and wait and see how things turn out.
-
Thank you for reading.
I wish you successful trading.
--------------------------------------------------
- This is an explanation of the big picture.
(3-year bull market, 1-year bear market pattern)
I will explain in more detail when the bear market begins.
------------------------------------------------------
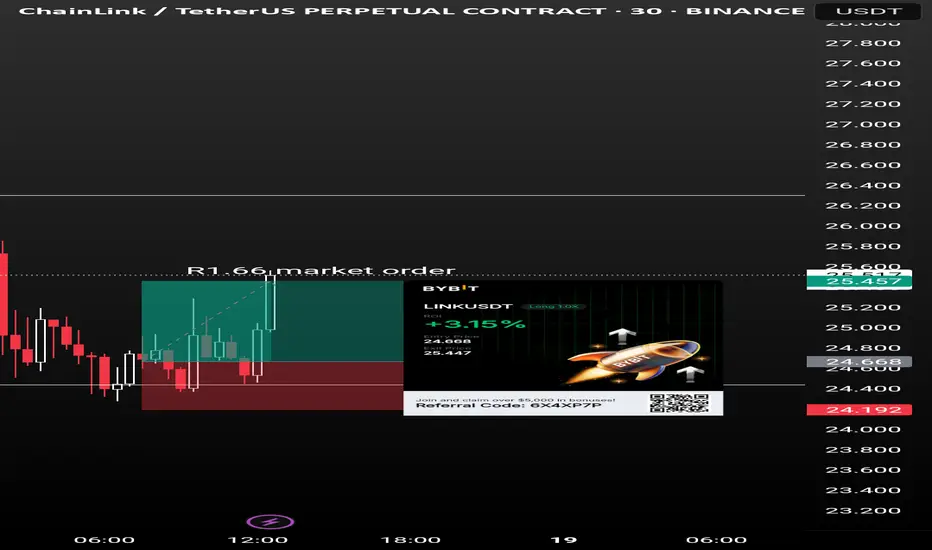
Trade long on link doneA Good long trade on link took today on 30min TF.
Wish you all Good, leverage x1. Keep the process step by step
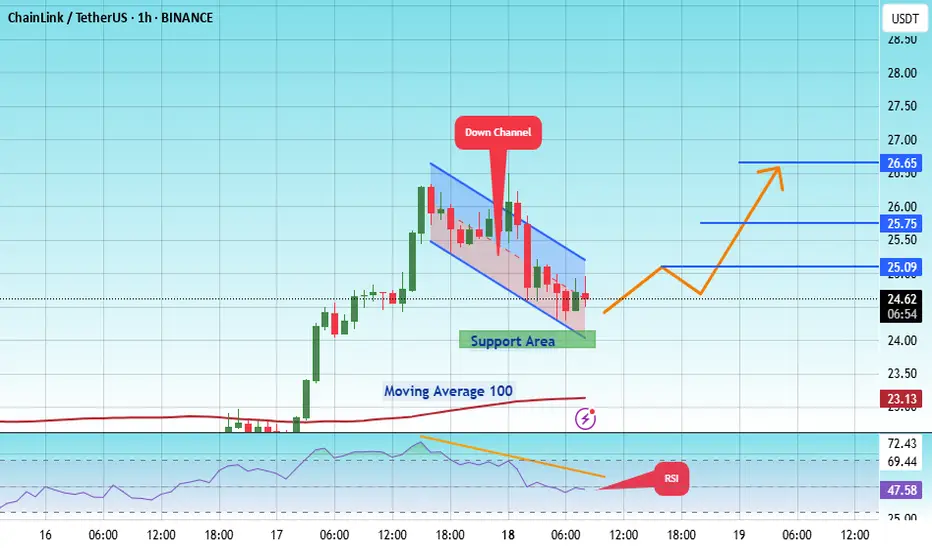
#LINK/USDT in upward mood !#LINK
The price is moving within an ascending channel on the 1-hour frame, adhering well to it, and is on track to break it strongly upwards and retest it.
We have support from the lower boundary of the ascending channel, at 24.20.
We have a downtrend on the RSI indicator that is about to break and retest, supporting the upside.
There is a major support area in green at 24.00, which represents a strong basis for the upside.
Don't forget a simple thing: ease and capital.
When you reach the first target, save some money and then change your stop-loss order to an entry order.
For inquiries, please leave a comment.
We have a trend to hold above the 100 Moving Average.
Entry price: 24.60.
First target: 25.09.
Second target: 25.75.
Third target: 26.65.
Don't forget a simple thing: ease and capital.
When you reach your first target, save some money and then change your stop-loss order to an entry order.
For inquiries, please leave a comment.
Thank you.
Link shows clear bearish divergenceIf we look closely at LINK/USDT right now, the charts are flashing a clear bearish divergence. This setup usually acts as a warning sign, and the price action is already hinting at a potential correction. The first important zone to watch is around 19.5 – it lines up with the golden pocket as well as a previous resistance that can now flip into support.
But if Bitcoin dominance continues climbing, there’s a risk of LINK moving deeper into correction territory. In that case, the 17.5 zone becomes a realistic target, and a move into that range would confirm a stronger bearish dump.
So the play here is simple: keep an eye on 19.5 as the first defense zone. If it holds, bulls might get some relief. If it breaks, prepare for the possibility of LINK sliding down toward 17.5.

Chainlink 2025 All-Time High Price Projection At $130 & $82Chainlink market bottom after the last bull market happened June 2023. The orthodox end of the bear market was June 2022. Chainlink is a very strong project.
After reaching bottom in mid-2022, the pair immediately started trading sideways. LINKUSDT went sideways for an entire year—bottom consolidation/accumulation/opportunity buy zone—and finally entered a new uptrend. This uptrend is what we are witnessing up close.
After the rise in late 2023 ending March 2024 LINKUSDT settled for a wide consolidation channel with a bullish bent, with higher highs and higher lows. LINKUSDT has been moving in this channel for more than a year and we are seeing the unfoldment of a new higher high.
The way the chart is drawn, the candles and the patterns, the way the market is behaving and the rising volume are all pointing towards a major advance. It is already happening, but everything is about to speed up. It is already good, great, but it is about to get better.
The first target and immediate resistance is $35. This would produce the highest prices since November 2021 and open up the last stage of the 2025 bull market for this pair. Remember, each pair is different.
Then $82 is a strong target and very likely to be a troublesome resistance point. There can be a stop here... If my thinking is right, LINKUSDT can hit $130 in this cycle. The final target is between $82 and $130 but these might be conservative numbers.
Thank you for reading.
Namaste.

Chainlink is up 160% since early April —What now?This is the perfect chart. This chart is perfect proof of where the market is at as a whole and where it is headed. Chainlink is moving higher and now trades at the highest price since January 2025.
Go a bit higher, a target of $32, and we have the highest prices since November 2021, the previous bull market. And LINKUSDT will achieve this target easily and move higher. I also predict that we are going to see a new all-time high in 2025. And this is a high probability prediction, there is just too much data in favor of.
It all starts with a low in April and then we have a higher low in June. The market goes sideways for at least four months (120 days) without any significant growth before turning extremely bullish. By the time we reach this week, the market has been green for an entire month, since 16-June.
Ethereum did something similar. A low in April followed by a small recovery then sideways consolidation. When the sideways consolidation ended the advance is still on going today and ETHUSDT almost hit a new all-time high.
Chainlink is moving forward and becoming stronger. Cardano is moving forward and many more projects are doing great. Slowly but surely, the altcoins market is starting to heat up and everything will change so fast, for the better.
One day we are buying, waiting, sharing, learning, holding and trading, the next day the entire market is up 300-500%. Then it keeps on growing.
Chainlink (LINKUSDT) is up more than 160% since its 7-April 2025 low. There is room for plenty of additional growth.
We will look at this pair again soon with 2025 all-time high projections. Make sure to follow to receive a notification when the post goes live.
Namaste.

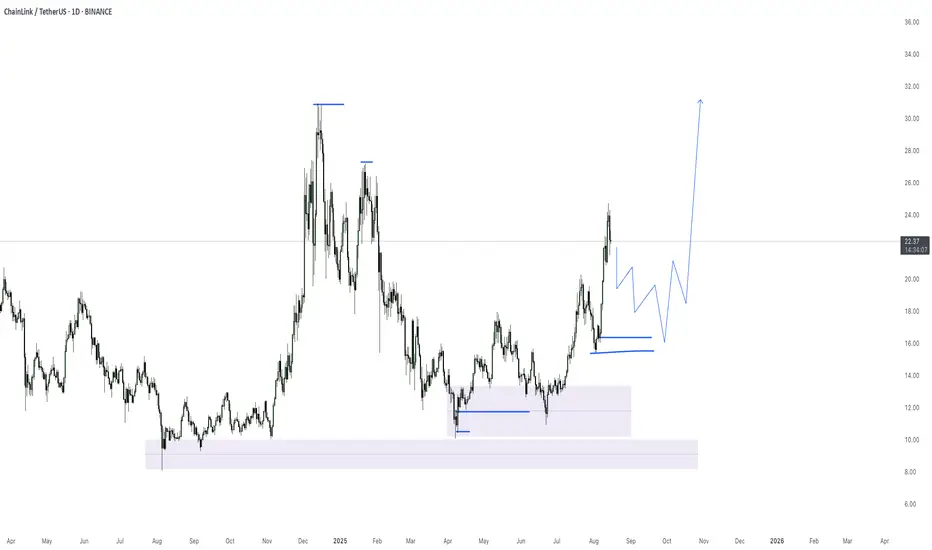
LINK/USDT - LONGdaily chart analysis highlights strong bullish momentum, marked by a sharp upward move. The price is expected to perform a pullback to the 18$–15$ support zone before resuming its bullish trend, potentially reaching 27$–32$.
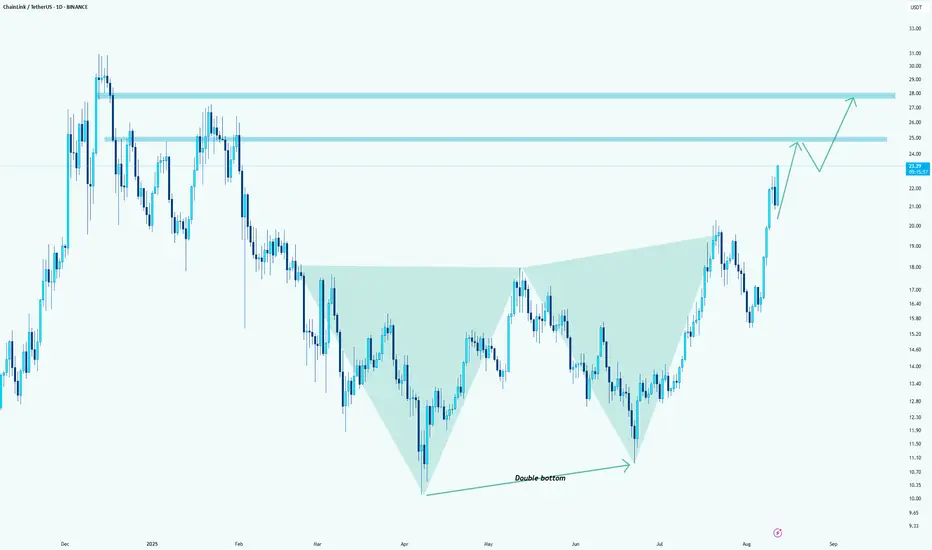
Link: it formed a double bottomHello guys.
Link formed a double bottom and a divergence at the same time!
You can count on longs here.
Target1: 25
Target2: 28
The pressure from buyers is high! I hope you can get it on the pullbacks
LINKUSDTThis chart is in a bullish trend, but it broke a new high at $22.7. If BINANCE:LINKUSDT can keep the price above $20, we can expect it to reach a higher high.
Please control risk management.⚠️

$LINK is up 54% from recent lows, now at $24. CRYPTOCAP:LINK is up 54% from recent lows, now at $24. Price is consolidating after the strong rally — holding above $20 could sustain momentum toward $28–$32, while losing this zone risks a deeper correction back to $15.

Why I'm long on LINK 3 reason backed by chart LINK/USDT – Monthly Chart Analysis
Chainlink is currently testing a multi-year resistance line that has capped price since the 2021 peak. The asset has been forming a large ascending triangle pattern with higher lows since mid-2022, showing accumulation pressure building up.
Resistance Zone: $27–$35
Current Price: $23.94
Support Trendline: Holding strong since 2019 lows
Structure: Bullish compression into resistance
Key Takeaways:
A monthly close above the resistance line could trigger a breakout towards $35–$50 in the medium term.
Until the breakout is confirmed, expect possible rejections and retests of the $20–$21 zone.
The risk/reward is attractive for spot investors looking for a breakout play.
📌 Watch the monthly close carefully — confirmation above resistance could mark the start of a strong LINK rally.
