LINKUSDT 1WLINK ~ 1W Analysis
#LINK If you still have a Conviction on this Coin, Maybe this support you can consider to start buying again, a minimum target of 20%+.
Linkusdtlong

LINKUSDT Breakout Alert: Bullish Momentum Above 50 EMA!BINANCE:LINKUSDT Breakout Alert: Bullish Momentum Above 50 EMA!
After multiple tests of the support zone, BINANCE:LINKUSDT has finally bounced off and broken out of its descending trendline, signaling a potential strong uptrend. With the price now holding above the 50 EMA, bullish momentum is evident, and the market may be gearing up for a significant move higher. Traders should consider entering on a pullback while targeting key resistance levels. As always, proper risk management is crucial—set your stop-loss below the support zone and align your position size with your risk tolerance to stay on the safe side.
BINANCE:LINKUSDT Currently trading at $22.5
Buy level: Above $22
Stop loss: Below $19
Target : $40
Max Leverage 3x
Always keep Stop loss
Follow Our Tradingview Account for More Technical Analysis Updates, | Like, Share and Comment Your thoughts

LINKUSDT 1WLINK Update ~ 1W
#LINK So far it continues to maintain its bullish structure. This is wave 2 if we use the Eliot Wave pattern. Buy in stages with a target of at least 20%+ from here.

LINK/USDT Breakout SetupLINK/USDT Breakout Setup 🚀
LINK/USDT is gearing up near a major resistance level, with potential for a breakout 📈. If the price breaks above this level and confirms it with a retest as new support, we could see a strong bullish movement follow 💥.
🔍 Key aspects to monitor:
1. Breakout confirmation: A solid close above the resistance level.
2. Retest: Look for the breakout level to hold as support.
3. Volume surge: Increased volume during the breakout can strengthen the momentum.
⚠️ Keep a close eye on this pair, but remember, this is not financial advice. Always DYOR (Do Your Own Research) before making any moves. 📊

$LINKUSDT: Breakout Alert!BINANCE:LINKUSDT is currently forming a symmetrical triangle pattern on the chart, indicating a potential breakout. After an extended consolidation phase, the price action suggests that LINK may be on the verge of a significant move. Traders should monitor key resistance and support levels as the price approaches the apex of the triangle. A confirmed breakout above resistance could signal a strong upward trend, particularly if it is accompanied by increased volume.
This setup presents an exciting opportunity for traders, as a decisive break could ignite a substantial upward movement. With the potential for a powerful rally after a lengthy period of consolidation, now is the time to stay alert for breakout signals. Always conduct your own research and consider your risk tolerance before making trading decisions.
BINANCE:LINKUSDT Currently trading at $12
Buy level: Above $12
Stop loss: Below $10.5
TP1: $13
TP2: $15
TP3: $19
TP4: $22
Max Leverage 3x
Follow Our Tradingview Account for More Technical Analysis Updates, | Like, Share and Comment Your thoughts

#LINK/USDT#LINK
The price is moving within a descending channel pattern on the 4-hour frame and is expected to break upwards after it has adhered to it to a large extent
We have a downtrend on the RSI indicator that is expected to break upwards and we have a trend to stabilize above it
We have a major support level in green at a price of 8
We have a trend to stabilize above the moving average 100, which supports the rise
Entry price 9.40
First target 11.32
Second target 12.63
Third target 13.86

#LINK/USDT#LINK
The price is moving in a descending channel on the 1-hour frame
And it is sticking to it well
We have a bounce from the lower limit of the descending channel and we are now touching this support at a price of 10.60
We have a downtrend on the RSI indicator that is about to be broken, which supports the rise
We have a trend to stabilize above the moving average 100
Entry price 10.80
First target 11.11
Second target 11.36
Third target 11.70

LINKUSDTLINK ~ 1W ✅
#LINK Make purchases gradually in this pattern. it is only a matter of time until this pattern is broken out and the bulls will return quickly.

CHAINLINK long setup / Bulls or Bears, Tell me in CommentsBINANCE:LINKUSDT
COINBASE:LINKUSD
Hello Traders
💥Long position on LINK
SL1 ---> Low-risk status: 3x-4x Leverage
SL2 ---> Mid-risk status: 5x-8x Leverage
👾The setup is active but expect the uncertain phase as well.
➡️Entry Area:
Yellow zone
⚡️TP:
10.62
10.72
10.85
10.94
11.08
11.20
🔴SL:
9.99
🧐The Alternate scenario:
If the price stabilizes below the trigger zone, the setup will be cancelled.

LINKUSDTLINK ~ 5D ✅
#LINK Last time Smart money accumulated in this support block area. if this happens again,. Maybe this area will be an excellent purchase. Please note, this area has a wide purchasing range. If you are interested,. Gradual purchasing is possible in this area.

Long position on LINKUSDT 49Min/ Volume PredictionBINANCE:LINKUSDT
COINBASE:LINKUSD
High-risk status: 4x-5x Leverage
Mid-risk status: 3xLeverage
Low-risk status: 2x Leverage
⚡️TP:
13.72
13.85
13.95
14.09
14.23
14.34(In Optimistic Scenario)
➡️SL:
13.28
13.07
12.85
The Alternate scenario:
If the price stabilize below the trigger zone, the setup will be cancelled.

LINKUSDT undervaluedpotential long to see how the market reacts to the current key level. If bullish reaction traget at 20.729 / 21.922

#LINK/USDT#LINK
The price is moving in a bearish channel on the 12-hour frame and adheres to it well, and the price rebounded from the lower border of the channel at the green color at the price of $13.00.
We have a tendency to stabilize above the Moving Average 100
We have a downtrend on the RSI indicator that was broken to support the rise
Entry price is 14.30
The first target is 16.50
The second goal is 17.70
Third goal 19.56

Link bullish or bearish - A technical analysis
Support Levels:
$12.09: A key support level currently holding the price.
$11.06: Another potential support level below $12.09.
$8.40: Further support if the price breaks below $11.06.
$5.13: Major historical support level.
Resistance Levels:
$27.36: Immediate resistance.
$37.05: Next significant resistance level.
Trendlines:
-The chart shows an upward trending channel with support and resistance lines indicating a long-term bullish trend.
-The price recently bounced off the lower support trendline and is moving towards the resistance trendline.
The most recent monthly candlestick is bullish, indicating positive price movement and suggesting a potential continuation of the upward trend.
The Stochastic RSI at the bottom of the chart is in the overbought territory, which could suggest a potential short-term pullback or consolidation.
Bullish Scenario:
If the price maintains above the $12.09 support level, it is likely to retest the $27.36 resistance level.
A break above $27.36 could lead to further upside towards $37.05.
Bearish Scenario:
If the price fails to hold the $12.09 support level, it may find the next support around $11.06.
A break below $11.06 could lead to a drop towards $8.40 or even $5.13.

LINKUSDT Elliott Waves AnalysisHello friends.
Please support my work by clicking the LIKE button👍(If you liked). Also i will appreciate for ur activity. Thank you!
Everything on the chart.
The impulse have been completed, im waiting for correction and continuation of growth.
Entry zone: 13 - 10$
Good luck everyone!
Follow me on TRADINGView, if you don't want to miss my next analysis or signals.
It's not financial advice.
DYOR!

ChainLink long idea I believe that one of these two scenarios will come true and I still think it is bullish for the crypto market.

#LINK/USDT#LINK
The price is moving in a perfectly symmetrical descending triangle
It was broken higher and the moving average 100 broke
Current price 14.90
The first goal is 15.95
Second goal 16.28
Third goal 17.53

February Crab Repeat, Channel drop into TriangleLink went to the all time high 36$ range in Feb and channel A dropped into triangle A.
it broke the triangle into another channel upward to break a new previous high which was the 44$ range and we're seeing a similar triangle drop where we may range sideways for months after dropping from channel B into triangle B.
BEARISH

#LINK/USDT#LINK
It is moving in a bearish channel on a 4-hour frame, and the price has committed to the green area at the level of 19.50.
We have a higher stability moving average of 100
We have bullish momentum on the RSI
Entry price is 19.95
First goal 20.28
The second goal is 20.61
The third goal is 20.97

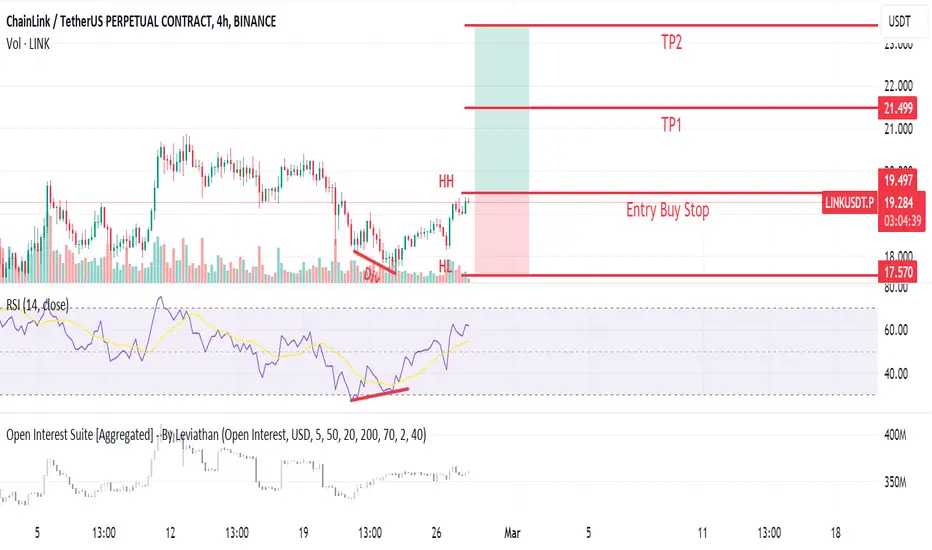
LINKUSDT Bullish (4H Div, DOW HHs)Instrument has started its bullish price direction based on making DOW HHs and HLs supported by 4H Divergence. A buy stop is placed at previous HH. What do you think, will it break the HH and go up?
Trade Plan
SL: Previous LL
Entry: Buy stop @ break of HH
TP1 and TP2 based on 1:1 and 1:2
Note: Break even after TP1 is hit.
LINK/USDT Looking BullishTRADE ALERT!LINK
Ticker: LINK/USDT
Entry: 17.5$ - 18.45$
Take Profit: 21-23$
Stop Loss: 16$
Risk to reward: 1:2
Technical Thesis: Link breaked the support of one day also took the retest and start pumping, we can expect a good Movement toward a the Next support

ChainLink The Great AccumulationHello dear traders! If you like my graphics, please use Like button 💙💛.
There exists a potential scenario wherein COINBASE:LINKUSD could undergo a substantial x4.6 surge between late 2023 and early 2024.
In the chart provided, you can observe the accumulation pattern, with the price action mirroring it remarkably accurately.
What strengthens this possibility is the ongoing robust accumulation phase that has been in progress since April 2022, spanning nearly 500 days.

LINKUSDT Elliott Waves AnalysisHello friends.
Please support my work by clicking the LIKE button👍(If you liked). Also i will appreciate for ur activity. Thank you!
Everything on the chart.
Waiting for last upward movement before correction.
Entry: Market and lower
Target zone: 18.5 - 21$
after first target reached move ur stop to breakeven
Stop: (depending of ur risk). ALWAYS follow ur RM .
risk is justified
Good luck everyone!
Follow me on TRADINGView, if you don't want to miss my next analysis or signals.
It's not financial advice.
Dont Forget, always make your own research before to trade my ideas!
Open to any questions and suggestions
