#LINK/USDT in upward mood !#LINK
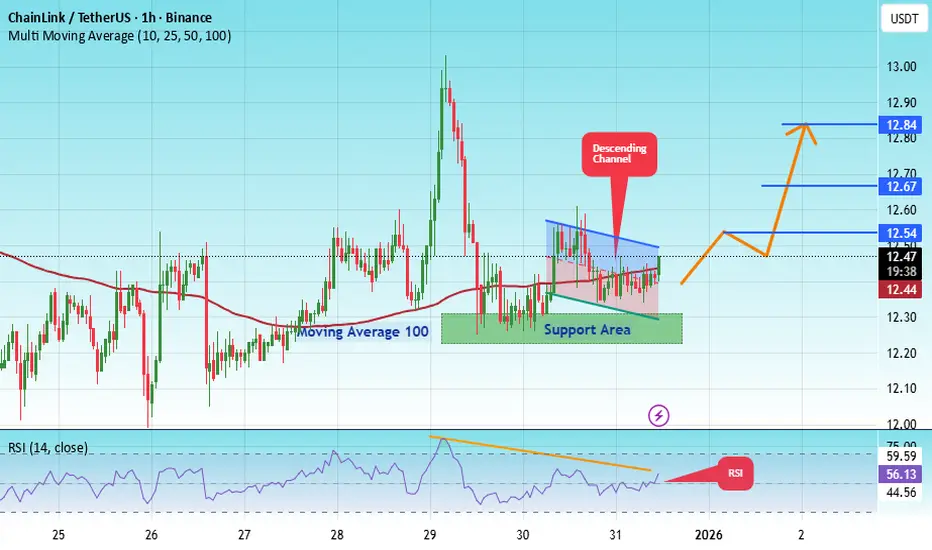
The price is moving in a descending channel on the 1-hour timeframe. It has reached the lower boundary and is heading towards breaking above it, with a retest of the upper boundary expected.
We have a downtrend on the RSI indicator, which has reached near the lower boundary, and an upward rebound is expected.
There is a key support zone in green at 12.26. The price has bounced from this zone multiple times and is expected to bounce again.
We have a trend towards stability above the 100-period moving average, as we are moving close to it, which supports the upward movement.
Entry price: 12.43
First target: 12.67
Second target: 12.54
Third target: 12.47
Stop loss: Below the support zone in green.
Don't forget a simple thing: capital management.
For inquiries, please leave a comment.
Thank you.
LINKUSDTPERP

LINK/USDT — Descending Trendline Test: Break or Rejection?LINK/USDT on the 12H timeframe is still moving within a medium-term bearish structure, but price is currently testing a major descending trendline resistance that has capped upside movement since the previous highs. This places LINK in a critical decision zone.
---
📐 Pattern & Price Structure
Primary Pattern: Descending Trendline (Bearish Structure)
Price has been forming consistent lower highs and lower lows.
Price is now approaching a dynamic resistance (yellow trendline), which has:
Acted as strong resistance for months
Become a key validation level for either continuation or reversal
Additionally, price is consolidating in a tight accumulation range below the trendline, often a precursor to a strong breakout or breakdown.
---
🧱 Key Levels
Resistance:
13.55 – 14.70 → Minor resistance / supply zone
16.50 → Next structural resistance
18.50 – 19.90 → Extended bullish targets after a confirmed breakout
23.40 → Major resistance / previous distribution area
Support:
12.40 – 12.00 → Nearest support & demand zone
11.70 → Critical support (bullish invalidation)
11.10 → Extreme support / last defense
---
🟢 Bullish Scenario
Price breaks and closes decisively above the descending trendline on the 12H timeframe.
Ideal confirmation includes:
Strong candle body
Trendline retest holding as support
Potential upside targets:
14.70 → 16.50
Extension toward 18.50 – 19.90
A valid breakout would:
End the lower-high structure
Signal a medium-term trend reversal or bullish continuation
---
🔴 Bearish Scenario
Price fails to break the trendline and prints a clear rejection (long upper wick / bearish engulfing).
A breakdown below the current range opens downside potential toward:
12.00 retest
Extension to 11.70 – 11.10
As long as price remains below the descending trendline, the primary bias stays bearish / corrective.
---
🧠 Conclusion
LINK/USDT is trading at one of the most important technical zones in recent months.
Price reaction at the descending trendline will define the next major move:
Breakout → structure shift & bullish opportunity
Rejection → continuation of the downtrend
Patience and confirmation are key to avoiding false breakouts in this area.
---
#LINK #LINKUSDT #Chainlink #CryptoAnalysis #TechnicalAnalysis #Altcoins #Downtrend #Trendline #Breakout #CryptoTrading

#LINK/USDT – Triangle Pattern Breakout Loading?#LINK
The price is moving in a descending channel on the 1-hour timeframe. It has reached the lower boundary and is heading towards breaking above it, with a retest of the upper boundary expected.
We have a downtrend on the RSI indicator, which has reached near the lower boundary, and an upward rebound is expected.
There is a key support zone in green at 12.26. The price has bounced from this zone multiple times and is expected to bounce again.
We have a trend towards stability above the 100-period moving average, as we are moving close to it, which supports the upward movement.
Entry price: 12.43
First target: 12.67
Second target: 12.54
Third target: 12.47
Stop loss: Below the support zone in green.
Don't forget a simple thing: capital management.
For inquiries, please leave a comment.
Thank you.
#LINK/USDT – Triangle Pattern Breakout Loading?#LINK
The price is moving in a descending channel on the 1-hour timeframe. It has reached the lower boundary and is heading towards breaking above it, with a retest of the upper boundary expected.
We have a downtrend on the RSI indicator, which has reached near the lower boundary, and an upward rebound is expected.
There is a key support zone in green at 12.00. The price has bounced from this level multiple times and is expected to bounce again.
We have a trend towards consolidation above the 100-period moving average, as we are moving close to it, which supports the upward movement.
Entry price: 12.21
First target: 12.38
Second target: 12.62
Third target: 12.93
Don't forget a simple principle: money management.
Place your stop-loss below the support zone in green.
For any questions, please leave a comment.
Thank you.

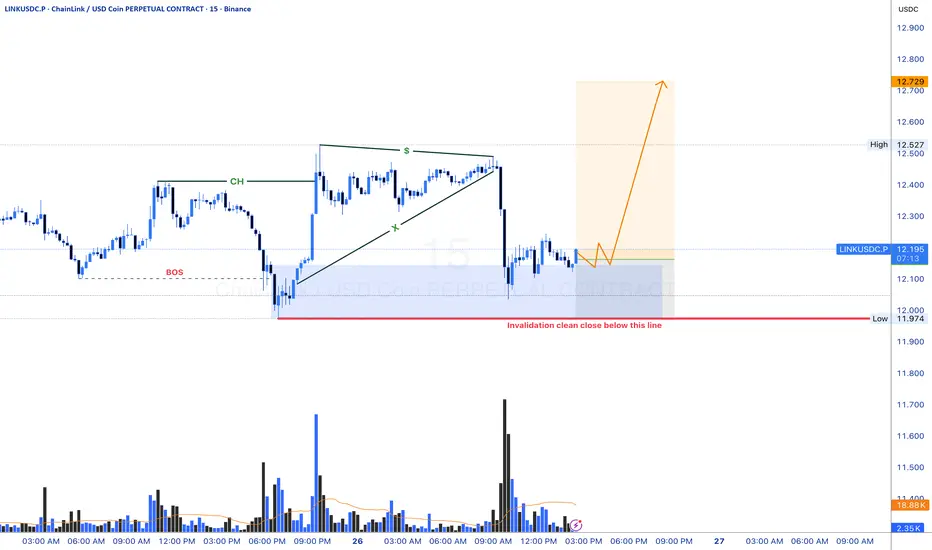
Link USD LONG IDEA. (BULLISH ORDER FLOW)Market Structure Context
Overall structure remains bullish (higher highs & higher lows).
Recent downside move is corrective, not impulsive.
No bearish break of structure on the higher timeframe → trend intact.
Key Zones (Institutional Interest)
Bullish Order Block at the origin of the last impulsive up-move.
⚠️ Disclaimer
This setup assumes normal market conditions.
Avoid trading during major news releases.
LINK/USDT — Historical Block: Bull Revival or Demand Breakdown?LINK is now approaching the most critical level of its multi-year market structure. The price has returned to the exact same demand block that triggered the major bullish expansion in previous cycles. This isn’t just support — it’s a historical liquidity zone where smart money repeatedly positioned itself before every significant rally.
And once again, the market is testing this area.
---
**✨ Market Narrative:
“Back to Where the Trend Began”**
From 2023 to 2025, every approach to the $10–$8.8 zone resulted in heavy absorption, long wicks, and strong reversals. This proves that this area acts as a primary liquidity pool for institutional accumulation.
This current revisit could become:
A bullish revival into a new multi-month uptrend,
or
A full breakdown into deeper distribution if the zone fails.
Simply put:
👉 This is LINK’s “make or break” level.
---
📈 Bullish Scenario — “Demand Awakening”
The bullish thesis activates if price:
Holds above $10–$8.8,
Forms a new higher low,
And closes strongly above $13–$14 on the 4D timeframe.
Signs of accumulation:
Long downside wicks inside the block
Increasing volume after compression
Higher timeframe candle reclaiming previous breakdown points
If confirmed, upside targets unfold naturally:
🎯 Target 1: $15–$17
🎯 Target 2: $21–$26
🎯 Target 3: Retest of the 2024 macro highs (expansion phase)
A reclaim of $17 would signal that the macro bullish trend is re-establishing itself.
---
📉 Bearish Scenario — “Demand Collapse”
The bearish thesis confirms ONLY when price:
Prints a decisive 4D close below $8.8,
Followed by continuation (not just a liquidity wick).
If the demand block breaks, the market shifts from accumulation to full distribution.
Downside targets become likely:
🎯 Target 1: $6–$5
🎯 Target 2: $4.7 (historical low & liquidity magnet)
🎯 Target 3: Full macro range retracement
This breakdown would represent a structural trend shift on the higher timeframe.
---
📊 Pattern & Market Structure Breakdown
Historical Demand Revisit: Price has returned to the core area that defined the previous rally.
Liquidity Grab Evidence: Deep wicks below the block — classic stop hunts before accumulation.
Macro Range Structure: LINK remains inside a multi-year range, hovering at its lower boundary.
Trend Context: Lower highs formed in 2025, and now price is searching for macro direction.
This isn’t ordinary price action —
this is where accumulation and distribution collide.
#LINK #Chainlink #Crypto #Altcoins #TechnicalAnalysis #DemandZone #PriceAction #MarketStructure #SmartMoney #CryptoAnalysis #SupportResistance

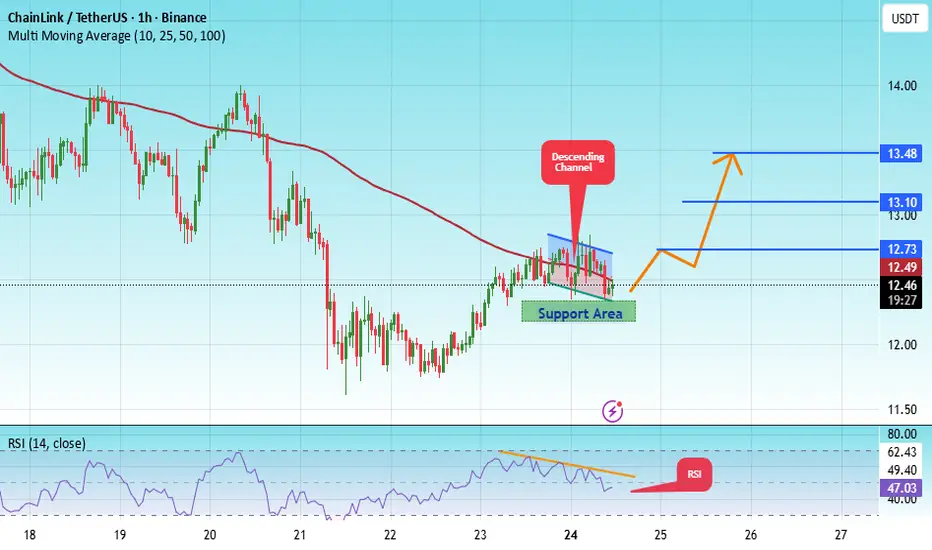
#LINK/USDT LONG SIGNAL#LINK
The price is moving within an ascending channel on the 1-hour timeframe and is adhering to it well. It is poised to break out strongly and retest the channel.
We have a downtrend line on the RSI indicator that is about to break and retest, which supports the upward move.
There is a key support zone in green at 12.27, representing a strong support point.
We have a trend to stabilize above the 100-period moving average.
Entry price: 12.48
First target: 12.73
Second target: 13.10
Third target: 13.48
Don't forget a simple money management rule:
Place your stop-loss order below the green support zone.
Once the first target is reached, save some money and then change your stop-loss order to an entry order.
For any questions, please leave a comment.
Thank you.
LINKUSDT UPDATE#LINK
UPDATE
LINK Technical Setup
Pattern: Falling Wedge Pattern
Current Price: $13.15
Target Price: $19.50
Target % Gain: 50.40%
Technical Analysis: LINK is breaking out of a falling wedge pattern on the 4H chart, signaling a potential bullish reversal. Price has pushed above the descending resistance trendline and is holding above the breakout zone, indicating improving bullish structure. If momentum continues, price is likely to expand toward the upper resistance and measured move target zone shown on the chart.
Time Frame: 4H
Risk Management Tip: Always use proper risk management.

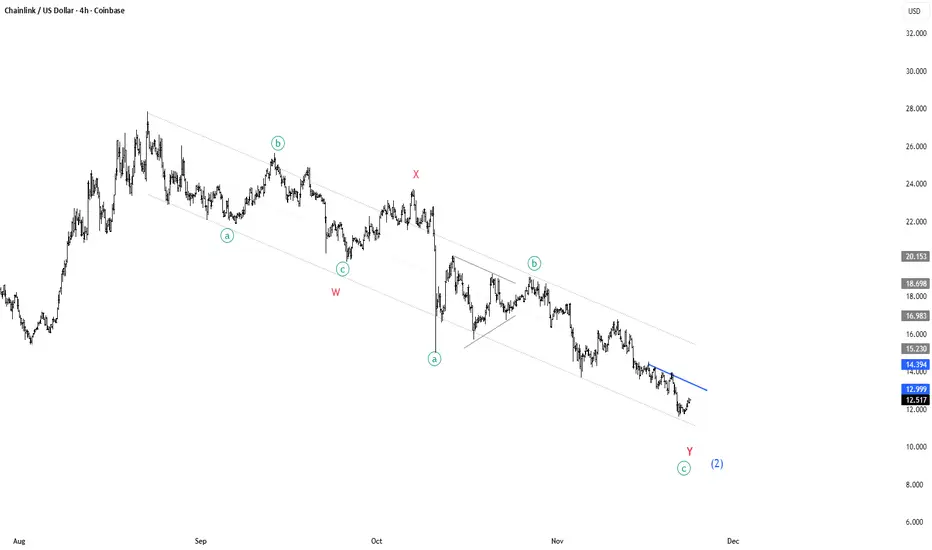
CHAINLINK is turning around for a massive rally!🔗 CRYPTOCAP:LINK – Elliott Wave Breakdown (4H Chart)
Current structure still fits a W–X–Y corrective decline, but we’re now approaching a critical trigger level. A clean punch through the blue trendline = buy signal. 🎯
🟦 What the structure shows:
🔻 Wave W complete:
• Clear a–b–c zigzag
• Strong reaction into the X connector
🔷 Wave X at the mid-channel zone:
• Acts as the next major upside target if we break out
• Provides structural symmetry between W and Y
🔻 Wave Y in progress:
• Again forming a–b–c
• C-leg looks terminal, aligning with channel support
📉 Price is compressing under the descending blue trendline (b-wave resistance of Y)
🚀 Trade trigger:
A decisive breakout above the blue trendline = start of the next impulsive leg
Upside target: the region around the prior X high
That zone is both:
• 🔹 Structural retracement
• 🔹 Upper channel magnet
• 🔹 Ideal first take-profit region
📌 Summary:
Break the blue line ➜ bullish confirmation ➜ target = X-level.
Still corrective, but the next impulse is close. ⚡
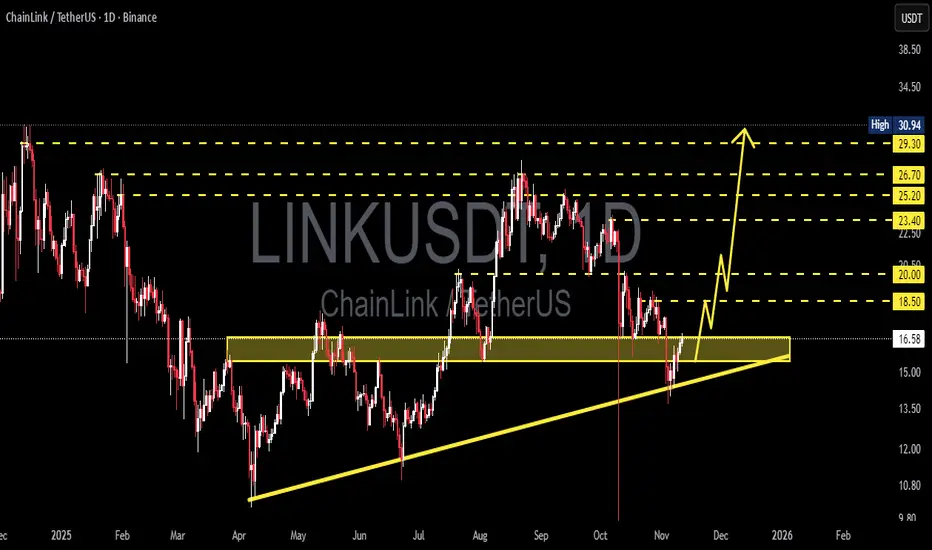
LINK/USDT - Ready to Explode? Uptrend Structure Tested?Chainlink (LINK) is now positioned at the most crucial zone in its mid-term technical structure — the 16.6–15.5 USDT area is not just a simple support, but a confluence zone between horizontal support and an ascending trendline that has been holding since April 2025.
Currently, price is reacting positively within this area, indicating that market participants are still defending the broader uptrend structure. However, if this zone fails to hold, the structure may collapse — paving the way for a deeper correction.
---
Pattern & Market Structure
Ascending Trendline Support: formed since April and still holding selling pressure.
Yellow Demand Zone (16.6–15.5): a strong accumulation area, tested multiple times this year.
Range-to-Trend Formation: price attempting to break out from sideways range into trend continuation.
Layered Resistances Above: 18.5 → 20.0 → 23.4 → 25.2 → 26.7 → 29.3 acting as step-by-step upside targets if the trend continues.
---
Bullish Scenario — Potential Reversal from a Strong Base
If price manages to hold and bounce strongly from the 16.6–15.5 zone, it opens the door for forming a new higher low that could become the foundation for the next rally.
Bullish confirmation: Daily close above 16.6 with reversal candle (hammer/bullish engulfing) and increasing volume.
Step-by-step upside targets:
18.5 → first psychological resistance.
20.0 → prior supply reaction area.
23.4–25.2 → potential breakout continuation zone.
Extended target: If momentum sustains, the ultimate target sits around 29.3–30.9, the yearly high.
Strategy:
Gradual buy within support zone with disciplined stop loss below 15.0. Additional confirmation entry if daily close >18.5.
---
Bearish Scenario — Breakdown as the Start of a Deeper Correction
However, if price breaks below 15.5 with strong volume, the bullish structure will be invalidated.
Bearish confirmation: Daily close below both trendline and 15.5.
Downside targets:
13.0 → previous horizontal support from May.
10.8 → macro base from 2024.
Additional signals: RSI breakdown, or failed retest below 16.6 after the break.
Strategy:
Wait for a failed retest around 15.5–16.0 for a short/hedge setup targeting 13.0.
---
Technical Perspective
The market is currently in a strategic neutral zone — between a potential major reversal and a confirmed breakdown. This is a decision phase, where volume and daily candle patterns will dictate the next dominant direction.
From a mid-term perspective, holding the ascending trendline means maintaining the macro uptrend structure, which could drive LINK back toward the 25–30 USD region. Conversely, losing this support may shift the structure into a new downtrend toward the long-term accumulation area below 13 USD.
---
Final Note
The 16.6–15.5 zone is more than just a number — it’s the psychological boundary between conviction and doubt.
Short-term traders look for a bounce, while long-term investors await directional confirmation.
Watch the daily close, volume, and trendline reaction closely. This is where the market decides: rebound toward 20+ or fall back to 13.
---
#Chainlink #LINKUSDT #CryptoAnalysis #TechnicalAnalysis #SupportAndResistance #Trendline #CryptoSetup #PriceAction #CryptoMarket
LINK/USDT — The Final Defense Zone: Will the Bulls Rise Again?Chainlink (LINK) has entered its final defense zone around $15.00–$17.00, a historically strong structural support area.
This zone isn’t just random — it’s the same level where the market once launched a major rally that drove LINK to $27.87.
The most recent daily candle shows a deep wick below the zone that was quickly reclaimed — a classic sign of a liquidity grab or false breakdown, hinting that the market might be accumulating before its next significant move.
Overall, the structure suggests a major retest phase: after a powerful breakout earlier this year, LINK is now retesting the origin of that move.
The key question — is this the start of re-accumulation before another leg higher, or the beginning of a market structure breakdown toward deeper lows?
---
Structure & Pattern
Yellow Zone ($15–$17) → Historical demand zone, validated by multiple previous bounces (marked by yellow arrows).
Macro Pattern → Retest of breakout zone, with the latest candle showing sweep and reclaim behavior.
Momentum → Sharp correction, but with a long lower wick and potential momentum divergence — a sign that the correction phase might be near its end.
Technical Context → Holding above this zone may form a double bottom or higher-low structure, indicating bullish strength recovery.
---
Bullish Scenario (Reversal Setup)
A daily close above $17 would confirm that buyers are defending the structure.
A sustained move above $19.99 could unlock upside targets at $21.69 → $23.30 → $25.12 → $26.82.
A strong rejection from the lower zone, combined with rising volume, may signal institutional accumulation in progress.
Market Narrative:
Bulls might be quietly preparing for Phase 2 of the rally after a classic shakeout.
As long as the $15–$17 zone holds, LINK retains the potential to resume its mid-term uptrend.
---
Bearish Scenario (Continuation Breakdown)
A daily close below $15 would signal structural failure and a loss of bullish control.
This could trigger a continuation drop toward $13.5 → $12.0 → $9.8.
A failed retest from below the zone ($16–$17 rejection) would further confirm bearish momentum.
Market Narrative:
If this support collapses, LINK may enter a distribution phase, where selling pressure strengthens and momentum fully flips bearish.
---
Conclusion & Perspective
The $15–$17 zone is the line between survival and surrender for LINK’s bullish structure.
As long as this level holds, the potential for a bullish reversal remains alive.
But once broken, the mid-term trend could shift decisively to bearish.
We are standing at a Decision Zone — the kind of area where institutions quietly position themselves and patient traders wait for confirmation before taking action.
---
LINK returns to its final defense zone at $15–$17 — the area separating a major reversal from a new downtrend.
The long wick signals a liquidity sweep, but confirmation awaits the next daily close.
Bulls are being tested — will they hold the line, or give in to market pressure?
Levels to watch:
Support: $15–$17
Resistance: $19.99 → $21.69 → $23.30 → $25.12 → $26.82 → $27.87
---
#LINK #Chainlink #LINKUSDT #CryptoAnalysis #TechnicalAnalysi #SupportAndResistance #CryptoMarket #PriceAction #Altcoins #MarketStructure #CryptoSetup #LINKPrice

LINKUSDTLast week BINANCE:LINKUSDT , after touching 24.80 dollars 🚀, the price failed to hold and moved into correction. The overall structure still shows a range between key support and resistance, with compression signaling the potential start of the next trend. Currently, momentum leans slightly bearish 📉, but the market has not yet confirmed a clear direction.
Key Levels:
Initial support: 23.18 dollars 🛡️
Next supports: 22.50 dollars – 21.60 dollars
Nearby resistance: 24.40 dollars
Higher resistances: 25.20 dollars – 26.50 to 27.50 dollars 🎯

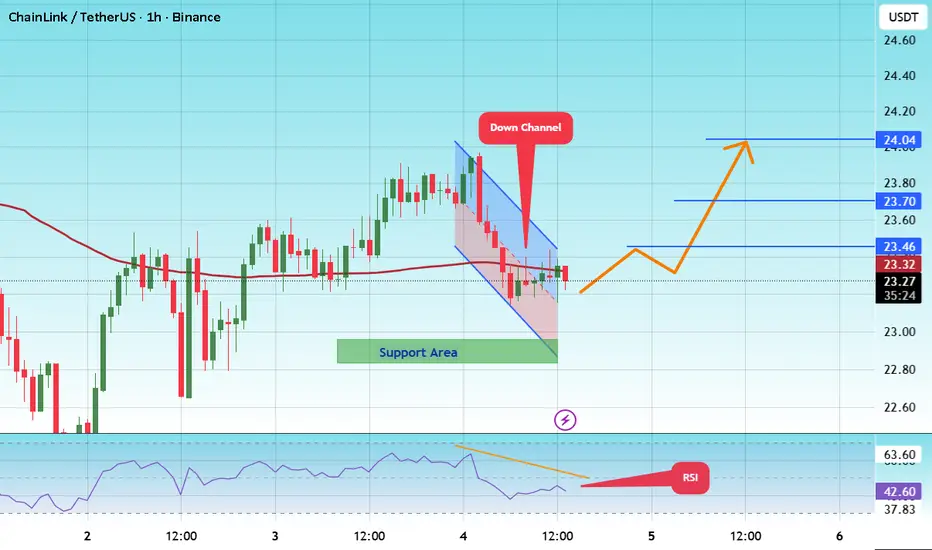
#LINK/USDT – Triangle Pattern Breakout Loading?#LINK
The price is moving within a descending channel on the 1-hour frame and is expected to break and continue upward.
We have a trend to stabilize above the 100 moving average once again.
We have a downtrend on the RSI indicator that supports the upward move with a breakout.
We have a support area at the lower boundary of the channel at 23.00, acting as strong support from which the price can rebound.
We have a major support area in green that pushed the price higher at 23.00.
Entry price: 23.26
First target: 23.46
Second target: 23.70
Third target: 24.00
To manage risk, don't forget stop loss and capital management.
When you reach the first target, save some profits and then change the stop order to an entry order.
For inquiries, please comment.
Thank you.
LINK/USDT — Golden Zone Will Decide the Next Move!?Current Price: ~23.47 USDT
Chainlink (LINK) has just completed a strong rally from the yearly low at 10.10 to the peak of 30.94. Now, the price is consolidating and retesting the Fibonacci Golden Pocket — a critical area that will decide whether the uptrend continues or a deeper pullback occurs.
---
🔎 Market Structure Analysis
Primary Trend: Strong bullish reversal since June 2025, with higher highs and higher lows forming.
Current Condition: Price is pulling back from the recent top (30.94) and consolidating around 23–25, right above the Golden Pocket (21.18–19.86).
Key Demand Zone: The yellow area (19.8–21.2), previously a strong resistance, is now acting as support (supply → demand flip). Holding this zone is crucial for the next big move.
---
🟢 Bullish Scenario
If LINK holds above 21.18–19.86, the current move is likely just a healthy retracement before continuation.
Confirmation: Daily close above 25.24–26.65 with rising volume.
Upside Targets:
🎯 Target 1: 25.24 (minor resistance)
🎯 Target 2: 26.65 (key breakout level)
🎯 Target 3: 29.20
🎯 Target 4: 30.8–31.0 (previous high)
Breaking above 30.8 could open the door for new highs in the coming months.
---
🔴 Bearish Scenario
If price fails to defend the 19.86–21.18 zone, a deeper correction may unfold.
Confirmation: Daily close below 19.8 with strong selling volume.
Downside Targets:
⚠️ Target 1: 15.63 (Fib 0.5)
⚠️ Target 2: 14.69 (Fib 0.618)
⚠️ Extreme Target: 10.10 (yearly low in case of panic sell).
---
📌 Key Technical Patterns
Bullish Flag / Consolidation: Current price action resembles a bull-flag formation after a strong impulse.
Supply-Demand Flip: The yellow zone (19.8–21.2) flipped from resistance into support — a decisive area for market structure.
Golden Pocket Fib: 0.5–0.618 retracements are historically strong levels for trend continuation.
---
🧠 Conclusion & Strategy
LINK is currently at a make-or-break golden zone.
Bullish Case: Holding above 19.8–21.2 keeps the bullish structure intact → targets at 26.6, 29.2, and 31.
Bearish Case: A breakdown below 19.8 opens risk for a correction toward 14–15 or even back to 10.1.
Trading Plan:
Accumulate near 21–23 if signs of bounce appear.
Breakout entry above 26.65 for swing targets at 29–31.
Place stop-loss below 19.8 to protect long setups.
Take partial profits at each resistance level.
---
📌 LINK is standing at a critical decision zone. Will buyers defend this golden pocket to fuel another leg up toward 30+? Or will sellers drag the price back to 15 and below?
#LINK #LINKUSDT #Chainlink #CryptoAnalysis #Altcoins #SwingTrading #TechnicalAnalysis #CryptoTA #Fibonacci #PriceAction

LINKUSDT SETUP.LINKUSDT | 1H Bullish Setup
📌 Key Structure Update
Price broke previous highs with a strong impulse and is now retracing. A clean OB + FVG = POI is marked around 24.5 – 24.7.
📍 POI Level
Demand zone + FVG overlap (confluence zone).
📝 Trade Plan
Wait for confirmation at POI before entry. Potential bullish reaction expected if price respects the demand zone.
🎯 Targets
TP1: 26.0
TP2: 27.0
❌ Invalidation
Setup invalid if price closes below 24.3.

Link Long / Buy SetupLink has two Bullish OB, if first failed, 2nd OB will push the price, ETH bulish, link is also Bullish then. Use low risk as the pump was from an event so it can be a fakeout.
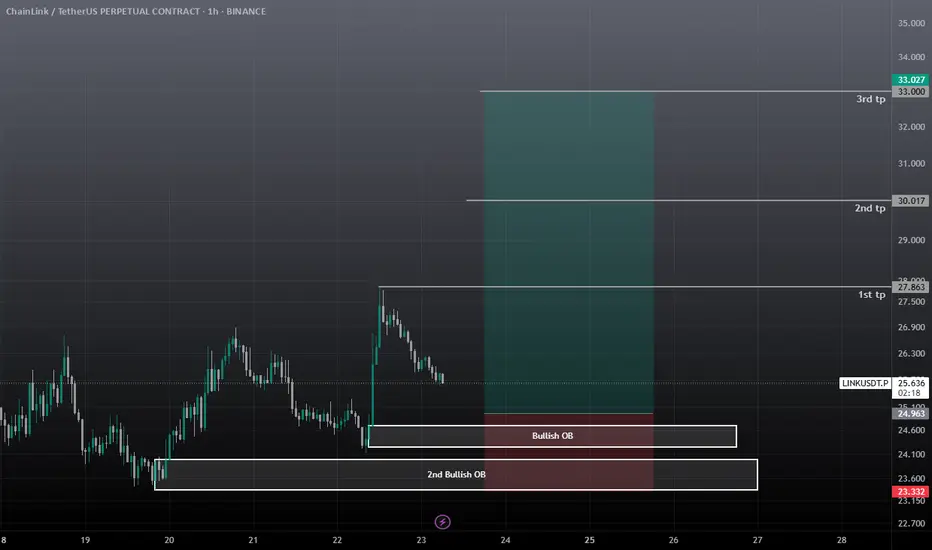
Check if it finds support around 23.98-25.17 and rises
Hello, fellow traders!
Follow us to get the latest information quickly.
Have a great day.
-------------------------------------
Chainlink is one of the coins connected to many ecosystems.
Therefore, I believe it's worth holding for the medium to long term.
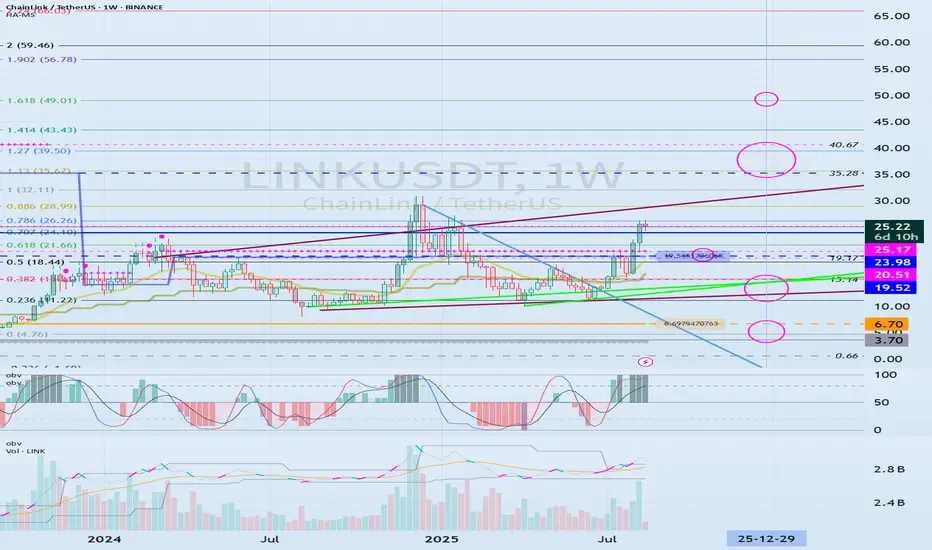
(LINKUSDT 1M chart)
The key is whether the price can find support around 23.98-25.17 and rise along the uptrend line.
If not, caution is advised as it may touch the lower uptrend line.
-
(1W chart)
If the price finds support around 23.98-25.17 and rises,
1st: 35.28-40.67
2nd: Fibonacci ratio 1.618 (49.01)
It is expected to rise to the 1st and 2nd levels above.
After that, a bearish turn appears likely.
Based on the current price, if it falls below the 19.52-20.51 range, it is recommended to stop trading and wait and see how the situation develops.
-
(1D chart)
Ultimately, the key is whether the price can break above the uptrend line (1).
If not, you should check for support within the circled area marked on the chart.
However, if the price falls below the M-Signal indicator on the 1M chart, you should stop trading and wait and see how things turn out.
-
Thank you for reading.
I wish you successful trading.
--------------------------------------------------
- This is an explanation of the big picture.
(3-year bull market, 1-year bear market pattern)
I will explain in more detail when the bear market begins.
------------------------------------------------------
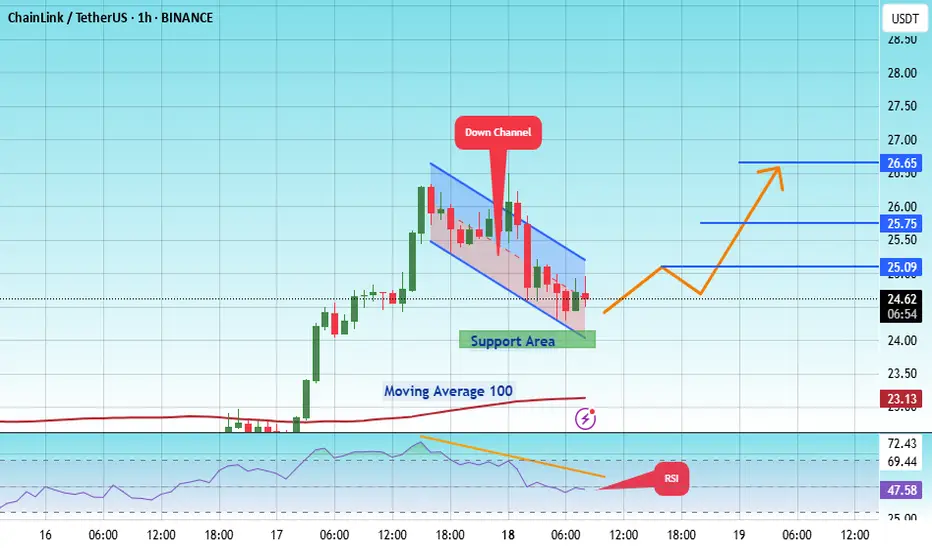
#LINK/USDT in upward mood !#LINK
The price is moving within an ascending channel on the 1-hour frame, adhering well to it, and is on track to break it strongly upwards and retest it.
We have support from the lower boundary of the ascending channel, at 24.20.
We have a downtrend on the RSI indicator that is about to break and retest, supporting the upside.
There is a major support area in green at 24.00, which represents a strong basis for the upside.
Don't forget a simple thing: ease and capital.
When you reach the first target, save some money and then change your stop-loss order to an entry order.
For inquiries, please leave a comment.
We have a trend to hold above the 100 Moving Average.
Entry price: 24.60.
First target: 25.09.
Second target: 25.75.
Third target: 26.65.
Don't forget a simple thing: ease and capital.
When you reach your first target, save some money and then change your stop-loss order to an entry order.
For inquiries, please leave a comment.
Thank you.
LINKUSDT 4H BULLISH SETUP. LINKUSDT | 4H Bullish Setup
✅ Price broke structure and created a clean FVG + Retest POI just below current levels.
✅ SSL liquidity resting near the demand zone.
🔍 Price is pulling back and may tap into 20.50 – 20.80 POI/FVG zone for demand mitigation.
📌 Trade Idea: Wait for price to reach POI and confirm bullish signals before entering.
🎯 Potential upside continuation after liquidity sweep.

#LINK/USDT targeting 17.77 $ ?#LINK
The price is moving within a descending channel on the 1-hour frame and is expected to break and continue upward.
We have a trend to stabilize above the 100 moving average once again.
We have a downtrend on the RSI indicator that supports the upward break.
We have a support area at the lower boundary of the channel at 15.60, acting as strong support from which the price can rebound.
We have a major support area in green that pushed the price higher at 15.30.
Entry price: 15.84
First target: 16.47
Second target: 17.00
Third target: 17.77
To manage risk, don't forget stop loss and capital management.
When you reach the first target, save some profits and then change the stop order to an entry order.
For inquiries, please comment.
Thank you.

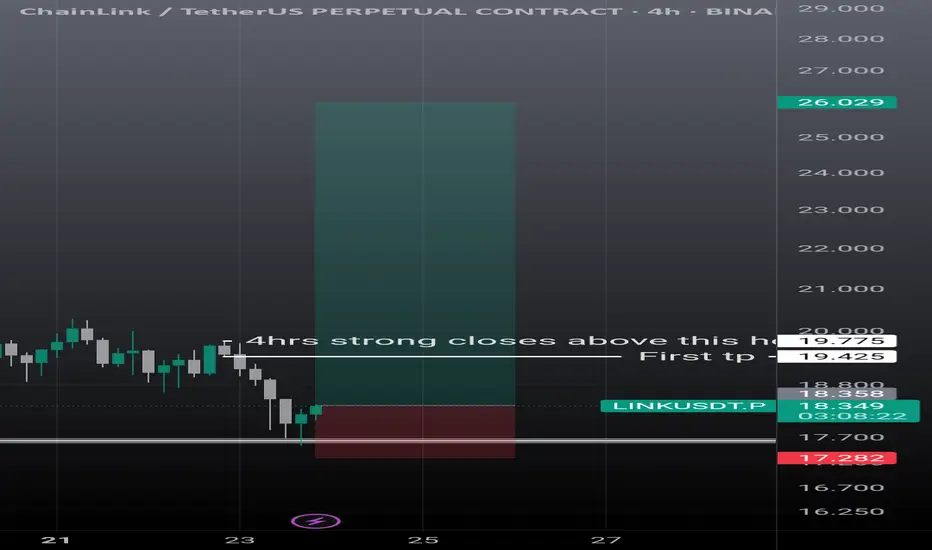
Linkusdt scalp n swing setupLink showing some strong momentum. On 4hrs it can go easily 19.30, then if it breaks strong and closes above the mentioned candle it's next stop is 26$. Must use sl as it can take further correction is it failed to break the mentioned level.
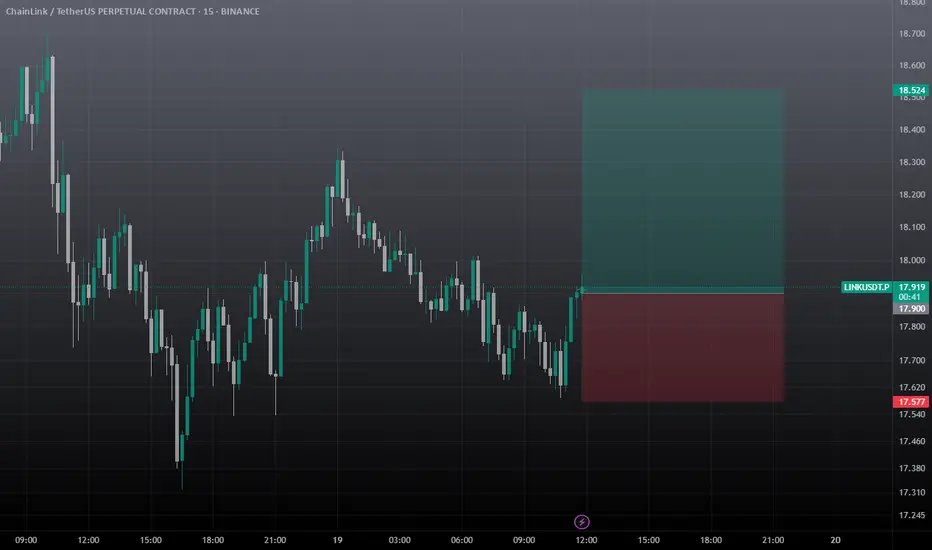
Link Scalp Trade IDEA / Long Scalp Setuplink looking to take out 18.5 area. can take at cmp 17.91, must use sl, it's a scalp trade so don't hold it for long time.
LINKUSDT Forming Falling Wedge LINKUSDT is currently forming a classic falling wedge pattern, a bullish reversal setup that often signals the end of a downtrend and the beginning of a strong upward move. The recent price action within the wedge shows decreasing volatility and tightening price levels, suggesting accumulation is underway. This setup, combined with increasing volume, indicates that a breakout to the upside could be imminent.
Chainlink (LINK) continues to draw investor interest due to its critical role in the decentralized oracle network ecosystem, which bridges blockchain smart contracts with real-world data. The project has maintained relevance in both DeFi and traditional enterprise solutions, and its consistent development activity keeps it on the radar of long-term crypto investors and short-term traders alike. With current market sentiment shifting more favorably toward altcoins, LINK’s technical and fundamental setup makes it a top watch.
The expectation for a 60% to 70% gain is well-supported by previous price performance following similar wedge breakouts. Traders are advised to monitor for a strong volume breakout above resistance lines, as this would confirm the move and likely initiate a new upward trend. If broader market conditions remain positive, LINKUSDT could move swiftly toward higher levels, fueled by both technical momentum and renewed investor confidence.
✅ Show your support by hitting the like button and
✅ Leaving a comment below! (What is You opinion about this Coin)
Your feedback and engagement keep me inspired to share more insightful market analysis with you!
