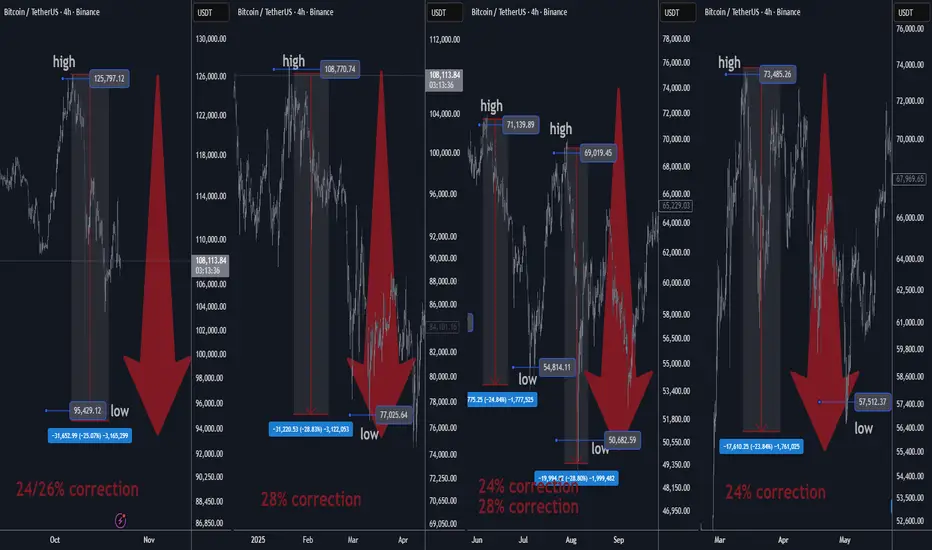
BTC High Probability Forecast Based on Real Math Bitcoin has repeatedly corrected ~mid-20% during the last 12–24 months. Using this empirical drawdown profile, a base-case correction of ~25% from a recent $126,000 high implies a **probable correction low near $94,500–$95,000.
This is a high probability forecast based on real math and stats, not science
fiction. No expanding triangles, Elliott Wave counts, Wolfe and Dragon patterns.
Bitcoin does not trade by the textbook. This is real world TA by a pro trader.
Tactical view: Expect a final flush toward ~$95k, then a reversal/bounce if market structure and liquidity conditions confirm.
Confidence: VERY HIGH —pattern consistency is notable, but crypto remains headline- and liquidity-sensitive. Use disciplined risk controls. 🧠
2) Recent Corrections (Past 12–24 Months)
# High → Low % Drawdown
1 $72,000 → $54,000 25%
2 $108,000 → $76,000 28%
3 $70,000 → $50,000 28%
4 $74,000 → $56,000 24%
Empirical mean drawdown:
(25+28+28+24)÷4 = 26.25%.
We’ll use 25% as the base-case assumption (conservative vs. the 26.25% mean). ✅
Projection for the Current Correction
Reference high: $126,000
Base-case (25%) low:
$126,000 × (1 − 0.25) = $94,500
Empirical-mean (26.25%) low:
$126,000 × (1 − 0.2625) = $92,925
Projected buy-zone: $92.9k – $95k, centered near $95k. 🎯
Liquidations
The Crypto Black Swan Event > 10 bln USD of liquidations🧭 Executive Summary of the Crypto Black Swan Event
⚡ A sudden U.S. announcement of 100% tariffs on Chinese imports triggered a broad risk-off move across assets. Crypto, heavily levered near record highs, absorbed the shock via a forced-deleveraging cascade.
📉 Bitcoin fell sharply off its Oct 5 all-time high ~$125.2k to intraday lows near $105k–$102k, a ~16%–19% peak-to-trough drawdown across venues.
💥 Within 24h, liquidations surged to a record: credible tallies cluster around ~$9.5B–$19B, with ~1.4M–1.66M accounts affected; longs comprised the vast majority.
______________________________________________________________________________
🧨 What Caused the Liquidations
🧱 Macro shock: The tariff announcement plus mooted export controls abruptly repriced global growth, supply chains, and corporate margins—sparking equity weakness and a USD bid.
⛓️ Leverage overhang: Elevated perpetual futures and options positioning into fresh BTC highs left the market top-heavy. The macro jolt flipped bids thin → stops → liquidations.
🧪 Microstructure feedback: As price gapped, market makers widened spreads; taker flow ate depth; liquidation engines sold into deteriorating liquidity, magnifying slippage and triggering further margin calls.
______________________________________________________________________________
📊 Key Stats of the Black Swan Event
🧮 Total liquidations: ~$9.5B–$19B
👥 Accounts liquidated: ~1.4M–1.66M.
📉 Side: Longs 80%–88% of notional; shorts a minority share.
₿ BTC liqs: Roughly $1.3B–$5.3B depending on the data cut.
Ξ ETH liqs: Roughly $1.2B–$4.4B depending on the data cut.
🏦 Largest single order: About $203M (ETH-USDT) reportedly auto-closed on a perps venue during the flush.
🧾 Open interest: Per-asset OI fell sharply; sample snapshots show ETH OI down mid-single-digits to double-digits %, with billions of OI notionals erased.
🗂️ Cross-asset context: U.S. equities slid >2% on the day; risk proxies weakened as the tariff shock hit.
______________________________________________________________________________
🧩 Price Action & Drawdown
🚦 BTC: From ATH ~$125.2k to low ~105k–102k during the liquidation wave ~16%–19% drawdown, then partial stabilization above ~$110k.
🧷 ETH: Intraday range ~$4.39k → ~$3.54k ~19% swing before retracing part of the move.
🧭 Timing: The steepest losses clustered around the tariff headlines, with > $6B in liquidations occurring in a short burst as per some trackers.
______________________________________________________________________________
🧠 Microstructure Dissection
🪙 Perps dominance: Crypto’s price discovery has migrated to funded perpetuals. When the macro shock hit, perps funding and basis compressed, and auto-deleveraging/liquidation engines amplified downside.
🧰 Liquidity thinning: As volatility spiked, market makers reduced top-of-book size and widened quotes. Forced sell-flows then walked the book, increasing impact and triggering adjacent liquidation thresholds
🧷 Stop-density near round levels: Crowd positioning clustered around psychological levels e.g., $120k / $110k BTC, increasing stop-gamma once those levels broke.
🔁 Vol-targeting & risk controls: Systematic players and options desks cut exposures as realized vol surged; put-skew firmed, further pressuring delta hedges.
______________________________________________________________________________
🧯 Why This Was Worse Than Usual
📌 Catalyst clarity + leverage: A binary, headline-driven macro shock met crowded, momentum-long positioning near all-time highs.
📌 Time-of-day liquidity: Parts of the move unfolded during lower-depth periods, elevating market impact of forced sells.
📌 Cross-venue fragmentation: Liquidation telemetry differs by exchange; some engines throttle reports, but the flows were real—depth collapsed across majors simultaneously.
______________________________________________________________________________
🧪 BTC & ETH: By the Numbers
₿ BTC:
• ATH (Oct 5): ~$125.2k → flush low ~$105k–$102k → settle ~$112k.
• Liquidations: ~$1.3B–$5.3B depending on window/venue.
• Narrative: From “ETF & macro tailwinds” to “trade-war risk & deleveraging.”
Ξ ETH:
• Intraday: ~$4.39k → ~$3.54k (~−19%), partial rebound thereafter.
• Liquidations: ~$1.2B–$4.4B depending on window/venue.
• Options: Defensive put demand rose as traders sought convexity; skew biased to protection.
______________________________________________________________________________
🔭 What to Watch Next
🧷 Policy path: Will tariff scope/timing evolve? Any China counter-measures e.g., rare-earths could extend risk-off.
📉 Residual leverage: Track perps funding, aggregate OI, and basis—a second-wave flush risk fades as these stabilize.
🏦 Liquidity recovery: Top-of-book depth and spreads on major venues Binance/OKX/Bybit/CME are key to gauging re-risk appetite.
🧪 Dealer positioning: Elevated implied vol and persistent downside skew would signal hedging demand and slower mean-reversion.
______________________________________________________________________________
🧰 Risk-Management Takeaways
✅ De-crowd near extremes: Size leverage down when price, positioning, and macro all point one way.
✅ Respect liquidity regimes: Use impact-aware sizing and time-of-day execution filters around macro catalysts.
✅ Hedge the tail: Cheap convexity (puts/put spreads) into binary events offsets liquidation-engine reflexivity.
✅ Diversify collateral: Avoid single-stablecoin collateral concentration; maintain spare margin buffers across venues.

Bitcoin Liquidation Levels#Bitcoin
#Binance #Liquidation #Levels
Short Liquidation
111550
105450
Long Liquidation
93100

HolderStat | BTC bulls leaving the ship?Over the last 3 days, $2.5 billion has been liquidated in the futures market, 83% of which is longs. The BTC price dropped to $96,613 (-4.6% for the week), the fear index dropped 7 points, and outflows from spot ETFs totaled an impressive $680 million.
❌ Is this a signal? No, it's a pattern. Corrections like this “drop off the tourists,” opening up new opportunities for those who know how to act strategically.
Even El Salvador did not flinch under IMF pressure and bought 11 BTC. Their wallet is usually replenished by 1 BTC per day - something is clearly brewing. What have you done?
💡 What to do?
1️⃣ Analyze key support levels.
2️⃣ Watch liquidity: BTC dominance remains high (59%), which confirms interest in the asset.
3️⃣ Evaluate trading volumes on pullbacks.
⚡️ Correction is not a time for panic, but a moment for cold-blooded analysis and precise actions.
_____________________
📊 Want more useful analytics? Like and subscribe to stay up to date with the most relevant trading ideas!
Always DYOR! 🔬

Bitcoin LiquidationBitcoin Liquidation
there is Short & Long Liquidation price on binance
I look about the liquidity prices there is a huge liquidity
Long Liquidation red line's
59300
55600
Short Liquidation long line's
73650
67500

Bitcoin LiquidationBitcoin Liquidation
there is Short & Long Liquidation price on binance
I look about the liquidity prices there is a huge liquidity
Long Liquidation red line's
64200
62650
Short Liquidation long line's
71750
67700

Bitcoin LiquidationBitcoin Liquidation
there is Short & Long Liquidation price on binance
I look about the liquidity prices there is a huge liquidity
Long Liquidation red line's
62650
55700
Short Liquidation long line's
71800
70450

Bitcoin LiquidationBitcoin Liquidation
there is Short & Long Liquidation price on binance
I look about the liquidity prices there is a huge liquidity
Long Liquidation red line's
64150
62800
Short Liquidation long line's
73550
70500

Bitcoin LiquidationBitcoin Liquidation
there is Short & Long Liquidation price on binance
I look about the liquidity prices there is a huge liquidity
Long Liquidation red line's
66900
64150
Short Liquidation long line's
72350
70500

Bitcoin LiquidationBitcoin Liquidation
there is Short & Long Liquidation price on binance
I look about the liquidity prices there is a huge liquidity
Long Liquidation red line's
69850
68350
Short Liquidation long line's
77800
73550

Bitcoin LiquidationBitcoin Liquidation
there is Short & Long Liquidation price on binance
I look about the liquidity prices there is a huge liquidity
Long Liquidation red line's
68350
66650
Short Liquidation long line's
81000
74100

Bitcoin LiquidationBitcoin Liquidation
there is Short & Long Liquidation price on binance
I look about the liquidity prices there is a huge liquidity
Long Liquidation red line's
66150
61850
Short Liquidation long line's
74950
70900

Bitcoin LiquidationBitcoin Liquidation
there is Short & Long Liquidation price on binance
I look about the liquidity prices there is a huge liquidity
Long Liquidation red line's
65450
61350
Short Liquidation long line's
81100
74450

Bitcoin LiquidationBitcoin Liquidation
there is Short & Long Liquidation price on binance
I look about the liquidity prices there is a huge liquidity
Long Liquidation red line's
65750
64450
Short Liquidation long line's
73600
72550

Bitcoin LiquidationBitcoin Liquidation
there is Short & Long Liquidation price on binance
I look about the liquidity prices there is a huge liquidity
Long Liquidation red line's
64350
60600
Short Liquidation long line's
80100
72350

Bitcoin LiquidationBitcoin Liquidation
there is Short & Long Liquidation price on binance
I look about the liquidity prices there is a huge liquidity
Long Liquidation red line's
60050
55150
Short Liquidation long line's
66850
63750

Bitcoin LiquidationBitcoin Liquidation
there is Short & Long Liquidation price on binance
I look about the liquidity prices there is a huge liquidity
Long Liquidation red line's
59900
55150
Short Liquidation long line's
66900
64600

Bitcoin LiquidationBitcoin Liquidation
there is Short & Long Liquidation price on binance
I look about the liquidity prices there is a huge liquidity
Long Liquidation red line's
60050
57700
Short Liquidation long line's
66150
64600

Bitcoin LiquidationBitcoin Liquidation
there is Short & Long Liquidation price on binance
I look about the liquidity prices there is a huge liquidity
Long Liquidation red line's
60700
56900
Short Liquidation long line's
69000
66150

Bitcoin LiquidationBitcoin Liquidation
there is Short & Long Liquidation price on binance
I look about the liquidity prices there is a huge liquidity
Long Liquidation red line's
60700
56900
Short Liquidation long line's
69700
66100

DON'T FALL FOR IT!! Can you tell me what's next?Every #Bitcoin consolidation since the bottom has had 3 things in common...
1. Each time, it has created a "retail" pattern, such as a wedge.
2. The pattern seemed to #breakout (signaling traders to go long and becoming trapped), only to realize the move as a #fake-out back into the pattern.
3. Then, there seems to be a continuation to the breakdown of the pattern (liquidating late longs and signal traders to go short and becoming trapped), only to deviate back into the pattern just before a massive move to the upside (liquidating the late shorts).
This false move to the downside, so far, has also always correlated to the bottoming of the #StochasticRSI.
The market makers want your bags and this is how they get them.
------
Tell me what comes next... 😏

Bitcoin LiquidationBitcoin Liquidation
there is Short & Long Liquidation price on binance
I look about the liquidity prices there is a huge liquidity
Long Liquidation red line's
60700
56250
Short Liquidation long line's
69700
65000

Bitcoin LiquidationBitcoin Liquidation
there is Short & Long Liquidation price on binance
I look about the liquidity prices there is a huge liquidity
Long Liquidation red line's
56100
51550
Short Liquidation long line's
68850
65350
