USD/JPY - Forecast 🕰 Weekly View
Price is ranging under 148–150 weekly resistance while holding above the 142–144 weekly demand zone. If demand continues to hold, we could see a push back toward the 156–158 target. A clean break below 142 would invalidate this outlook.
📉 Daily Structure
Major Resistance: 148–150 supply block
Major Support: 142–144 demand zone
Price is coiling between mid-range weak support and overhead resistance, building liquidity for the next move.
⏱ 8H Breakdown
On the 8H, price is capped under the descending trendline. Refined demand sits around 144–145. A sweep into this level could fuel the next bullish continuation. Breakout above 150 opens the road directly into 156–158.
🔎 Outlook
Short-term pullback still possible → but overall structure favors a mid-term bullish continuation targeting 156–158.
Bias: Short-term pullback → mid-term bullish.
Liquidity

Solana ( SOL/USD) - Bullish Continuation SetupBias: Bullish
High-Timeframe (4H/1H):
Structure is clearly bullish. Price has broken significant highs, showing strong upward momentum. HTF structure has been mapped and refined, indicating that smart money is in control and continuation is likely.
Mid-Timeframe (30M):
Dropped down to monitor continuations. Structure is aligned with HTF bullish intent and has been refined at its finest. Currently waiting for a deep sell-side liquidity sweep to properly mitigate the internal order blocks within the framework. Patience is key here—no premature entries.
Lower-Timeframe (5M):
After proper mitigation occurs, we drop to 5M for precise confirmations. Look for price to hold the mitigated area and ensure internal courtyard liquidity is absorbed. This sets up for riding the furthest highs with smart money support.
Entry Zone: Pending proper mitigation of mid-timeframe order blocks.
Targets:
• Lower timeframe highs (5M)
• Mid-timeframe highs (30M)
• Extension to HTF highs, depending on market delivery
Mindset Note:
Smart money leads, we follow. No forcing trades—wait for full mitigation and lower timeframe confirmation before engaging. Patience and precision are the edge.

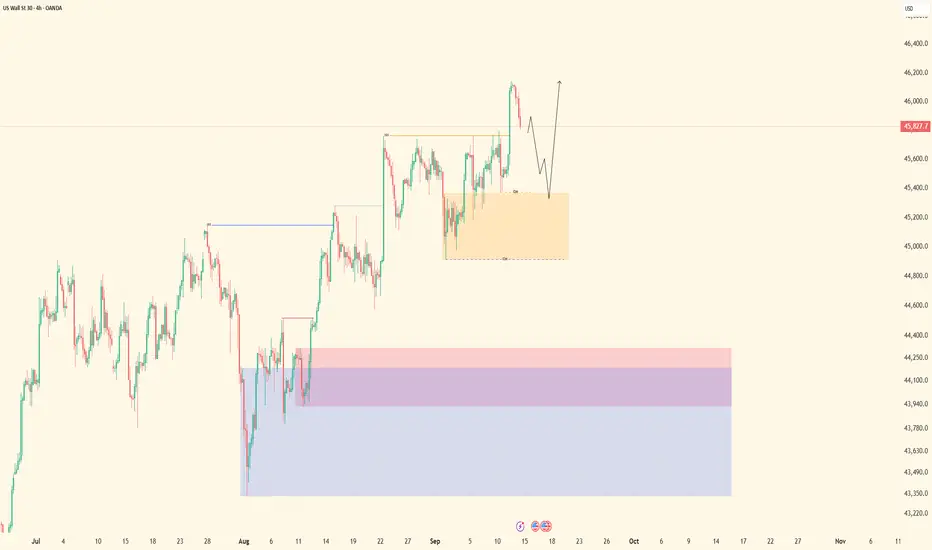
US30 - Bullish Continuation SetupBias: Bullish
High-Timeframe (4H/1H):
Price shows a strong bullish board structure with momentum firmly to the upside. Volume candles are clean and imprinted, signaling continuation potential and smart money control.
Mid-Timeframe (30M):
Dropped down to monitor board continuations. Structure has been mapped and refined—everything is aligned with HTF bullish intent. We are now waiting for proper sell-side liquidity to be taken. This is the “courtyard” where stops are absorbed before smart money resumes the upward move.
Lower-Timeframe (5M):
Once mitigation occurs and the order block is properly cleared, we will drop to 5M for precise entry confirmation. Price should hold the mitigated area, confirming smart money support before riding the continuation.
Entry Zone: Pending proper mitigation of the mid-timeframe order block.
Targets:
• Lower timeframe highs (5M)
• Mid-timeframe highs (30M)
Mindset Note:
Let smart money lead direction. No rushing entries—wait for the order block to be mitigated and price to confirm support before engaging. Patience and precision over impulse.
Gold (XAU/USD) - Bullish Continuation in PlayBias: Bullish
High-Timeframe (4H/1H):
Price is showing a strong bullish structure with momentum firmly to the upside. Volume candles indicate imprinted buying, suggesting continuation potential. Smart money is clearly in control of this leg.
Mid-Timeframe (30M):
We’ve spotted a sell-side liquidity sweep. Waiting for the deeper “slash through the courtyard” to properly mitigate the underlying order block. No entries yet—patience is key. This zone shows where smart money absorbs stops before resuming the bullish leg.
Lower-Timeframe (5M):
Once mitigation is complete, we drop to the 5M for precise confirmation. Look for price to hold the mitigated area, showing smart money support. Entry confirmation aligns with micro-structure flips and final inducements.
Entry Zone: Pending proper order block mitigation.
Targets:
• 5M highs for quick continuation trades
• 30M highs for extended bullish movement
Mindset Note:
Let smart money lead the way. No rushing entries—precision beats impulse. Wait for proper mitigation and confirmation before committing.

GBPJPY - Bullish Continuation in PlayBias: Bullish
High-Timeframe (4H): Structure shows strong bullish intent. Momentum and volume are clearly favoring the upside, indicating continuation potential. Price has respected key bullish order blocks and shows no signs of structural weakness.
Mid-Timeframe (30M): Aligning with HTF, the mid-timeframe continues the bullish flow. We are monitoring for proper mitigation of the underlying sell-side liquidity—this is the zone where smart money absorbs stops before pushing price higher. No entries yet; patience is key.
Lower-Timeframe (5M): Once the mid-timeframe OB is properly mitigated and sell-side liquidity is taken, we will drop to the 5M for precise entry confirmation. Look for micro structural flips (LH/HL) and inducement sweeps to align with the bullish HTF bias.
Entry Zone: Pending mitigation of the mid-timeframe order block.
Targets: HTF highs and extensions. Precise targets will be refined on lower-timeframe confirmation.
Mindset Note: Patience and alignment matter more than speed. Let smart money set direction—enter only with confirmed structure and clean liquidity absorption.

EUR/GBP - Bullish Structure in Full Effect
Pair: EUR/GBP
Bias: Bullish
HTF Overview (4H+):
• Strong bullish intent shown as structure keeps breaking to the upside.
• Momentum remains with buyers — clear directional bias is given.
MTF (30M–1H):
• Structure mapped and refined clean.
• Price is respecting order blocks with precision, confirming continuation flow.
• A mid-TF mitigation provided the base for alignment with HTF direction.
LTF Execution (5M):
• Dropped into the LTF after mitigation for confirmation.
• A clear CHoCH allowed us to attend longs in line with higher structure.
• Targets are staged: 5M highs → 30M highs → 4H highs, depending on delivery.
Mindset Note: The pair is respecting smart money levels beautifully. No rush — we wait for proper mitigations to enter clean, and let smart money lead the way.

EUR/JPY - Bullish Continuation FlowPair: EUR/JPY
Bias: Bullish
HTF Overview (4H+):
• Strong bullish intent and structure confirmed.
• Price launched aggressively, setting the tone for upside continuation.
• Mapping remains aligned with bullish structure — HTF run in progress.
MTF (30M–1H):
• Price mitigated a deeper, refined anchor order block.
• From that mitigation, a clean CHoCH confirmed continuation order flow.
• Mid-timeframe mapping points toward upside until the next highs are breached.
LTF Execution (5M):
• Each mitigation offered precise entry opportunities on the LTF.
• Currently riding longs through staged targets: 5M highs → 30M highs → 4H highs.
• Most recent LTF OB was mitigated and respected, giving another continuation entry.
Mindset Note: Positions are in motion. No adjustments needed until key highs are breached. Letting profits run with mapped structure — top-down alignment respected, smart money delivering.

NZD/JPY - Bearish Momentum Aligned with HTF SupplyPair: NZD/JPY
Bias: Bearish
HTF Overview (4H+):
• Price cleared buy-side liquidity into a higher-timeframe order block.
• Momentum shifted bearish as supply held, giving us downside intent.
MTF (30M–1H):
• From that supply zone, we waited for a shift in structure (CHoCH).
• Momentum aligned bearish, with price taking out previous buy-side liquidity.
• A refined OB above was mitigated, reinforcing continuation downside.
LTF Execution (5M):
• Dropping to the lower timeframes, we caught an initial shift in trend to align with the dominant bearish flow.
• Both HTF + MTF + LTF now in sync → direction is confirmed.
• Next focus: wait for a clean buy-side liquidity sweep + OB mitigation to attend the next sell entries.
• Targets staged: 5M lows → 30M lows, depending on delivery.
Mindset Note: The flow is clear — bearish momentum is in control. No forcing; let price sweep liquidity, mitigate, and then ride with smart money direction.

GBP/USD - Smart Money Longs in MotionPair: GBP/USD
Bias: Bullish
HTF Overview (4H):
• Structure and intent remain bullish on the 4H.
• A clean sell-side liquidity sweep set the stage.
• Deep mitigation into the 4H order block confirmed upside flow.
MTF (30M–1H):
• Attending bullish continuation after a refined mid-TF order block mitigation.
• Liquidity sweep at the lows reinforced the setup.
• Momentum points toward upside delivery; waiting for a mid-TF high to be breached for full confirmation.
LTF Execution (5M):
• Dropped into the 5M for continuation entries after the mid-TF mitigation.
• Monitoring live price delivery as we chase staged targets: 5M highs → 30M highs, depending on market delivery.
Mindset Note: Direction is clear — smart money is leading. Longs are in play, patience and monitoring are key until mid-TF highs give way.

USD/JPY - Riding Bullish ContinuationPair: USD/JPY
Bias: Bullish
HTF Overview (4H):
• Structure remains bullish with intent confirmed on the 4H.
• Mapping is consistent with previous weeks → we are still within a continuation phase.
• Flow points toward higher delivery into the 4H highs.
MTF (30M–1H):
• Attending mid-timeframe longs in alignment with higher timeframe structure.
• Price action continues to respect the mapped structure to its finest.
LTF Execution (5M):
• Lower timeframes have already given clean mitigations.
• We’re currently riding with price, monitoring its delivery.
• Targets are staged: 5M highs → 30M highs → 4H highs depending on order flow.
Mindset Note: This is a continuation play — stay disciplined, no forcing. Just trail along with delivery and let the market do the heavy lifting.

EUR/USD - Bullish Continuation SetupPair: EUR/USD
Bias: Bullish
HTF Overview (4H):
• Price showed bullish intent after a sell-side liquidity sweep.
• A refined bullish order block was mitigated.
• Structure remains aligned with previous weeks’ mapping → price is rolling within the mid-4H range flow toward the highs.
MTF (30M–1H):
• Clear bullish continuation order flow spotted.
• We are now waiting for a deeper order block mitigation for refined entry.
LTF Execution (5M):
• Once the deeper OB mitigation is clean, we’ll drop to 5M for precise entries.
• Targets = 5M highs first, then 30M highs depending on market delivery.
Mindset Note: Patience is key here — no chasing. Let price deliver the deeper mitigation before attending the move.

USD/CAD - Forecast 13/9🕰 Weekly
Price has been holding inside a swing range with support around 1.36 – 1.37 and resistance higher near 1.46. Structure hints at a bigger bullish leg if buyers step in.
📅 Daily
Market is pressing against a descending trendline and sitting in a parallel channel. Demand is building around 1.37 – 1.38, while upside targets point toward 1.41 – 1.42 if broken.
⏱ 8H
Price recently swept liquidity below (BSL) and is now coiling under resistance. If we hold 1.37 support, the path opens for a push into 1.40 – 1.41.
🎯 Outlook
Bullish Case: Hold above 1.37 → breakout toward 1.40 – 1.42.
Bearish Case: Lose 1.37 → deeper correction back toward 1.35 demand.
⚖️ Bias : Short-term consolidation → mid-term bullish toward 1.40+.
Thanks traders and like and follow if you agree

Liquidity Voids: Where Price Runs Through Empty Space█ Liquidity Voids: Where Price Runs Through Empty Space
Big moves don’t just “happen”, they happen because either buyers or sellers step aside and let price run.
A liquidity void is what’s left behind when that happens: an area on the chart where price traded with very little volume, leaving a ‘hole’ in market participation.
This is not just another fair value gap. A typical FVG can form on normal volume during strong momentum. A liquidity void specifically signals a displacement under thin conditions, meaning the move was too easy, and price often comes back to check that area later.
█ What Exactly Is a Liquidity Void?
Think of the order book as a ladder of bids and asks. Normally, price moves step by step as orders fill at each level. But when there aren’t enough orders (low liquidity), price jumps levels and that jump is your void.
On a chart, it shows up as:
A large, one-directional candle with very small or no wicks overlapping neighbors.
Little or no volume relative to the move’s size (thin participation).
Price displacement that looks almost “too clean” — no hesitation, just a straight run.
These clues tell you price didn’t just move on heavy buying/selling, it moved through empty space.
⚪ Liquidity Void Detector
Use this free Liquidity Void Detector indicator to spot liquidity voids. It signals when the market makes a relatively sharp move on comparatively low volume, helping you spot these voids in real time.
█ Why Low Volume Matters
⚪ Not All Gaps Are Voids
A fair value gap can form on high participation, think of a breakout candle with heavy volume and institutional backing. That’s an accepted price move.
⚪ Voids Are Different
A liquidity void happens when the market skips prices because there was no one there to trade. It’s an inefficient move that the market often wants to revisit and “fill in” once participation returns.
⚪ Volume as the Filter
When volume is below its own average (or below a trend baseline), it tells you this wasn’t a “healthy” move, it was a thin-book displacement.
█ How Traders Use This
⚪ Mark the Zone
Draw the high and low of the candle(s) that created the void. This is your “inefficiency zone.”
⚪ Wait for the Return
Voids often act like magnets. Price often reverses and retests or fills the void, but it can just as easily slice through the zone once revisited, as thin liquidity offers little resistance.
█ What Research Show
Academic studies on price gaps find that immediate fills are rare, but the probability of fill rises over time. Downward voids (panic selling) fill faster on average than upward voids.
Crypto traders track CME Bitcoin gaps and report over 80–90% eventually get filled, but timing is unpredictable.
Volume-adjusted strategies outperform simple gap-filling because they focus on inefficient moves, not every gap. The key is filtering for thin participation.
█ Bottom Line
Liquidity voids are not just gaps, they are evidence of skipped prices under low participation.
They tell you where price moved “too easily,” leaving behind unfinished business.
Learn to filter for low-volume displacements, mark those zones, and watch how often price comes back to rebalance them. This turns a random candle into a predictive level, one that can guide your mean reversion trades or act as a support/resistance flip in trending markets.
-----------------
Disclaimer
The content provided in my scripts, indicators, ideas, algorithms, and systems is for educational and informational purposes only. It does not constitute financial advice, investment recommendations, or a solicitation to buy or sell any financial instruments. I will not accept liability for any loss or damage, including without limitation any loss of profit, which may arise directly or indirectly from the use of or reliance on such information.
All investments involve risk, and the past performance of a security, industry, sector, market, financial product, trading strategy, backtest, or individual's trading does not guarantee future results or returns. Investors are fully responsible for any investment decisions they make. Such decisions should be based solely on an evaluation of their financial circumstances, investment objectives, risk tolerance, and liquidity needs.

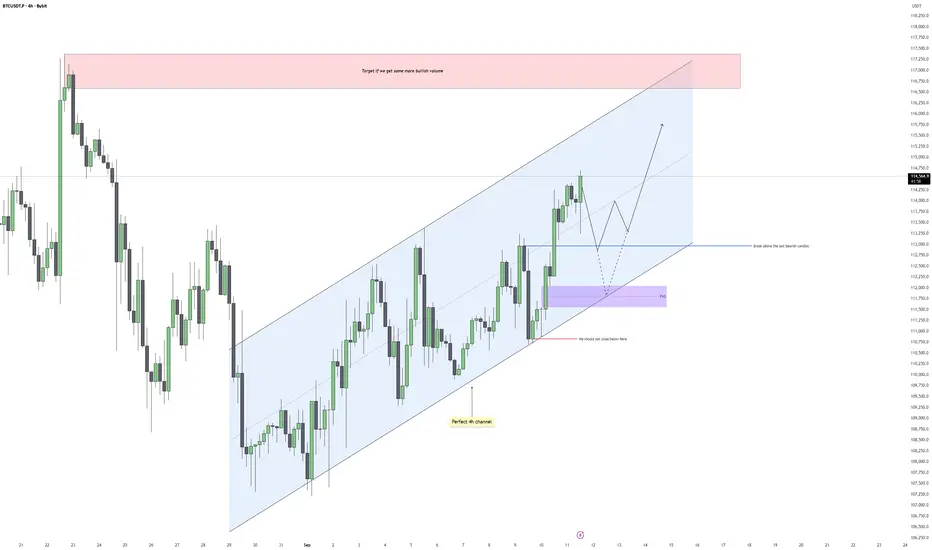
Bitcoin - Clearing the Gaps on the Way to 117kBitcoin continues to respect the ascending channel on the 4H chart, showing steady higher highs and higher lows with clean structure. Price has been climbing with solid bullish momentum, and each retracement so far has been contained within the channel. This gives us a clear framework to track both short-term pullbacks and the next potential leg higher.
Channel Dynamics
The channel is holding perfectly, with both the upper and lower bounds being respected almost to the point. As long as price trades within this structure, the bias remains bullish. A deep pullback into the lower side of the channel would not necessarily invalidate the setup, but we should avoid closing below the last key demand zone if we want to keep the bullish structure intact.
Fair Value Gaps Below
Before continuing higher, Bitcoin may dip back into inefficiencies left behind. A key fair value gap sits below around the 111,700–112,300 region, aligning with prior support. Price filling this gap would be healthy for the structure, giving bulls a better base to push from. If price respects that level, the probability of a continuation toward the channel highs increases significantly.
Bullish and Bearish Scenarios
On the bullish side, if we hold the demand zone and reclaim the blue structure line, price should attempt to sweep short-term highs and extend into the upper channel boundary. A clean break above would open the door to the red supply zone around 117,000–118,000. On the bearish side, any decisive close below the purple fair value gap would shift momentum and put pressure on the lower channel boundary, signaling weakness and invalidating the immediate bullish scenario.
Price Target and Expectations
If the structure continues to play out, I expect Bitcoin to first dip into the imbalance below, find support, then make another leg higher toward 116,500–118,000. This area is a logical liquidity pool where stops above recent highs are clustered, and also aligns with a major supply zone. That zone should be closely monitored for reactions and potential reversals.
Conclusion
Bitcoin remains in a constructive bullish channel, but gaps below need to be addressed before a push into higher liquidity levels. I will be looking for a retracement into the imbalance to set the stage for a continuation higher into the upper red supply zone. As long as we hold above the key demand region, the bullish play remains valid.
___________________________________
Thanks for your support!
If you found this idea helpful or learned something new, drop a like 👍 and leave a comment, I’d love to hear your thoughts! 🚀
Bitcoin targets liquidity at 117K before CPI data impact📊 On the daily timeframe, BTC has broken above the key resistance zone around 113K–114.5K, showing strength. Currently, the market is eyeing the 117K liquidity zone as the next potential target.
🔍 On shorter timeframes, the structure suggests momentum is tilted upward, while the longer timeframe still hasn’t confirmed a higher high. This makes the upcoming move critical in deciding whether BTC can finally establish a new higher high or not.
💡 The outcome hinges on today’s CPI inflation data. A favorable CPI print could fuel a rally toward 122.5K, while a neutral or weak print might only push BTC to test liquidity near 117K.
⚡ All eyes are now on September 17th when the Federal Reserve interest rate decision will follow this CPI release. That verdict will set the broader direction for BTC and the entire market.
As of now, probability leans toward liquidity grab around 117K, with extended potential toward 122.5K if macro data aligns bullishly.

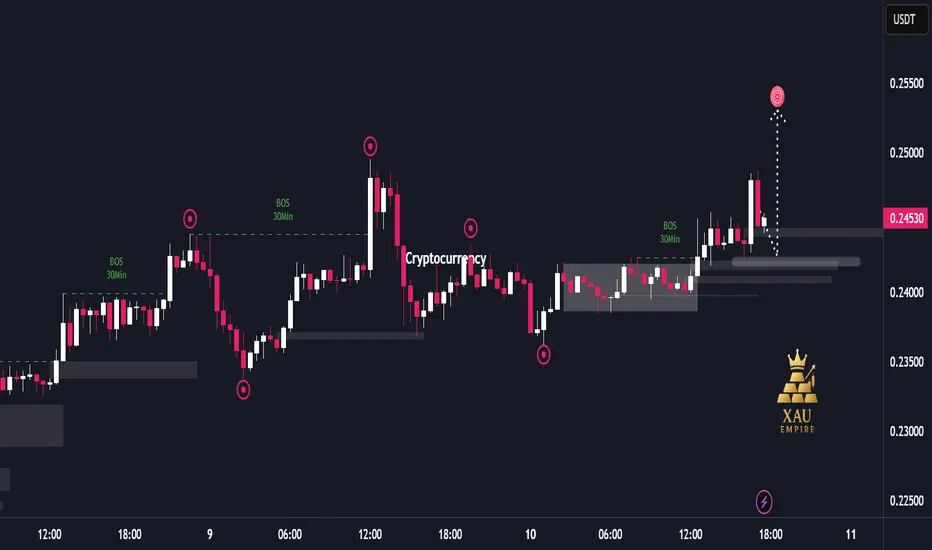
Institutional Flow Driving DOGE Upside Liquidity Hunt📊 Report-Based Analysis
Market Structure:
The chart shows multiple “Break of Structure (BOS)” events, indicating that institutional orders are driving the market direction. Frequent upside BOS suggests that the bullish trend is currently dominant.
Liquidity Movements:
Price has repeatedly hunted liquidity around major highs and lows (sharp wicks and sudden moves triggering stop losses) before returning to its intended direction. This behavior reflects strong institutional control over market flow.
Price Action Dynamics:
First, the market expanded upward with strong bullish momentum.
A sharp correction followed, creating volatility.
Afterwards, price entered a consolidation phase, which later broke to the upside.
Despite a recent rejection, the bullish structure remains intact.
Current Situation:
Price is trading around the 0.245 area. A large bullish candle was followed by a quick rejection, but the broader structure continues to lean bullish. Projections on the chart suggest a potential push higher as liquidity targets remain above.
Market Bias:
Short-term bias remains bullish. The consistent BOS and formation of higher lows show that the market is more likely to continue seeking upside liquidity in the near term.
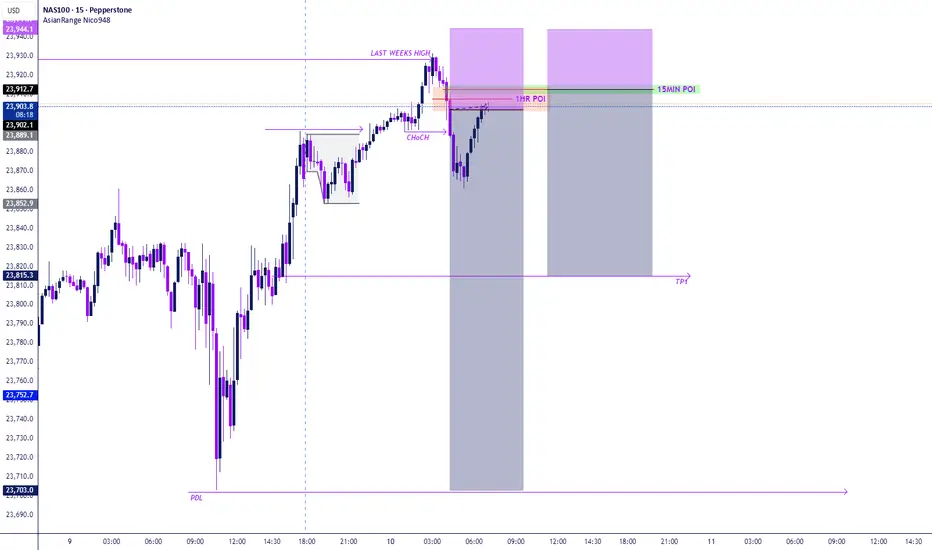
NAS100 – Liquidity Sweep & Short Setup (1H + 15M Scaling)After an aggressive bullish run, NAS100 swept last week’s high and immediately shifted structure (ChoCH).
This confirms external liquidity has been taken and market sentiment is turning bearish.
🔎 Trade Narrative
1. Liquidity Sweep → Last week’s high taken.
2. ChoCH → Order flow shifted bearish after sweep.
3. POIs in Play:
1H Supply Zone → First entry short (early exposure, confirmation).
15M Refined POI → Sell limit placed (precision scaling inside the 1H zone).
4. Target → Previous Day’s Low (PDL) as the next liquidity pool.
📐 Execution Plan
Entry 1: Short from 1H POI ✅
Entry 2: Sell limit at refined 15M POI ✅
Stop Loss: Above 1H supply sweep candle.
Take Profit: Previous Day’s Low (PDL).
Risk Management: Total risk capped at 1% across both entries.
🧠 Institutional Logic
Scaling entries across HTF + LTF zones provides:
Higher TF confirmation ✅
Lower TF precision ✅
Blended entry for better RR ✅
⚖️ Bias: Bearish
Targeting PDL unless price structure shifts bullish again.
USD/JPY - Top Down Analysis 🟣 Monthly Chart (Macro Structure)
Context: Price has been ranging within a broad band between 162 resistance and 138–140 support.
Current Zone: Sitting mid-range near 147–148, right under a heavy monthly supply block (150–152).
Bias: Until 150+ breaks clean, upside is capped. Structure suggests more downside liquidity hunts.
🔵 Weekly Chart (Swing Bias)
Supply Zone: Weekly supply at 150–152 rejected strongly.
Trendline: Rising liquidity channel (higher lows), but capped at supply.
Order Flow: Repeated rejections indicate sellers still control the higher timeframe.
Bias: Bearish toward the liquidity resting around 145.
Key Levels:
Resistance: 150–152
Support: 144–145
🟢 Daily Chart (Refined Structure)
Supply Reaction: Strong rejection from the 61.8% retrace within the weekly supply zone.
SSL (Sell-Side Liquidity): Resting neatly at 145 handle, aligning with trendline support.
Bias: Lower-high structure under supply → daily order flow favors continuation down.
⏱ 1H Chart (Execution Layer)
Supply Zone: 147.7–147.9 (confluent with 71% fib retrace & weak resistance).
Reaction: Intraday rejection already showing weakness.
Next Path: Break of weak support at 147.0 would confirm continuation toward 146.8 → 145.5.
Intraday Bias: Sell rallies back into 147.7–147.9.

USD/JPY - Targets for next move Hi Traders, what are everyone's thoughts on USD/JPY?
This is my view.. I see price in HTF making Bullish movements reacting of Demand zones. What we have now is a very clear ranging market after price came off the Supply zone. BSL was swept and now we are stuck between a very weak Support and Resistance.
So what I belive will happen next will be due to HTF bullish Demand, I see SSL liquidity that has to be swept before buyers step in to drive the price back up again. Im seeing much stronger rejections from sellers than I am from buyers currently telling me Sellers have more control.
I do have short positions currently active but I will continue to add more positions on this pullback. The highlighted yellow area within the IMB will be my targets.
Good luck traders and please follow and comment if this was helpful

1:18RR long position goldi had a successful scalp and executed good entries on the fvg and trend liquidity on gold during asians session today but with the scalp the idea was to secure profits at the PDH/ATH while i wait for NY / London session to see if gold will continue to rise like a rocket.
the whole idea here is the long position the bigger picture because with the technical analyses my anticipation has always been to see gold rising till infinity to start with $3500 and $3700.
do you think gold prices will increases to the final key levels?

1:4RR scalp I caught this good entry during asian session today. It played out well.
Even though I still anticipate final prices for gold around price key level $3700-$3712 I had to target this small move till the ATH/PDH/SSL.
I shared it on my X platform.
What are you thoughts on gold about my aniticipation to rise until $3700-$3712 levels?
ES (S&P500) - Analyses - Breakout or Breakdown Plan (Sep 9)S&P 500 E-mini (ES) keeps ranging inside 6,490–6,505, with repeated taps of 6,516 above and 6,490–6,496 below. Tomorrow I’m stalking a box resolution during the AM session, then a second chance in the PM window.
Key Zones
Resistance: 6,505–6,516 (NYPM/NYAM lid). Above it: 6,541.25 (PDH) → 6,547.75 (IBH).
Support: 6,495–6,490 (NYAM/NYPM floor). Below it: 6,481.0 → 6,471.5 (hard pools).
Range to watch: 6,490–6,505 (decision box).
Game Plan (structure-first)
LONG (breakout-acceptance)
1. 5-minute displacement close > 6,505–6,516.
2. Retest 6,501–6,503 (OB/FVG/OTE) and hold.
3. Entry on confirm; Targets: TP1 6,541.25, TP2 6,547.75, TP3 6,555+.
4. Invalidation: any 5-minute body back ≤ 6,500 after breakout.
SHORT (breakdown-acceptance)
1. 5-minute displacement close < ~6,496.
2. Retest 6,498–6,500 (failed reclaim) and roll.
3. Entry on confirm; Targets: TP1 6,481.0, TP2 6,471.5, TP3 6,464–6,465.
4. Invalidation: any 5-minute body ≥ 6,500 after fill.
Timing windows
Primary: 09:30–11:30 ET and 13:30–15:30 ET (trade management only in between).
We are currently consolidating below 6,516, with a clear liquidity ladder leading to PDH 6,541.25 if the movement is accepted. If it fails, we have stacked support levels around 6,481 and 6,471 that typically attract price action once 6,496 breaks down.
Please confirm with ES and NQ: we want both indices to move in sync (no bearish signs of market tension on longs, and no bullish signs of market tension on shorts).
What could affect ES tomorrow?
NFIB Small Business Optimism (Aug): 6:00 AM ET.
API crude inventories (for CL correlation): Tuesday around 4:30 PM ET.
(For Wednesday's context: EIA petroleum report at 10:30 AM ET.)

XAUUSD - Entry plan 2 is on a run.1 SL, Second entry is on a run. Went up to take a liquidity above.
