GBP/USD| Bullish Correction Within TrendBias: Bullish
4H Overview:
• Price continues to break highs with strong bullish structure and heavy volume.
• Multiple large bullish candles confirm momentum and strength in direction.
• Current correction is reacting from a major high timeframe order block zone, giving us a controlled pullback inside structure.
30M–5M Refinement:
• Midterm structure refined — price mitigated discounted levels (highlighted in darker orange).
• Bullish reaction confirmed with internal CHoCH (break of lower highs).
• Expecting a sell-side liquidity sweep into deeper discounted areas before continuation.
• Watch for mitigation at internal OBs before executing new buy entries.
Mindset Note:
Stay patient through the correction — structure is intact, order flow is clear, and deeper liquidity will fuel the next leg up.
Liquidity

EURUSD| Bullish Flow Within structureBias: Bullish
4H Overview: Price continues to respect bullish structure, breaking significant highs while remaining within the broader weekly flow. The midterm discounted order block aligned perfectly with a higher timeframe OB — giving strong confluence for continuation.
30M–5M Confirmation: After mitigation, price broke internal lower highs, signaling a clear CHoCH and shift in direction.
Expectations: Looking for sell-side liquidity to be swept before another leg up. Closest internal OB may fail — I’m anticipating a deeper discount tap before continuation.
Mindset Note: Patience pays when structure and liquidity are aligned. Let price come to your zone — not the other way around.

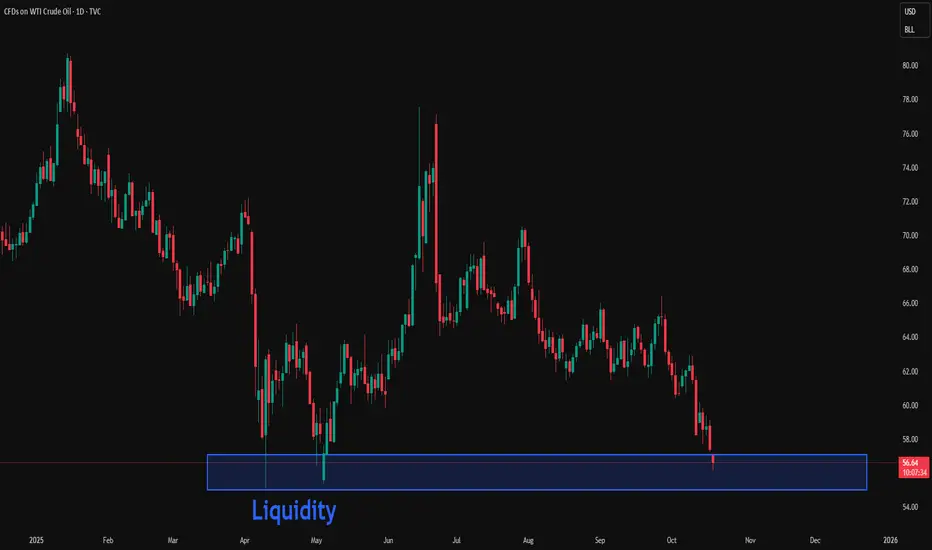
USOIL: Waiting for a liquidity sweep on the Daily timeframeIn my previous analyses on USOIL, including the fundamental outlook, price has been trending lower within a narrow channel between $70 and $50.
I’m looking for a buy opportunity on higher timeframes after a large liquidity sweep.
Weekly Outlook:
* Trend: assessed using at least three trend indicators, with market structure as the primary guide.
** Weak or Reversal Signals: Assessed based on one of our criteria for trend reversal signals.
*** Support/Resistance: Selected from multiple factors – static (Swing High, Swing Low, etc.), dynamic (EMA, MA, etc.), psychological (Fibonacci, RSI, etc.) – and determined based on the trader’s discretion.
**** Our advice takes into account all factors, including both fundamental and technical analysis. It is not intended as a profit target. We hope it can serve as a reference to help you trade more effectively. This advice is for informational purposes only and we assume no responsibility for any trading results based on it.
George Vann @ ZuperView
Bitcoin - First Signs of the Bear AwakeningBitcoin recently swept the previous all-time high, taking liquidity from the major external range. After that sweep, price reacted sharply downward, leaving behind a significant daily imbalance. This gap is now acting as resistance, with clear rejection seen on the daily timeframe. The move signals exhaustion from buyers and an early sign that the market could be preparing for a deeper retracement phase.
Consolidation Structure
Following the rejection, Bitcoin is moving within a short-term consolidation range, sitting between the daily imbalance above and a major demand zone below. This structure represents indecision as the market transitions from expansion to a potential reaccumulation or redistribution phase. The large wick left behind during the last drop suggests that liquidity was collected below the previous range, but it remains unfilled, hinting at unfinished business in that area.
Bullish Scenario
In the short term, a bounce from the lower zone could play out as the market attempts to correct the imbalance. This would align with a 50% fill of the previous large wick, providing the liquidity needed before resuming any sustained downside movement. If buyers manage to reclaim control temporarily, the move would likely target the unfilled 4-hour gaps sitting above current price.
Bearish Scenario
However, any upside reaction is expected to face resistance at the daily imbalance. Once those 4-hour gaps are filled, the likelihood of another rejection increases. If that rejection confirms, it could trigger a larger selloff targeting the strong support area below, where the next round of liquidity rests. The reaction from that zone will determine whether the market continues lower or begins forming a new base for accumulation.
Price Target and Expectations
The ideal flow would see Bitcoin dip to fill 50% of the large wick, find temporary support, then stage one final bounce into the 4-hour imbalance zone before resuming its bearish leg. This structure keeps the overall narrative intact, combining liquidity behavior with efficient price delivery.
Conclusion
Bitcoin’s current setup remains technically balanced between two key inefficiencies. A short-term bounce is likely before continuation lower, with the daily gap rejection acting as the main pivot point in this structure. Until the wick fill and 4-hour gaps are resolved, the path of least resistance remains to the downside.
___________________________________
Thanks for your support!
If you found this idea helpful or learned something new, drop a like 👍 and leave a comment, I’d love to hear your thoughts! 🚀

Bitcoin - What to expect from this week?Introduction
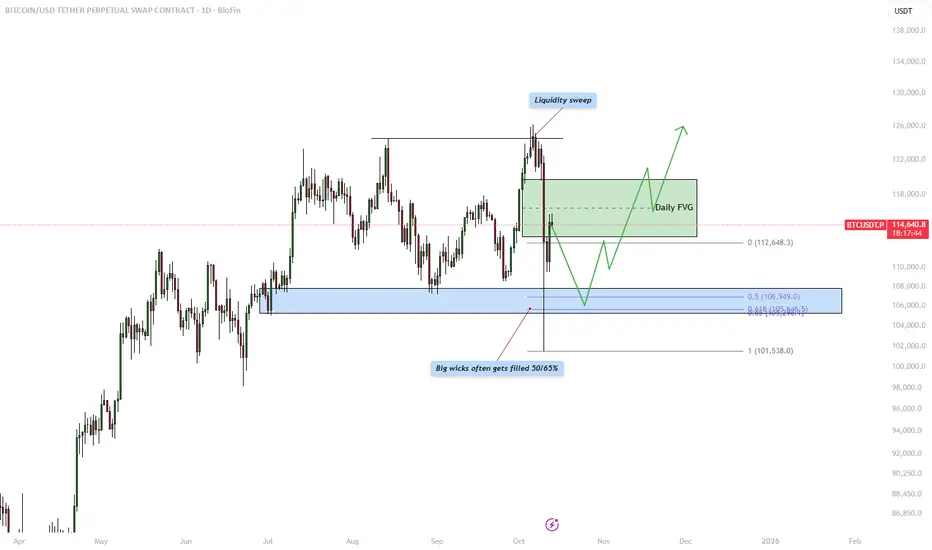
This analysis examines the recent price behavior of Bitcoin against USDT on the daily timeframe. The chart highlights several key technical concepts, including a liquidity sweep at the highs, a daily Fair Value Gap (FVG) acting as resistance, and the likelihood of a wick fill within a major imbalance zone. Together, these elements provide valuable insight into how institutional traders may be engineering liquidity and preparing for the next significant move. Understanding these areas can help traders anticipate high-probability reaction zones and better align with the market’s underlying structure.
Liquidity sweep
The market recently executed a liquidity sweep above previous swing highs, triggering buy stops and attracting breakout traders into the move. This sudden push to the upside was quickly rejected, signaling that smart money likely used this moment to gather liquidity and distribute positions. Liquidity sweeps often serve as the market’s way of collecting orders before a reversal or retracement, indicating that the bullish momentum may be temporarily exhausted. This event sets the stage for price to rebalance inefficiencies left behind during the rapid move.
Daily FVG resistance
Following the liquidity sweep, price left behind a clear daily Fair Value Gap, which represents an area of imbalance caused by strong displacement. This gap often acts as resistance, where price is expected to return and mitigate before potentially continuing lower. The FVG provides an ideal area for institutional traders to reposition, as it offers a point of confluence between inefficiency and structure. If price reacts bearishly within this zone, it would strengthen the bearish outlook and suggest a continuation toward lower levels.
Wick fill
The large wick seen during the recent sell-off is an important feature of this chart. Historically, big wicks tend to get filled by 50% to 65%, reflecting the market’s tendency to rebalance inefficiencies over time. The marked blue zone below shows where this fill is most likely to occur. This zone aligns closely with previous support levels and Fibonacci retracement levels, further reinforcing it as a potential area of interest. A wick fill into this region could provide liquidity for future bullish movement, allowing the market to establish a more solid foundation for the next impulsive leg upward.
Conclusion
In summary, the current daily structure of Bitcoin suggests that price has completed a liquidity sweep at the highs and is now in the process of rebalancing inefficiencies through a possible retracement. The daily Fair Value Gap above serves as a critical resistance zone where sellers may re-enter, while the wick fill area below marks a high-probability target for price to revisit before establishing new direction. Traders should monitor how price reacts to these two regions, a rejection from the FVG coupled with a move toward the wick fill zone could signal the next significant swing opportunity. In this environment, patience and precision are key, as the market seeks equilibrium before its next major directional move.
-------------------------
Thanks for your support. If you enjoyed this analysis, make sure to follow me so you don't miss the next one. And if you found it helpful, feel free to drop a like 👍 and leave a comment 💬, I’d love to hear your thoughts!
EURCAD| Bullish Intent LoadingPair: EUR/CAD
Bias: Bullish
HTF Overview:
Higher timeframe shows strong bullish momentum, breaking significant highs with structure clearly favoring continuation. Price remains aligned with smart money’s directional bias.
MTF Insight:
Price retraced into discounted areas, fully aligned with HTF bullish intent. Sell-side liquidity (SSL) has been swept, and price is now resting within the refined order block — setting up for the next bullish leg.
LTF Confirmation:
Lower timeframe shows a breached lower high, now running toward higher highs. Once a clean microstructure setup forms, buy positions can be considered in line with the bullish continuation.
Entry Zone:
Refined OB in discounted area post-liquidity sweep — awaiting LTF confirmation.
Targets:
Recent highs and unmitigated HTF supply zones.
Mindset Note:
Patience and precision are key — let smart money dictate timing, and the next bullish push will follow the structure naturally. 🚀

GBPAUD| Bearish Intent LoadingPair: GBP/AUD
Bias: Bearish
HTF Overview:
Higher timeframe shows strong bearish pressure, with structure trending down and premium levels intact. Smart money remains in control, steering the market toward continuation.
MTF Insight:
Mid timeframe confirms that buy-side liquidity has been swept, aligning with the higher timeframe bearish narrative. Price structure has been refined, offering extra confluence for potential continuation.
LTF Confirmation:
Looking for lower timeframe shift — CHoCH or break of a micro higher low — before committing to short entries and letting the next leg unfold.
Entry Zone:
Premium area post-liquidity sweep, waiting for precise LTF validation.
Targets:
Key recent lows and unmitigated HTF demand zones.
Mindset Note:
Stay patient and let smart money dictate. Timing is everything — once LTF confirms, the next bearish leg will flow naturally. 🚀

EUR & AUD| Bearish intent LoadingPairs: EUR, AUD
Bias: Bearish
HTF Overview:
Higher timeframes are showing bearish intent, with price structure favoring downside continuation. Premium areas are intact, and smart money is clearly steering the directional bias.
MTF Insight:
Mid timeframe shows buy-side liquidity has been swept, fully aligning with higher timeframe bearish context. Structure has been refined, and we are currently sitting in premium — extra confluence for potential continuation setups.
LTF Confirmation:
Waiting for lower timeframe shift — CHoCH or break of a micro higher low — to confirm short entries and continuation of the drop.
Entry Zone:
Premium area post-buy-side liquidity sweep, waiting for LTF validation.
Targets:
Recent lows and unmitigated HTF demand zones.
Mindset Note:
Let smart money lead. Patience and proper timing are key — once the LTF confirms, the bearish leg will follow the structure naturally. 🚀

GBP| Bullish Intent LoadingPair: GBPJPY
Bias: Bullish
HTF Overview:
Higher timeframe continues to show bullish intent, breaking significant highs and putting in a major high. Structure favors continuation, but the current order block isn’t in an ideal HTF area for strong respect. Smart money still controls directional bias, but patience is required.
MTF Insight:
On the mid timeframe, price has jumped higher and decisional and extreme order blocks have been refined. I’m watching the key OB, but truthfully, I don’t expect it to hold fully. Lower timeframe testing will reveal whether smart money chooses to defend it.
LTF Confirmation:
Once lower timeframe confirms via CHoCH or micro lower high break, I’ll engage precision entries aligned with the bullish leg.
Entry Zone:
Refined mid timeframe OB — waiting for price to rest and mitigation to occur.
Targets:
Above recent highs and unmitigated high timeframe supply zones.
Mindset Note:
Let smart money dictate the pace. Patience is key — the bullish continuation will reveal itself once mitigation completes. Stay disciplined, let the market tell its story. 🚀

EURJPY | Bullish Intent LoadingPair: EURJPY
Bias: Bullish
HTF Overview:
Higher timeframe continues to show strong bullish intent, maintaining premium delivery with structure favoring continuation. Institutional order flow still supports upside expansion, confirming smart money’s control over directional bias.
MTF Insight:
Price is currently dropping toward discounted areas — aligning with the higher timeframe bullish narrative. After a clean sweep of sell-side liquidity (SSL), I’m now waiting for price to reach and rest within the refined OB zone. That mitigation will complete the rebalancing needed before continuation setups form.
LTF Confirmation:
Once price taps into that OB and confirms a CHoCH or break of a micro lower high, I’ll look to engage precision entries within the bullish leg for continuation.
Entry Zone:
Discounted OB zone post-liquidity sweep — awaiting mitigation and structure shift.
Targets:
Liquidity above recent highs and unmitigated 4H supply zones.
Mindset Note:
Let smart money handle the delivery. Timing is everything — once mitigation completes, the next bullish leg will be written in the structure. Let’s go. 🚀

EURGBP| Smart Money Cooling Before the Next WavePair: EURGBP
Bias: Bullish
HTF Overview:
Price continues to show bullish intent on the higher timeframe, maintaining structure and building pressure toward premium levels. Institutional momentum remains clear, with each retracement respecting demand.
MTF Insight:
Sell-side liquidity has been taken cleanly, and price has reacted from a solid order block area. Since that mitigation, lower timeframes have been showing consistent bullish continuation structure — each leg printing in green as order flow holds steady.
LTF Confirmation:
Currently watching an internal order block forming within the active bullish leg. Once price taps and mitigates that refined zone, I’ll expect continuation toward higher liquidity targets. Timing and patience are key — we’re minutes away from potential confirmation.
Entry Zone:
Internal OB inside the current bullish leg, awaiting refined 5M CHoCH for confirmation.
Targets:
Liquidity above the recent structural high.
Mindset Note:
No need to rush — the setup’s already written. Let smart money handle the delivery. Until then, we chill and observe precision. 💎

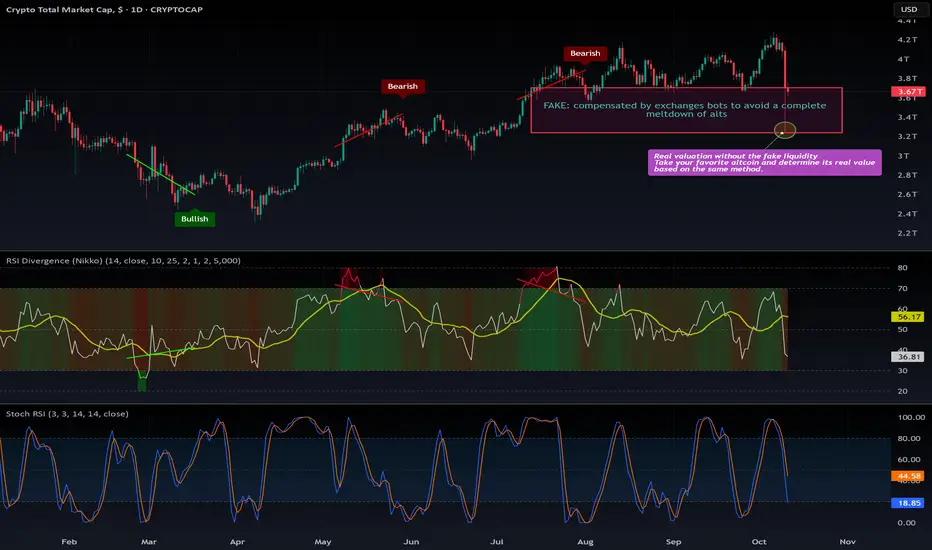
Crypto has a problem: Oct 11 crash and consequencesYes, we have a serious problem that no one really explained — so here I am, debunking this Crash and its consequences.
The entire crypto market is built on fake valuations, not backed by real money. Most of the trading volume you see is manufactured internally by centralized exchanges (CEX) to simulate healthy activity — while in reality, there are very few genuine transactions.
That’s why exchanges are constantly seeking liquidity — because trading fees alone can’t sustain their business.
On October 11th, 2025, crypto had its own dot-com moment. While Bitcoin and Ethereum survived thanks to real liquidity that could absorb the sell-off, the altcoin market collapsed.
There was simply more leverage than liquidity — meaning exchanges were offering leverage they couldn’t actually back with real funds.
So when the market crashed, there were no real buyers. Liquidity pools were wiped out, and coins like CRYPTOCAP:SUI or NASDAQ:ATOM revealed just how fake their markets were.
Did you see anyone buying the dip at -80% on spot? Of course not — because it wasn’t even possible.
Binance and other exchanges froze accounts to prevent users from scooping up altcoins at near-zero prices.
Think the exchanges made millions buying the dip? Wrong. They simply rewrote the database to avoid a catastrophic event that would’ve sent 99% of altcoins to zero.
They “purchased” the dip without spending a single dollar — just digital manipulation to preserve the illusion of value.
The truth: the entire altcoin market is propped up by fake liquidity.
Their “real” value is what you saw at the bottom of October 11th — that was the true market price, without artificial support.
Now the big question:
Can exchanges keep faking volume and valuations forever?
Or will they finally let the market crash to its real worth?
Right now, you can bet there are emergency meetings between exchanges and market makers, deciding whether to come clean or continue the illusion.
Look at the bottom price of each coin on October 11th — that’s what it’s truly worth.
Everything above that is fake inflation, fake volume, and fake confidence.
If you still have unrealized profits, take them. Turn them into real money before they vanish.
Then invest knowingly.
DYOR.
#CryptoCrash #Binance #Bitcoin #Altcoins #CryptoNews #MarketManipulation #LeverageTrading #CEX #FakeVolume #LiquidityCrisis #CryptoTruth #BTC #ETH #SUI #ATOM #DYOR #CryptoScam #TradingAlert #WallStreet #CryptoCollapse #vCrash2025 #CryptoMarket
USDCAD | Bullish Continuation Awaits Smart Money ConfirmationPair: USDCAD
Bias: Bullish
HTF Overview:
Higher timeframe remains decisively bullish, with structure continuing to break significant highs. The overall momentum still supports upside delivery, showing smart money maintaining control of the directional flow.
MTF Insight:
Currently waiting for sell-side liquidity to be taken before looking for fresh long opportunities. Price has a decisional and an extreme order block marked — ideal zones for potential mitigations once liquidity is swept. These areas will serve as key points of interest for the next phase of continuation.
LTF Confirmation:
After liquidity is cleared and price falls into one of the OB zones, I’ll be watching for a lower timeframe change of character. Once the lower high is breached, I’ll refine entry within that bullish leg for precision buys.
Entry Zone:
Decisional → Extreme OB range after liquidity sweep.
Targets:
Liquidity above recent highs aligning with the higher timeframe continuation move.
Mindset Note:
Patience until mitigation. Let smart money lead direction — the best trades come when timing and structure are in full alignment.

USDJPY| Let Smart Money LeadPair: USDJPY
Bias: Bullish
HTF Overview:
Higher timeframe structure remains firmly bullish, with price continuing to break significant highs. Momentum reflects institutional strength, suggesting smart money is still favoring upside delivery.
MTF Insight:
Currently seeking a healthy pullback to rebalance structure and take out sell-side liquidity. Eyes are on the mid-timeframe order blocks — specifically the decisional or extreme zones — for potential mitigation and continuation setups.
LTF Confirmation:
Once price taps into a refined OB within those zones, I’ll wait for a lower timeframe CHoCH to confirm the handover back to buyers before initiating long exposure.
Entry Zone:
Discounted OBs inside the MTF mitigation area (decisional → extreme).
Targets:
Liquidity above recent swing highs — continuation toward unmitigated 4H supply.
Mindset Note:
Discipline over prediction — let smart money dictate direction. The market always reveals its hand after liquidity has been swept.

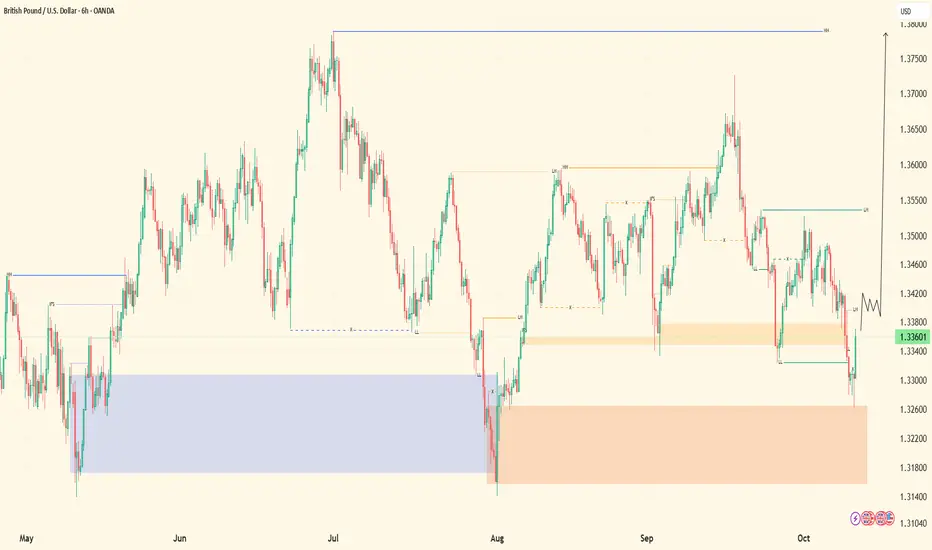
GBPUSD| Structure in Sync with Smart Money FlowPair: GBPUSD
Bias: Bullish
HTF Overview:
Price continues to display strength, breaking through significant highs and sustaining bullish momentum. We’ve recently tapped into a major high timeframe order block — a key zone where smart money tends to position continuation legs.
MTF Insight:
From that HTF OB, we witnessed a clear change of character (CH) followed by a break of meaningful highs. Price has since retraced into discounted territory, mitigating lower OBs that align with the internal structure and continuation narrative.
LTF Confirmation:
A fresh lower timeframe CH is developing. Once that CH is confirmed and order flow aligns, I’ll be anticipating a clean pullback entry within the bullish leg for continuation toward higher liquidity zones.
Entry Zone:
Discounted OBs within the current structure range — awaiting refined 5M confirmation for execution.
Targets:
Liquidity above recent swing highs.
Mindset Note:
Patience is key here. Let structure finalize the CH and confirm alignment across timeframes before pressing the buy trigger. Smart money rewards timing, not haste.
EURUSD| Smart Money Holding Zone Pair: EURUSD
Bias: Bullish
HTF Overview:
Price remains in an established uptrend phase, pushing toward prior highs with strong momentum. The broader structure continues to favor premium delivery, confirming that buyers still maintain control of the macro flow.
MTF Insight:
Price cleared SSL liquidity, then retraced into discounted regions—mitigating a refined internal structure OB before extending deeper into a major structural liquidity pocket. The reaction from this stronger mitigation zone suggests smart money may defend this territory as a new leg begins to form.
LTF Confirmation:
Waiting for a clean CHoCH and break of the micro lower high to confirm order flow shift. Once structure aligns, I’ll be looking for a pullback on the bullish leg to engage long positions with precision.
Entry Zone:
Monitoring refined OB within the discounted range—waiting for confirmation before execution.
Targets:
Liquidity resting above recent 4H highs.
Mindset Note:
Patience pays—let smart money show its hand before reacting. The strongest trades always unfold after structure speaks.

When Liquidity Dried Up — The True Story Behind the Oct 10 Crash█ We Actually Saw It Coming
There were clear signs of potential reversals across major markets before the Friday, October 10, 2025 crash. You can see it in the liquidity heatmaps: Gold, Bitcoin, S&P, and other futures all trading above their top 10 liquidity levels.
When that happens, it’s usually a warning flag. Price is moving into areas with less visible liquidity, meaning fewer resting orders available to absorb aggressive buyers. That’s when the market becomes fragile and doesn’t take much to trigger a sharp reversal.
█ When Price Trades Beyond Visible Liquidity
It’s easy to think big moves happen just because of news, but beneath the surface, microstructure signals often show when markets are already vulnerable.
One of the clearest is when the mid-price extends beyond the visible liquidity, above the top few ask levels or below the top few bid levels in the order book.
Suppose price pushes beyond the visible top levels. In that case, it often means that liquidity was consumed faster than it could replenish, either because aggressive orders cleared it out, or market makers pulled their quotes. That’s when we get what’s called a liquidity vacuum.
Research from the Federal Reserve, Bank for International Settlements, and academic studies (Lo & Hall, 2014; Meldrum & Sokolinskiy, 2025) all point to the same thing:
When order book depth is shallow, markets become more fragile. Prices overreact, spreads widen, and shocks travel faster.
█ What the Heatmap Really Shows
Those heatmaps are a visual snapshot of this structure.
The green and red bands show the depth of buy and sell orders — the liquidity zones.
The blue line is the mid-price — the true current market price.
When the blue line (mid-price) moves above the red zone, it means price has traded beyond the top available asks. That can happen because:
Buyers lifted all nearby sell orders (aggressive buying), or
Sellers pulled liquidity (passive withdrawal).
In both cases, the effect is the same, the book thins out, and volatility risk increases.
Heatmaps don’t show everything though. They don’t reveal:
Hidden or iceberg orders deeper in the book,
Off-exchange liquidity or block trades,
Or how quickly the book replenishes in real time.
But as a visual proxy, they’re incredibly useful for spotting moments when price runs ahead of available liquidity, often right before sharp reversals.
█ Why the Crash Hit So Hard
So while the crash came from unexpected news, the speed of that drop wasn’t random. Markets were already fragile. Liquidity across assets was thin. When the shock hit, there weren’t enough resting orders to slow it down.
Gold, Bitcoin, and S&P futures all had their mid-prices trading above visible liquidity, making them more sensitive to aggressive selling; that’s why the market fell almost simultaneously and so fast.
█ How I Handle These Setups
Whenever I see price trading above visible liquidity, I start managing risk differently. I might keep existing longs, but I won’t add new ones. Instead, I scale out gradually and watch for potential short setups if other signals confirm it.
It’s not about predicting crashes, it’s about recognizing when the market’s structure is fragile.
█ Quick Takeaway
When the mid-price trades above visible liquidity, the order book is telling you something simple but powerful:
“There’s not much support up here.”
That’s often when it pays to get defensive, not aggressive.
Access the CME Liquidity tool at this link
-----------------
Disclaimer
The content provided in my scripts, indicators, ideas, algorithms, and systems is for educational and informational purposes only. It does not constitute financial advice, investment recommendations, or a solicitation to buy or sell any financial instruments. I will not accept liability for any loss or damage, including without limitation any loss of profit, which may arise directly or indirectly from the use of or reliance on such information.
All investments involve risk, and the past performance of a security, industry, sector, market, financial product, trading strategy, backtest, or individual's trading does not guarantee future results or returns. Investors are fully responsible for any investment decisions they make. Such decisions should be based solely on an evaluation of their financial circumstances, investment objectives, risk tolerance, and liquidity needs.
EUR/USD – Bearish Continuation in MotionEUR/USD continues to display a bearish market structure, reflecting persistent downside pressure as the euro struggles to maintain stability against the U.S. dollar. Recent price action shows a period of consolidation followed by a liquidity grab near short-term highs, indicating that buyers are losing strength and the market is positioning for a potential continuation of the decline. The broader market tone suggests that sentiment remains cautious, with traders favoring the dollar due to its resilience amid global uncertainty and steady U.S. economic performance. The pair’s inability to establish higher highs further confirms weakness in bullish momentum. This behavior often signals distribution, where institutional players offload long positions before another leg downward. Short-term movements could still present small corrective bounces as the market seeks liquidity, but overall conditions favor sellers. Unless a strong shift in macro sentiment occurs, EUR/USD is likely to maintain its downward trajectory, targeting lower levels as the bearish momentum unfolds and traders continue aligning with dollar strength.

ETHUSDT 1H - Key Liquidity Zones & Bullish Reversal Potential ETHUSDT 1H Analysis: Price is reacting from a critical support zone between the Fib 0.5 - 0.618 retracement and previous day low, both marked as high-liquidity areas. If current support holds, expect a potential bounce targeting the previous day’s high ($4,530.80), with further upside toward the buy side liquidity at $4,748.04. Watch for confirmation in the highlighted demand zone for low-risk long setups. A break below $4,143.60 would invalidate this scenario and shift focus to lower sell side liquidity.”
This chart setup is useful for traders seeking possible long opportunities, with clearly defined risk and upside targets.

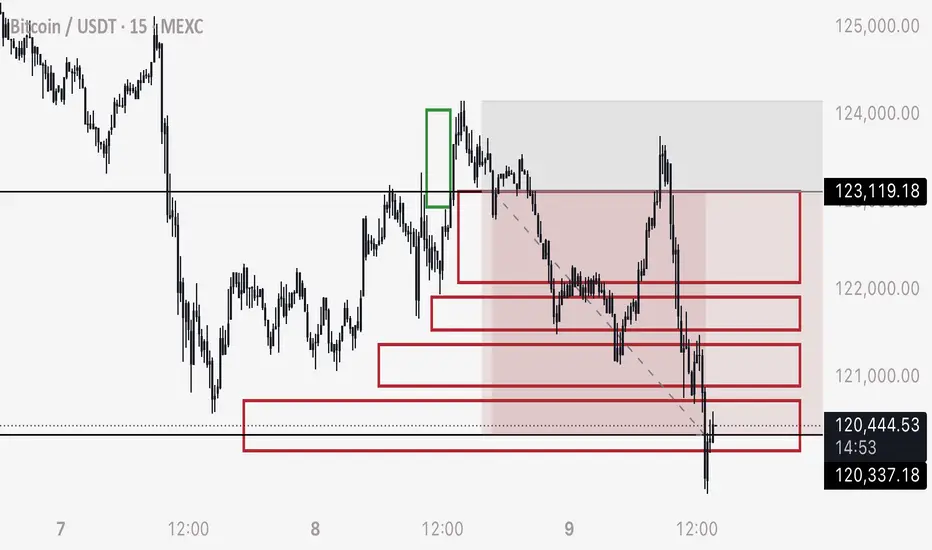
BTCUSD – Key Decision Zone Forming Between 121.7K–122.3K | Bitcoin is currently retesting a key supply zone around 121.7K–122.3K, aligning with previous structure highs and imbalance.
This zone will likely determine the next major intraday move.
Market Outlook:
📊 Previous Day High: 123,841 – acts as upside liquidity target
🟨 Key Zone: 121.7K–122.3K (potential reaction area)
🧠 Scenarios:
Bullish: Clean break + retest above 122.3K → targets 123.8K
Bearish: Rejection from the zone → move back to 119.7K (previous day low)
⚖️ Bias: Neutral until breakout confirmation
Smart traders will wait for a liquidity sweep + confirmation candle before committing. Stay patient — volatility incoming.

XAUUSD - Bullish Reversal Zone Forming Near 3945 | SMCGold (XAUUSD) is showing potential bullish signs after reacting from the previous day’s low at 3945.
Price tapped into the Fibonacci 0.5–0.618 retracement zone, aligning perfectly with demand imbalance on the 15-min timeframe.
Key Insights:
📉 Previous Day Low: 3945 acts as liquidity grab zone
🟨 Fib Confluence: 0.5–0.618 golden pocket
🔄 Expectation: Possible pullback → higher low → push toward 3990–4020
📈 Bullish confirmation above 3980
🚫 Invalid below 3940 (clean break of structure)
This setup aligns with Smart Money Concepts (SMC) — expecting a liquidity sweep + market structure shift before continuation.

Nzd/Usd - Bullish Reversal After Liquidity SweepLiquidity Sweep observed below the recent weak low, indicating a potential stop-hunt and smart money accumulation.
Break of Structure (BOS) and multiple Change of Character (CHoCH) signals suggest a shift from bearish to bullish market structure.
Price has shown a bullish CHoCH after the liquidity sweep, aligning with a potential trend reversal.
Entry:
Entry Zone: ~0.57462 (Marked with blue arrow)
Price has just broken above the minor range high, confirming bullish intent.
Targets:
TP1: ~0.57790 – Aligns with the nearest resistance zone.
TP2: ~0.58090 – Retest of a strong high and major resistance zone.
Stop Loss Suggestion:
Below the swept liquidity low, ideally under 0.57300 (weak low), to protect against a deeper pullback.
Key Concepts Highlighted:
CHoCH (Change of Character) – Shift from bearish to bullish trend.
BOS (Break of Structure) – Confirmation of direction change.
Liquidity Sweep – Possible smart money move to trap sellers.
Resistance Zones – Marked areas for potential profit-taking.
Bullish Bias Justification:
Price action has swept liquidity, formed a higher low, and broken previous lower highs.
CHoCH confirms shift in momentum; likely targets are previous supply zones (TP1 & TP2).
Favoring long setups while structure remains bullish above weak low.

Result - Using Order Blocks to Predict Bitcoins MovementHere is the result from our first practical demonstration of the effectiveness of using order blocks (stop loss orders) and liquidity analysis to predict price movement on BTC.
Both the upwards movement and downward moment was able to be predicted with absolute accuracy.
I hope this result serves as proof for my thesis:
What moves Bitcoin is Stop Loss and Liquidation orders, which can be analyzed by looking back at open candles and length of consolidation to predict speed.
And
There is no market manipulation other than price being CONTROLLED to attract positions to be opened and consequently stop loss orders. Fast, sudden movements are a natural phenomenon caused by traders stop losses triggering into one another. Traders manipulate themselves.
I have applied this to two more examples on the higher time frames. And as those complete they will be reviewed.
PLEASE SEE ORIGINAL IDEA LINKED BELOW AS WELL AS OTHER PLANS AND IDEAS RELATED.
Any questions please comment below.