GBP/JPY - Bullish 2H OB Play | 5M CHoch Reaction Setup
Pair: GBP/JPY
Bias: Bullish
Timeframes: 2H → 5M
⸻
HTF Overview
Higher timeframe broke previous major highs, showing clear bullish intent and continuation flow.
Smart money has confirmed direction to the upside — now we’re aligned with the institutional leg. ⚙️
⸻
MTF Structure
Refined structure mapped out with precision.
Spotted the courtyard buildup forming before the drop into my 2H order block — a clean delivery confirming controlled mitigation.
Momentum aligns perfectly with higher timeframe intent.
⸻
LTF Execution
On lower timeframes, we’ve already printed a clean CHoCH, signaling early reversal confirmation.
Now I’m patiently watching for a sell-side liquidity sweep (SSL) to mitigate the bullish block, opening long positions within that bullish leg.
Execution will depend on reaction strength and order block respect. 🎯
⸻
Mindset Note:
Don’t rush the entry. The deeper the sweep, the stronger the move.
Precision + patience = premium entry. 📦
Liquidity

EUR/USD - Bullish 2H OB Reaction | 5M continuation SetupPair: EUR/USD
Bias: Bullish
Timeframes: 2H → 5M
⸻
HTF Overview
Higher-timeframe structure remains bullish, with major highs recently broken — confirming continuation flow.
Price has now mitigated our 2H order block, aligning with overall bullish intent. From here, I’m looking for further upside continuation toward next liquidity highs.
⸻
MTF Perspective
On the mid-timeframes, price tapped directly into our OB zone and instantly showed strong bullish momentum, signaling institutional interest.
Now it’s about staying patient and letting price dictate whether we’ll get a clean retest or a deeper mitigation before expansion.
⸻
LTF Execution Plan
On the lower timeframe, recent internal structure has already been mitigated — price may look to retest that same level or sweep slightly lower before taking off.
Either scenario, I’m focused on targeting 5M highs and 2H continuation zones depending on market delivery.
⸻
Mindset Note:
Don’t overthink the pullbacks — once HTF alignment and mitigation are confirmed, trust the process and execute smoothly. Reaction confirms direction; mitigation defines precision.

$BTC Bearish Divergence Signals Possible Correction Toward 118KBitcoin on the 4-hour chart is flashing a clear bearish divergence — while price is forming a higher high, RSI is slipping into a lower high. 📉
This setup often hints at an upcoming correction phase. Based on the current market structure, 118K appears to be a strong liquidity gap area where a short-term bounce or lower high could form.
However, if BTC loses its footing below 107K, that’s where the real bearish confirmation kicks in. Until then, the 107K support remains the key battleground for bulls to defend. ⚔️
Volume analysis also supports the correction narrative — buying pressure is fading while selling momentum is picking up. Stay alert for a possible test near 118K before the next major move.
#Bitcoin #BTCAnalysis

Cable$FibreIn the past few days we've seen a bearish momentum on cable and fibre. This is my opinion will continue to be the case in he coming weeks. This week however, the market is retracing, to take out those who're currently profitable. The first week of the month is relatively unpredictable so I'd advice you to sit back and relax, unless you know what you're doing. From next week, I expect to see price resume its bearish stance.

BTC — Sunday Liquidity TrapAfter hitting the BIG resistance at $117,896 (0.618 Fib retracement), BTC rejected as anticipated and started its current downtrend. The anchored VWAP from the $117.9K high has been an excellent guide, acting as resistance → most recently at $113,800, where it provided a clean short entry.
Over the weekend, BTC has traded sideways. We just saw a small pump to clear the range highs and take out buy-side liquidity, a common setup before markets rotate lower to sweep sell-side liquidity.
Key Confluence Zone
The next level of interest sits around $108,250, where multiple factors align:
Monthly Open: $108,246.36
Daily Level: $108,246.35
0.618 Fib Retracement: $108,236.67
Liquidity cluster with many stop-losses residing here
If this zone fails to hold, the next downside interest lies at:
Key Low: $107,255 → possible SFP area
0.666 Fib Retracement: $106,975.52 → additional support
🟢 Long Trade Setup
Entry: Long around $108,250 (mOpen confluence zone)
Stop-Loss: Below 0.666 Fib retracement (~$106,975)
Take Profit: TP1 → $111K, if volume expands → trail stop for higher targets
R:R: ~1:2
Market Insight
Sunday pumps are notoriously unreliable, often designed to trap traders into late longs before a pullback wipes them out. This setup reflects exactly that dynamic.
Indicators used
DriftLine — Pivot Open Zones → For identifying key yearly/monthly/weekly/daily opens that act as major S/R reference points
➡️ Available for free. You can find it on my profile under “Scripts” and apply it directly to your charts for extra confluence when planning your trades.
_________________________________
💬 If you found this helpful, drop a like and comment!

US30 -Bullish Bias🔹 Pair: US30
🔹 HTF Overview: Structure bullish; market momentum favors the upside.
🔹 MTF Outlook: Waiting for a deep sweep of stop-losses (SSL) to refine continuation setup.
🔹 LTF Setup: Once SSL is taken, drop to lower timeframe for CHoCH confirmation and precise entries.
🔹 Targets: Mid- to long-term highs, aligned with bullish structure and liquidity zones.
🔹 Mindset Note: Patience is key—let smart money lead before committing.

EURJPY - Bullish Bias🔹 Pair: EURJPY
🔹 HTF Overview: Price structure bullish, though prints not perfectly clean. Monitoring carefully.
🔹 MTF Outlook: Waiting for sweep of stop-losses (SSL) into the midterm OB area to refine continuation setup.
🔹 LTF Setup: Once MTF sweep occurs, will drop to lower timeframe for proper alignment and entries.
🔹 Targets: Midterm liquidity pools and highs above recent structure.
🔹 Mindset Note: Patience is critical—wait for smart money confirmation before committing.

GBPJPY - Bullish Bias🔹 Pair: GBPJPY
🔹 HTF Overview: Price has been respecting structure cleanly across all timeframes. Bullish bias intact.
🔹 MTF Outlook: Continuation plays forming toward midterm highs. Momentum aligned with HTF structure.
🔹 LTF Setup: Watching for lower-timeframe alignment to refine entries in line with continuation moves.
🔹 Targets: Midterm highs and liquidity above recent structure.
🔹 Mindset Note: Let structure and smart money lead—patience ensures optimal entries.

NZDUSD - Bearish Bias
🔹 Pair: NZDUSD
🔹 HTF Overview: Price showing bearish intent, respecting higher-timeframe structure.
🔹 MTF Outlook: Waiting for a sweep of liquidity in the midterm OB. This will highlight smart money interest and refine continuation.
🔹 LTF Setup: Once the sweep occurs, I’ll drop to the lower timeframe to refine entries into premium OB areas for optimal short positions.
🔹 Targets: Higher liquidity zones aligned with bearish momentum.
🔹 Mindset Note: Patience is key—let smart money guide before taking the trade.

AUDUSD - Bullish Bias
🔹 Pair: AUDUSD
🔹 HTF Overview: Price respected higher-timeframe bullish structure and swept past the MTF OB with momentum.
🔹 MTF Outlook: Mitigation occurred in the deeper hidden anchor OB. Waiting for a clean midterm CHoCH to confirm continuation.
🔹 LTF Setup: Once the MTF CHoCH prints, I’ll drop to the lower timeframe to refine entries and align with discounted areas.
🔹 Targets: Higher liquidity points above recent structure in line with bullish bias.
🔹 Mindset Note: Patience and alignment across timeframes remains the edge.

BTCUSD - Bullish Bias🔹 Pair: Bitcoin (BTCUSD)
🔹 HTF Overview: Price remains strong and bullish, respecting higher-timeframe structure with clear upward momentum.
🔹 MTF Outlook: Waiting for midterm alignment—once a lower-high (LH) breach occurs, we’ll position for continuation with fresh OB areas.
🔹 LTF Setup: Currently in a deep anchor OB. Waiting for the hold and CHoCH switch before committing to long entries.
🔹 Targets: Higher liquidity zones above recent highs, aligned with bullish intent.
🔹 Mindset Note: Let smart money lead—patience ensures optimal timing and execution.

XAUUSD - Bullish Bias🔹 Pair: Gold (XAUUSD)
🔹 HTF Overview: Market structure remains bullish, with strong upside intent still intact.
🔹 MTF Outlook: Waiting for price to sweep short-term sell-side liquidity and mitigate the deeper OB below—this will refine the continuation play.
🔹 LTF Setup: Once MTF objectives are cleared, I’ll align with CHoCH and fresh OB prints on the lower timeframe to position long.
🔹 Targets: Eyes remain on higher liquidity pools in line with bullish market rhythm.
🔹 Mindset Note: Timing is everything—patience until MTF and LTF structure align.

UJ - Bullish Bias🔹 Pair: USDJPY
🔹 HTF Overview: Bullish structure well respected, with clean momentum driving price higher.
🔹 MTF Confirmation: Price mitigated our midterm OB, held firmly, and validated the continuation longs we’ve been anticipating.
🔹 LTF Setup: Bullish setups already played out—now waiting for fresh alignments and new mitigations to position for the next leg.
🔹 Targets: Eyes on mid- to long-term highs as liquidity magnets in line with bullish intent.
🔹 Mindset Note: Patience sharpens precision—let the market confirm before engaging.

GU - Bullish Bias🔹 Pair: GBPUSD
🔹 HTF Overview: Price swept liquidity, then respected a higher-timeframe order block. Momentum shifted bullish with a steady rhythm.
🔹 MTF Confirmation: Initial OB mitigation failed cleanly, but price tapped deeper into hidden anchor OBs. From here, expecting smart money to defend and guide the move higher.
🔹 LTF Setup: Waiting for a CHoCH and a fresh OB print. Once midterm structure aligns, I’ll refine entries from the LTF.
🔹 Targets: Higher liquidity pools above recent highs in line with bullish HTF intent.
🔹 Mindset Note: Patience is the real entry—let smart money confirm before committing.

EU - Bullish Bias🔹 Pair: EURUSD
🔹 HTF Overview: Major higher-high order block respected cleanly. Strong bullish intent and volume confirmed; market structure favors upside continuation.
🔹 MTF Confirmation: Original OB failed, but price tapped deeper into the hidden anchor block. Expecting this zone to act as the true smart money foundation.
🔹 LTF Setup: Waiting for a CHoCH and lower-high break. After that, I’ll target a pullback below 50% equilibrium into discounted areas for long entries.
🔹 Targets: Continuation toward higher-timeframe liquidity above recent highs.
🔹 Mindset Note: Patience is the edge. Smart money confirms before committing.

Bitcoin Liquidity GrabBitcoin came back into discount pricing (between the swing low and swing high), and it looks like it is still waiting for the next catalyst for the next leg up.
We are currently still in the weekly imbalance, which a lot of times will act as a demand zone. Before we can take a long position, we need to clear the "bump in the road" — or in this case, liquidity.
I will wait for price to take out the liquidity under the equal lows around 107.2k, and then I’ll wait for a CHoCH on the 1H–4H before looking for a long trade.
Happy trading,

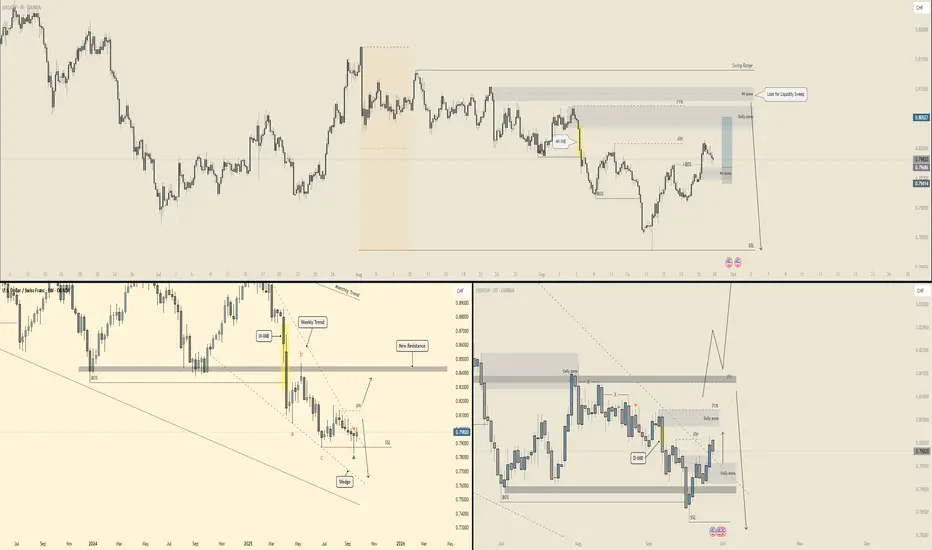
USD/CHF - Multi Timeframe Analysis (Trade setup)📉 USD/CHF – Forecast Breakdown 📉
Time to dissect this one across the charts 👇
🕰 Weekly View
The weekly chart is still in a bearish trend. Price rejected from the monthly/weekly trendline and printed a clean lower-high setup. Structure suggests continuation down unless buyers can flip resistance near 0.83. For now → bias leans bearish, with space to revisit 0.76–0.75 demand.
📅 Daily Structure
Daily shows a swing range with:
BOS south ✅
Liquidity sweep below SSL (sell-side liquidity)
Market retracing toward 0.805–0.81 (daily + 71% zone)
This looks like a setup for a liquidity grab into premium pricing before sellers potentially take control again. The daily zone at 0.805–0.81 is the hot spot to watch for bearish reactions.
⏱ 4H Breakdown
On the 4H:
Price already made a BOS down, confirming short-term bearishness.
Currently pushing back into a 4H + daily supply overlap (0.805–0.81).
Ideal scenario → a sweep of that zone before the next bearish leg, targeting 0.79 → 0.785.
🎯 Summary
Weekly : Bearish, trend pointing lower 📉
Daily : Retrace likely into 0.805–0.81 before rejection ⚔️
4H : Watching for liquidity sweep + reversal confirmation 👀
Bias → Bearish, unless bulls flip above 0.815. Short opportunities favored around the supply zone, targeting 0.79 → 0.785, with deeper extension possible toward 0.76 if momentum holds.
⚠️ Risk note: USD/CHF can grind slowly — patience is key; avoid chasing entries.
USD/JPY - Multi Timeframe analysis🚀 USD/JPY – Forecast Breakdown 🚀
Let’s cook this pair up across the timeframes 👇
🕰 Weekly View
Price has been battling along that weekly liquidity trendline. After months of chop, buyers finally punched through the consolidation zone and are now aiming higher. Big picture → the path of least resistance points north toward the 152–154 zone. But, keep in mind, weekly still has major resistance around 150 lurking.
📅 Daily Structure
Daily chart shows a clean BOS after running stops. Price cleared liquidity above 149, tapped into the daily imbalance, and is reacting nicely. If bulls keep control, momentum could carry us toward 151. But if daily sellers defend that major resistance, we could see a dip back to 148 (daily demand).
⏱ 4H Breakdown
On the 4H:
Fresh BOS + 71% fib reaction 🔥
Price grabbed liquidity below before rocketing higher.
Market is now stalling under 149.5 – 150 major resistance.
Short-term scenario: Possible pullback into 148.3 – 148.5 (4H demand) before another leg up. If that zone holds, bulls likely reload and push us toward 151+.
🎯 Summary
Weekly : Breaking higher, aiming for 152–154 🎯
Daily : Strong BOS, but resistance at 150 needs clearing ⚔️
4H : Demand at 148.3–148.5 is the key re-entry zone 🟩
Bias → Bullish overall, with healthy pullbacks likely. Watch 150: break it clean and we’re on rocket mode 🚀; rejection could mean a retest of 148 support.
⚠️ Risk note: USD/JPY is a stop-hunter — mind your entries and size.

GBP/JPY - Multi timeframe Analysis (We are ready to sell off)🔥 GBP/JPY – Forecast Breakdown 🔥
Alright traders, let’s slice this beast up 👇
🕰 Weekly View
We’re chilling right inside that weekly supply zone after sweeping the BSL. Price already showed signs of exhaustion here, and the structure screams: "Yo, we might dip." If sellers hold this fort, the swing could correct toward the mid-190s — right where demand is waiting.
📅 Daily Structure
Daily chart shows price running liquidity above 200/201 and tapping into resistance. BOS candles already printed earlier in the leg up, so this could be the last stop hunt before a deeper pullback. Daily demand sits 197 – 196, prime snack zone 🍫 for buyers to reload.
⏱ 4H Breakdown
On the 4H, we’ve got:
71% fib reaction ✅
BOS and liquidity sweep above 200.5
Market tapping into a 4H supply zone
That’s textbook SMC (smart money concepts) for a reversal play. Expectation? A possible short run back into 198 – 197, lining up with the daily zone.
🎯 Summary
Weekly : Tapped supply, sellers flexing 💪
Daily : Liquidity grab above 200, correction eyed
4H : 71% retrace + supply reaction, bearish pressure building
Bias → Short-term bearish targeting 198 – 197. Watch for rejections at current levels, but if buyers somehow break above 202, then the short idea is invalidated.
⚠️ Risk note: Stay nimble, this pair moves like a rocket 🚀 and can hunt stops fast.

NEAR — Prime Swing Setup at $2.5NEAR is shaping up for a high-probability swing trade, and the chart is lining up beautifully. The $2.5 zone is packed with confluence, making it one of the most attractive long opportunities on NEAR in a while.
Confluence Support Zone
Previous Monthly Open (Key Level): $2.535
0.786 Fib Retracement: $2.506
Liquidity Pocket: Sitting right at this zone
📌 Together, these factors make the $2.53–$2.50 area a critical support level to watch.
🟢 Long Setup
Entry: $2.53–$2.50 zone
Stop-Loss: Below monthly open at $2.366
Target: $4 (major resistance + TP zone)
Potential Gain: ~+50% if played to target
R:R 1:7+
Trade Outlook
If NEAR reacts strongly off the $2.5 zone, this setup could unfold into a powerful swing trade. The structure suggests this could be the launchpad for the next leg higher.
As always, confirmation is key: I’ll be watching closely for a clean reaction before committing fully. Profit-taking decisions will be refined as price action develops, but the $4 level stands out as the main TP zone.
Indicators used
DriftLine — Pivot Open Zones → For identifying key yearly/monthly/weekly/daily opens that act as major S/R reference points
➡️ Available for free. You can find it on my profile under “Scripts” and apply it directly to your charts for extra confluence when planning your trades.
_________________________________
💬 If you found this helpful, drop a like and comment!

GBP/USD - Multi Timeframe Forecast🕰 Weekly View
Weekly is looking toppy near that 1.38–1.39 rejection zone.
Big weekly BOS already in play → momentum pointing down.
Liquidity targets sit way lower at 1.28–1.29 (weekly demand + swing range).
📉 Daily Structure
Daily broke structure → now printing lower highs.
A daily supply zone sits heavy overhead near 1.36–1.37.
If sellers keep pressing, the magnet is clear: 1.30–1.31 daily demand (stacked with fib + HV buy zone).
Any bounces are likely just snack stops for liquidity 🍟 before rolling lower.
⏱ 4H Breakdown
Price is hunting between two short-term options:
1️⃣ Option 1: Tap into the 4H supply around 1.3450–1.3500, reject hard → continuation down.
2️⃣ Option 2: Push a bit higher into the high-volume sell zone at 1.3550–1.3600 → then dump to new lows.
Below, key demand sits at 1.3200 → 1.3000, so that’s the landing pad 🎯.
🎯 Summary
Bias : Bearish until proven otherwise.
Weekly → Failed top, heading toward deeper demand.
Daily → Lower highs into supply, eyes on 1.30.
4H → Watch for rejection at sell zones before shorting.
Big picture → GBP/USD looks like it’s loading up for a multi-week selloff 📉 unless buyers defend hard at 1.32.

EUR/USD - Multi time frame Analysis 🕰 Weekly View
Price recently tapped weekly demand around 1.1600 and reacted strong.
But that wick rejection above 1.1900 screams liquidity sweep 🧹—it failed to hold as a true breakout.
Until we see a clean weekly BOS (Break of Structure) above 1.1900, this is still looking like a range play between 1.16–1.19.
📉 Daily Structure
We’ve got a failed break at the highs, confirming liquidity grab.
Daily is chilling near the 71% fib retracement + demand zone. That’s the hot buy area 🏦.
If price bounces here → eyes on 1.1750–1.1800.
If it fails → expect a sweep into 1.1500 zone before any rocket 🚀.
⏱ 4H Breakdown
Two clear scenarios loading…
1️⃣ Idea 1 (deeper dip): Price breaks below current lows, sweeps liquidity into 1.1550–1.1600 (4H demand). Then we catch buys for a run back to 1.1700+.
2️⃣ Idea 2 (bullish push): Price flips short-term highs at 1.1750 → confirms momentum → next stop 1.1850–1.1900 retest.
Both ideas align with higher-timeframe liquidity games—just depends which way market makers want to hunt first 🎯.
🎯 Summary
Weekly = Range between 1.16–1.19 until proven otherwise.
Daily = Sitting on golden demand/discount.
4H = Watch for liquidity sweep down or break above 1.1750.
Big picture → Still bullish bias if demand holds, but don’t be surprised by one more dip before the climb.

Sept 25: Two Trades Should Have Won If I Just...Sept 25: Two Trades Should Have Won If I Just...
Put my TP at 10 pips (100 points).
Both trades on A+ setups but failed because TP was too high.
I guess I have to adjust my 130 point standard take profit idea. It's still too high lol.
I've decided to do 50 points/5pips SL and 100 points/10pips as my standard. I think it's just enough for my strategy's "gas limits".
We'll see how it goes if this ends up making me profitable or not.
