LITECOIN can easily hit $43 in the next 10 months.Litecoin (LTCUSD) started its new Bear Cycle after a rejection on the 4-year Lower Highs trend-line. Now that it sits below its 1W MA200 (orange trend-line), which was formally a Resistance during the Bull Cycle, we can claim that the next stage should be targeting the Higher Lows 1 trend-line.
Given that all previous Bear Cycles lasted for at least a year and that the last one dropped less than the 2018, we can expect LTC's new Bear Cycle to last up until August 2026 at least. Even a 'modest' decline should still see it targeting Higher Lows trend-line 2, which by the end of August 2026 should have hit $43.00 at least.
---
** Please LIKE 👍, FOLLOW ✅, SHARE 🙌 and COMMENT ✍ if you enjoy this idea! Also share your ideas and charts in the comments section below! This is best way to keep it relevant, support us, keep the content here free and allow the idea to reach as many people as possible. **
---
💸💸💸💸💸💸
👇 👇 👇 👇 👇 👇
Litecoin (Cryptocurrency)

BTC/USDT | Consolidation and fall (READ THE CAPTION!)By examining the 4H chart of BTCUSDT, we can see that BTC is struggling to make a move and is consolidating over the IFVG. If it fails to make a move, a fall to the Demand Zone at 86,600 is possible. However, if it manages to go up, it'll face the FVG at 94,500 level, which then determines whether BTC can make an upwards move or falls again.

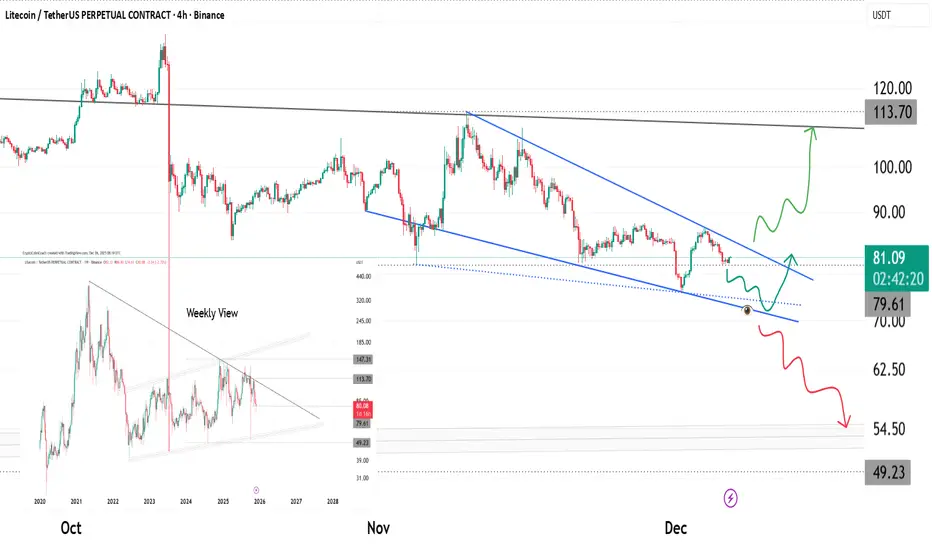
LTC: Final Compression Before the Break - Major Wedge EndingLitecoin is trading inside a clean falling wedge after multiple rejections from the macro trendline visible on the weekly chart. Price is now squeezing toward the apex with momentum flattening out.
Key notes:
• Bullish scenario: A breakout above the wedge resistance + reclaim of 85–87 opens room toward 113.70 and later the macro resistance at 120 .
• Bearish scenario: Losing the lower wedge line + breakdown from 79–80 can send LTC toward 54–49 demand.
Reasons this level matters:
• The wedge has 60+ days of compression
• Weekly multi-year trendline shows confluence
• Local liquidity pools positioned right above current price
• Multiple reaction wicks signaling absorption
Watching the reaction at 79–82 will reveal the next wave: strong bounce = bullish continuation, weak retest = deeper correction.
BTC/USDT | $BTC Smashes Back to 94K but The Real Test Is Ahead!CRYPTOCAP:BTC pulled a full reversal after the heavy crash and pushed all the way back to 94K. Right now price is trading around 93K and this entire move basically filled the liquidity void created during the violent dump. For short term traders this is where I prefer staying on the sidelines because premium entries will show up again at lower levels once the market cools down.
For long term traders and holders nothing has changed. The bullish structure is still alive and if Bitcoin can break above 97K the next upside leg can easily extend toward 105K and even 106K. I will update the view again once we see how price behaves around the 97K zone.
Please support me with your likes and comments to motivate me to share more analysis with you and share your opinion about the possible trend of this chart with me !
Best Regards , Arman Shaban

BTC/USDT | The real test ahead! (READ THE CAPTION)Hello everyone, back with another analysis, this time on BTC.
By examining the daily chart of BTC, we can see that bitcoin has been boosted up after hitting the demand zone and is currently being traded in 93K zone. I expect a rise to 97k-98k FVG zone, if BTC manages to go past through this zone, a rise to 104K could be possible. Should it fail to go past 98K, another drop to 81K is likely to happen.

FireHoseReel | LTC:When does Litecoin explode next?🔥 Welcome to FireHoseReel!
Let’s dive into the 4H Litecoin (LTC) analysis.
👀 Litecoin is currently trading below a descending curve trendline.
Each time price hits this curve, it gets rejected to the downside. Price is now approaching the end of this compression zone, while a key support has formed at $81.48 near the bottom.
📊 Litecoin volume has been declining during the recent drop and is now at very low levels.
Once volume expands again, any upcoming move in LTC is likely to become more impulsive and powerful.
✅ The LTC/BTC pair is also in a strong corrective phase, showing a noticeable decline in Litecoin’s relative strength against Bitcoin.
✍️ You can review the main Litecoin scenarios below and use them alongside your own trading strategy if needed.
🟢 Long Scenario:
A breakout above the descending curve trendline, followed by a clean pullback, and then a push toward the static resistance at $87.42 with rising buy volume, could activate our long trigger.
🔴 Short Scenario:
A breakdown below the $81.48 support with a confirmed close below this level and increasing sell volume could activate our short trigger.
❤️ Risk Management & Emotional Discipline
Crypto trading is highly risky. Without proper risk management and emotional control, trading is no different from gambling.
Logic must always come before emotions. Learn to manage your trades—and enjoy the process of trading with control and discipline.

Litecoin Below 70$ Soon.#Litecoin Below 70$ Soon...
After that it'll go for exit liquidity .
Be Safe Guys.

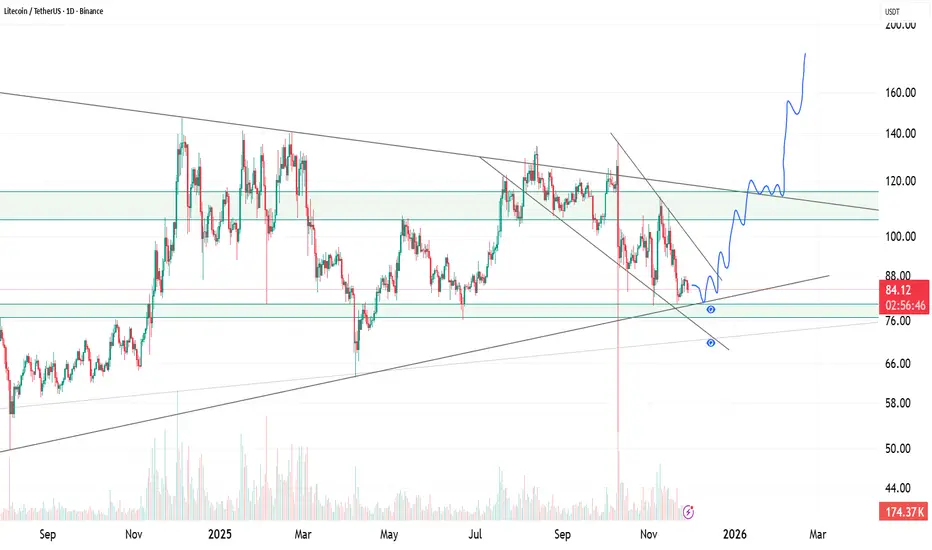
LTC , Retesting Major Support With a Potential Breakout SetupLTC is trading inside a long-term symmetrical wedge while also forming a smaller falling channel in the recent down-move. Price has reached a critical area where multiple technical factors overlap:
• A long-term ascending support trendline
• Horizontal support between $76–$82
• The lower boundary of the falling mini-channel
• Increasing wick rejections showing buyer interest
This zone has acted as a strong accumulation region multiple times in the past.
If LTC holds this support and breaks above the falling channel, it could trigger a shift in momentum and open the path toward the mid-range and upper resistance levels.
Key levels to watch:
• Support: $76 – $82
• First reclaim trigger: Break above $88
• Major breakout zone: $102 – $120
Invalidation:
A clean breakdown below $76 would invalidate the bullish setup and expose deeper levels.
Summary:
LTC is at a high-interest zone. Holding this support + breaking the falling channel can start the next upward leg. Losing the zone flips the structure bearish.
LITECOIN IS FULLY CHARGEDHey traders! LTC has been quietly accumulating energy in this tight range for days — all the coils are compressed, and the spring is about to pop!
I’m expecting a strong impulsive move upward very soon.
My targets:
🎯 Target 1 — 89
🎯 Target 2 — 91.20 (main zone I’m watching)
❌Invalidation (plan cancelled): 85.89
If we break and hold above the recent highs, this thing can run fast. Watching it closely!
Who’s in? Smash the like & follow for updates 🔥

BTC/USDT | Bitcoin Going Towards $94K or Will It Fall From Here?By analyzing the CRYPTOCAP:BTC chart on the daily timeframe, we can see that CRYPTOCAP:BTC followed our previous plan perfectly and after holding above the 81K demand zone it climbed back into the 91K area. The bullish structure remains fully intact and momentum is still on the buyers’ side. As long as BTC stays above the 81K to 85K support range I expect the next upside wave to target 94K first and then 97K and 102K in continuation.
Please support me with your likes and comments to motivate me to share more analysis with you and share your opinion about the possible trend of this chart with me !
Best Regards , Arman Shaban

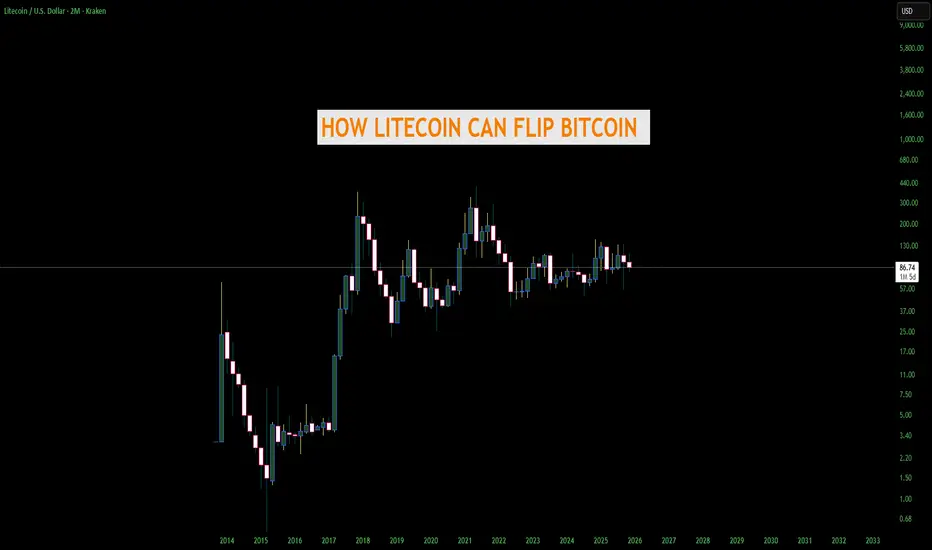
THE DAY LITECOIN FLIPS BITCOIN AND BECOMES #1 - AND HOWGrok helped me with this but regardless this is a great read. Not financial advice
1. Bitcoin fees explode again (> $50–$200 per transaction)
LTC stays under 5¢ and 4× faster → merchants & users flee to “digital silver” for actual payments
-Historical precedent: May 2017 & Dec 2017 fee madness → LTC pumped from $4 → $375 in weeks; repeated in May 2021 → $410 ATH
2. Bitcoin blocks stay full for months (Ordinals / Runes / BRC-20/ and now unlimited SPAM clog the chain again)
People rediscover Litecoin as the cheap, fast, on-chain alternative that actually works for daily spending
-Historical precedent: 2023–2024 Ordinals era → LTC quietly 3×–4× while BTC was practically unusable for small amounts
3. Major nation/state bans or heavily restricts Bitcoin mining or self-custody
LTC is smaller, less of a political target → miners add Scrypt rigs, capital rotates
-Historical precedent: China 2021 mining ban → Litecoin hashrate and price both spiked hard in the following months
4. A confirmed 51% attack or large double-spend actually happens on Bitcoin
Trust in BTC’s immutability shatters overnight → Litecoin (merged-mined with Dogecoin) suddenly has higher combined attack cost and looks safer
-Historical near-miss: 2018–2019 51% attack fears on smaller chains sent LTC up +150% in pure rotation plays
5. Credible quantum-break announcement or real progress scare (2026–2030 timeline moves up)
Litecoin’s MWEB addresses are already quantum-resistant + dev team can soft-fork faster than Bitcoin’s politics allow
-Historical precedent: 2023–2024 quantum FUD alone gave privacy coins and quantum-ready projects 3–10× pumps
6. Litecoin ETF (e.g., Canary Capital's) faces post-launch outflows or SEC-mandated tweaks due to BTC ETF dominance, while Bitcoin ETFs pull in record inflows
BTC ETFs become the unchallenged "institutional safe bet," capping BTC's retail upside → sidelined investors, retail traders, and altcoin funds rotate into the now-proven LTC ETF as the "next logical step" for legacy alts (with Canary/Grayscale already live and showing strong early volume)
-Historical precedent: ETH ETFs in 2024 saw initial outflows vs. BTC's inflows → ETH still 2–3×'ed on rotation; SOL's 2025 ETF launch pumped despite similar early teething issues
7. Lightning Network suffers major centralization scandals, hub failures, or routing collapses
People remember Charlie Lee’s original pitch: simple, fast, cheap, on-chain money with no layer-2 headaches
-Historical precedent: 2023–2025 Lightning UX complaints repeatedly drove spikes in LTC daily transaction volume and price
8. Bitcoin loses the “first-mover narrative” to a new nation-state adoption
Example: a major country (Brazil, Argentina, Indonesia, etc.) announces it will use Litecoin instead of Bitcoin for remittances or reserves because LTC is 4× faster and 100× cheaper.
-Precedent: El Salvador 2021 BTC adoption pumped Bitcoin; a “Litecoin country” would do the same or more for LTC.
9. PayPal, Venmo, Cash App, or Stripe re-activates Litecoin for instant zero-fee withdrawals/deposits
They all supported LTC years ago and dropped it only because of 2018 bear market. One click to flip it back on → instant 50–100 million new users.
-Precedent: PayPal adding BTC in 2020 → +300 % pump in weeks; LTC would explode harder because it’s actually usable on their rails.
10. Dogecoin merges fully with Litecoin (merged-mining → full auxiliary chain)
-Precedent: DOGE pumps in 2021 dragged LTC up 4–6× every single time. A real technical merger would be 10× stronger.
11. Major exchange or custodian loses billions in Bitcoin (think FTX 2.0 but only BTC exposed)
Users rush to self-custody the one big coin that still has sub-$0.01 fees and 2.5-minute confirmations → Litecoin.
-Precedent: FTX collapse 2022 → LTC was one of the only coins people could actually withdraw fast and cheap.
12. SEC or European regulator classifies Bitcoin as a “security” or “commodity with special rules” but explicitly says Litecoin is a commodity/currency
Institutions that were forced to sell BTC rotate the exact same thesis into LTC overnight.
-Precedent: XRP SEC case resolution in 2023 caused instant 3× pump; same mechanics.
13. Bitcoin Core development stalls or splits again (Blocksize Wars 2.0)
Big-blockers and users frustrated with ossification move money and hashrate to the chain that kept Charlie Lee’s original “faster, lighter” vision alive.
-Precedent: 2017 Bitcoin Cash hard fork → LTC price went parabolic as the “peaceful middle ground.”
14. Global remittance giants (Western Union, MoneyGram, Wise) quietly switch backend rails to Litecoin
They already tested LTC in 2017–2019. A single press release announcing “instant global transfers for pennies” using Litecoin would add billions in real volume.
-Precedent: Ripple/XRP partnerships in 2018 caused 10× pumps even when adoption was tiny. Real adoption would be insane for LTC.
LTCUSDT LongConsolidation on H4 Chart, now price is on the bottom of pattern. Bullish signal is clear, Risk Reward 1:5

Litecoin LTC/USD Buy The Fear Sell The EuphoriaI haven't made a Litecoin chart in a while. We've been sideways and uneventful, figured I would wait till something eventful happens. Well here it is folks , the moment before we actually move up everyone is selling except for a few smart hands. This fractal says it all in my opinion. fractals are usually very similar but not exact. Where we are now in price for Litecoin around 83 is really close to the bottom of this pullback. It washed out and cleaned up all the leverage, a very common occurrence in this market before large moves up. The move will be absolutely explosive and probably no meaningful pullback until we break the all time high. I see a pullback to retest the high before the next massive leg up.
Right now in my opinion is the worst place to sell. I know this "bear market" is not a real bear market because of how many people are saying it is. The whole world says its a bear market right now, every youtube grifter has pivoted to bear market recently with this drop, every news channel is saying it is. Thats why its not, most have sold already and now the price I believe will rebound so fast it'll shock everyone and the ones who sold will be in denial waiting for the "next low". When that low doesn't come and we break the highs they will all pile back in.
Everyone says oh this moving average, or this indicator, or this RSI. Look its all helpful stuff but its also all imaginary lines. Who says that we MUST be in a bear market because we broke a 200 day moving average. Who says because RSI is overbought we must go down. RSI has infinite different adjustments so whos to say that the 14 length is correct? These indicators will begin to fail over time as more and more people look at them. Right now there is more traders and wanna be traders in the world than ever before so if everyone is looking at the same thing all the time then most likely those will start to fail. Oh its happened every time before , I know , I know. Come on at the end of the day Bitcoin is still in its infancy. I dont buy the four year cycle, or seasonality crap, its foolish and betting your portfolio on those factors alone is a recipe for BROKE! I still stand by my previous long term predictions. Obviously its taking much longer than I expected but timing these things is nearly impossible on the long term time frame. While all the youtube grifters flip flop weekly I listen to the Billonaires and people who MAKE the markets. Saylor said three days ago the pullback is almost over and hes buying. Blackrocks Robbie Mitchnick says this is a good buying area and thats just a couple theres dozens of big wigs saying the same thing.
So to wrap this up I believe we are at the point of rocket ship. Look at economic factors, liquidity worldwide is expanding, stimulus is coming, tightening is ending, rates are coming down. Fiat currencies worldwide are about to go into hyperinflation and certain cryptos will reap the benefit of that. Bitcoin and Litecoin being the top gainers in this next phase of hyperinflation in my opinion. This is just my opinion and not financial advice. Thank you

Litecoin: Target Zone Within ReachLTC has recently continued its decline, leading us to believe that the high for green wave B is likely already in place. Price is now just a short distance from our green Target Zone, which ranges from $78.52 to $64.53. Within this zone, we expect to see the low of orange wave ii. Afterward, orange wave iii should drive price above the resistance levels at $118.71 and $147.06.

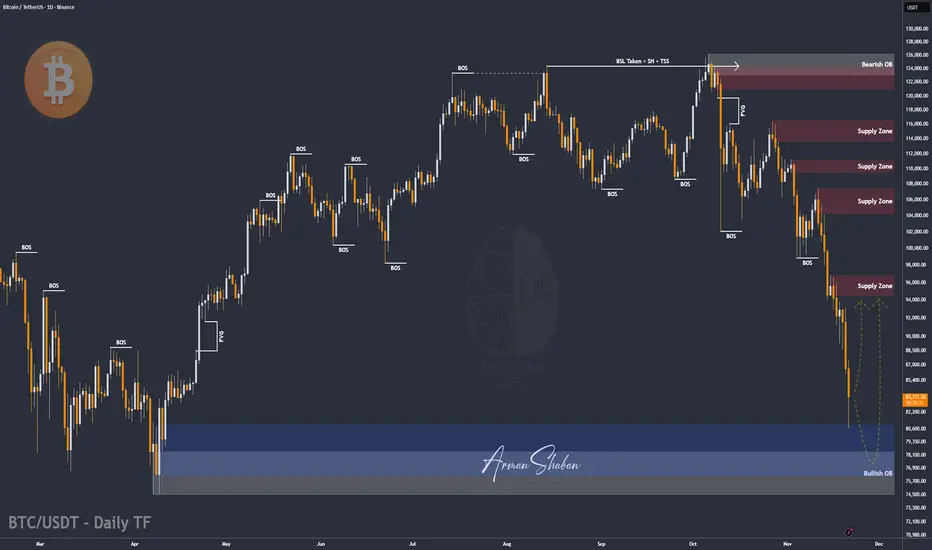
BTC/USDT | Bitcoin Hit Major Demand, What’s Next?By analyzing the #Bitcoin chart on the daily timeframe, we can see that the price dropped exactly as expected and fell sharply to $80,500. Once it reached this major demand zone, buyers stepped in and Bitcoin bounced back to around $83,900.
As long as BTC can hold above the large demand zone between $74,000 and $81,000, we can expect the next bullish wave to start.
From my perspective, the trend is not bearish! this is still a healthy correction.
From the ATH at $126,200, Bitcoin has corrected 36%, which is completely normal in strong uptrends. Now it’s time to watch for decreasing selling pressure and the beginning of a stronger upside move. This analysis will be updated soon.
Please support me with your likes and comments to motivate me to share more analysis with you and share your opinion about the possible trend of this chart with me !
Best Regards , Arman Shaban
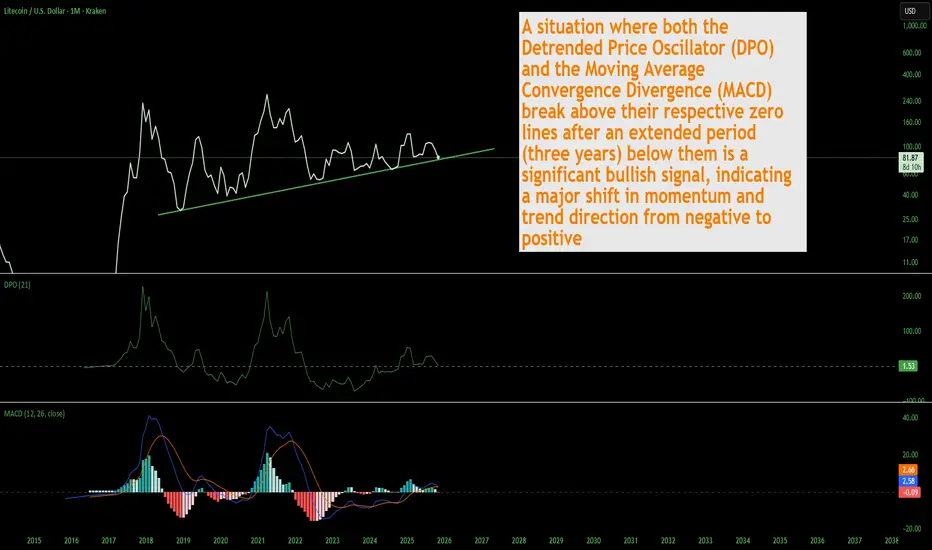
LTC Litecoin Poised For Something Big Macro Style I still see lots of people selling and capitulating. Thats ok that cant be prevented, most have no idea how markets work and those same people are afraid of their own shadow. The capitulation is almost over. I just want to point out the confluence of various indicators on the macro long term time frame pointing to a massive bull run for Litecoin. This is not financial advice just my opinion. Like and follow for more updates.
LITECOIN Analysis (4H)It appears that a double correction is forming on Litecoin and is nearing completion. Around the origin zone, we can look for long buy positions so that once this second corrective leg finishes, the price can enter a bullish phase.
The entry zone and targets are marked on the chart.
For risk management, please don't forget stop loss and capital management
When we reach the first target, save some profit and then change the stop to entry
Comment if you have any questions
Thank You

LTCUSD - Symmetrical Triangles As seen in the first symmetrical triangle a massive break out followed
If the second is anything like the first we can expect a breakout like that one
I have posted this chart before but it really is a strong bull option for a long term altcoin.
Weekly timeframe

LTCUSD H4 | Could We See A Bullish Reversal?Momentum: Bullish
The price has recently bounced off the identified buy-entry level, which aligns with the pullback support zone.
Buy Entry: 889.05
Pullback support
Stop Loss: 79.91
Swing-low support
Take Profit: 102.38
Pullback resistance
Positioned slightly below the 61.8% Fibonacci retracement
High Risk Investment Warning
Stratos Markets Limited (tradu.com ), Stratos Europe Ltd (tradu.com ):
CFDs are complex instruments and come with a high risk of losing money rapidly due to leverage. 70% of retail investor accounts lose money when trading CFDs with this provider. You should consider whether you understand how CFDs work and whether you can afford to take the high risk of losing your money.
Stratos Global LLC (tradu.com ): Losses can exceed deposits.
Please be advised that the information presented on TradingView is provided to Tradu (‘Company’, ‘we’) by a third-party provider (‘TFA Global Pte Ltd’). Please be reminded that you are solely responsible for the trading decisions on your account. Any information and/or content is intended entirely for research, educational and informational purposes only and does not constitute investment or consultation advice or investment strategy. The information is not tailored to the investment needs of any specific person and therefore does not involve a consideration of any of the investment objectives, financial situation or needs of any viewer that may receive it. Past performance is not a reliable indicator of future results. Actual results may differ materially from those anticipated in forward-looking or past performance statements. We assume no liability as to the accuracy or completeness of any of the information and/or content provided herein and the Company cannot be held responsible for any omission, mistake nor for any loss or damage including without limitation to any loss of profit which may arise from reliance on any information supplied by TFA Global Pte Ltd.

Market Outlook: Bitcoin Path to $150KThe broader structure on Bitcoin still points toward a long-term expansion into and possibly above the $150K region, but the chart is showing as always that we won’t get there in a straight line.
Just like when I previously predicted Bitcoin’s move to $108K (See my 2021 Bold but slightly off in timing call here: ), the current setup is following the same pattern of exhaustion → correction → expansion. The signs are repeating and becoming clear again: momentum is slowing, resistance is rejecting harder and faster than ever, and volume is now tapering off. When this happens, the market usually needs a deeper reset before the next major leg to the upside.
A pullback into the $70K–$75K zone looks not only possible but healthy, not just for Bitoin but the entrie crypto market. If i was a first time investor and this played out this level would be where I steadily start to invest slowly week by week across the major favorites like Ethereem, XRP, Litecoin, Solana, Cardano, Chainlink, etc
This pullback area below 75k aligns with:
• A major liquidity pocket that has not been tapped
• The previous breakout zone needing a retest
• An ideal discount region for larger institutions to reload
• A level that would wipe out overleveraged longs and rebalance the crypto market
The drop have been and will feel even more painful to longer term investors, especially for new buyers or late comers wo came in above these numbers, but this kind of correction is exactly what fuels the next macro wave or what we like to call the next BULL RUN.
Once BTC finds support in the $70K–$75K range and reclaims that zone, the next bullish impulse opens up and that’s where we get the continuation toward the $150K macro target. The structure, liquidity map, and long-term momentum all support this trajectory.
In short:
Short-term: a deep corrective pullback.
Mid-term: stabilization and accumulation.
Long-term: the trajectory remains intact for a push toward $150K in the coming few months to couple years, just like that 2021 $100K call.
Stay Ready!


LTCUSDT : Full analysisHello friends
well you see that the power is in the hands of the sellers and we must have sufficient approvals to buy.
So you see, we have two important support areas that we have identified for you with Fibonacci, and they can be good supports. We need to see how buyers react in these areas.
Well, the next point is that despite the sharp drop in Bitcoin, Litecoin did not fall much. It fell by almost half of Bitcoin. Considering the previous times I saw that when Bitcoin fell, other currencies fell several times as much, and this is a good sign (meaning that its holders have a positive view of the currency).
But to buy, we need to know where and when to buy, to find the best point to buy and to take our profits at the best point. For this reason, we expect that Litecoin will most likely bottom out again and buy in support areas with risk and capital management and in steps And to move with the specified goals.
*Trade safely with us*

LTC: Don’t FOMO, Wait for Confirmation$LTC/USDT is getting squeezed between the rising trendline and the overhead resistance zone. Price has tested this resistance multiple times before but failed to break through.
A potential upside move could develop if we finally see a clean close above the marked zone.
Until then, it’s best to stay patient, don’t FOMO, wait for a clear breakout pattern.
DYOR, NFA
