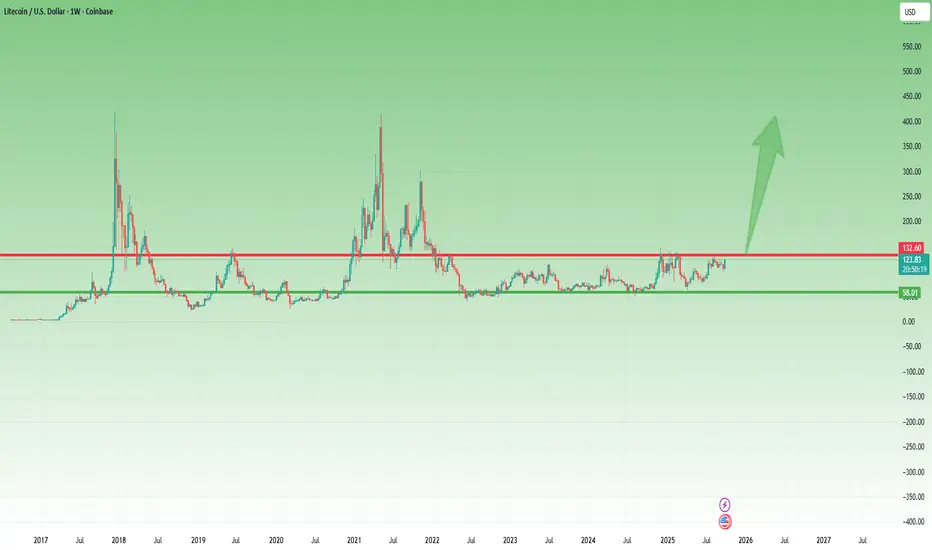
Litecoin Ready to Explode After 3 Years of SleepIn recent years, with the flood of new crypto projects, Litecoin has quietly faded into the background.
Since the local low in May 2022, the price action has been rather lethargic, contained within a well-defined range between 60 and 130 USD.
However, since April 2025, something interesting has been happening — Litecoin seems to be waking up, quietly and almost secretly, as if not to attract too much attention.
From that point onward, LTC/USD has been steadily printing higher lows, and if we zoom out to the longer-term chart, the structure looks remarkably clean — almost textbook — for a potential breakout setup.
Even recently, after another touch of the resistance zone, the correction that followed took the form of a bullish flag, and last week’s strong engulfing candle practically erased an entire month of pullback, now pressing once again against the key resistance level.
In my opinion, it’s time for this cryptocurrency to wake up.
A clear break above 130 would be a strong technical confirmation of that view.
While Litecoin might not deliver the “10x hype” potential that newer tokens promise, it has consistently proven to be one of the most stable and resilient assets in the crypto space.
After three years of accumulation, a breakout could easily trigger an explosive move to the upside.
📈 I’m personally buying Litecoin, with a target around 300 USD in the medium term.
Sometimes, the coins everyone forgets about are the ones that surprise the most. 🚀
Litecoin (Cryptocurrency)
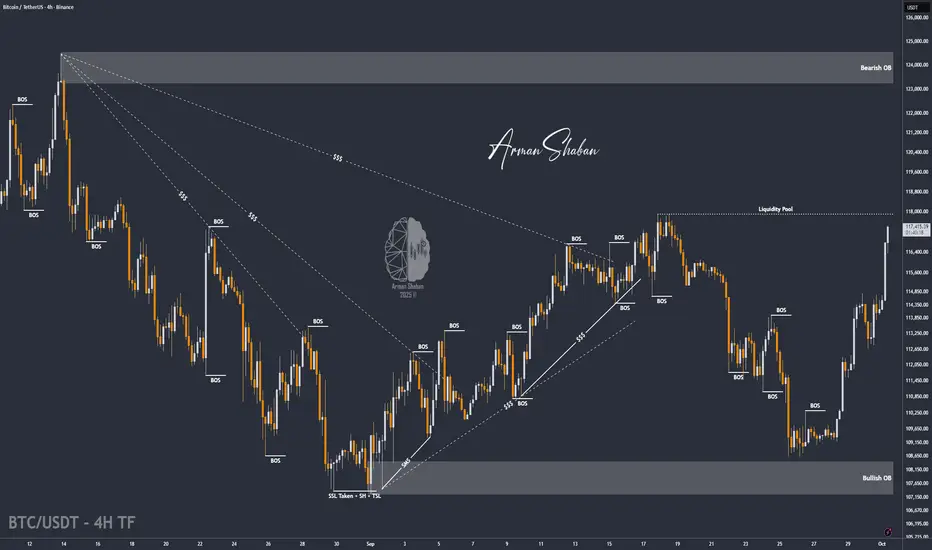
BTC/USDT | BTC Rally +7% Gains – Bulls Still in Control (READ)By analyzing the Bitcoin chart on the 4-hour timeframe, we can see that the price continued its rally as expected, hitting the $115K target and now reaching up to $117,200, just one step away from the next target at $118K. So far, this analysis has delivered more than 7% gains. I hope you made the most out of it!
Please support me with your likes and comments to motivate me to share more analysis with you and share your opinion about the possible trend of this chart with me !
Best Regards , Arman Shaban
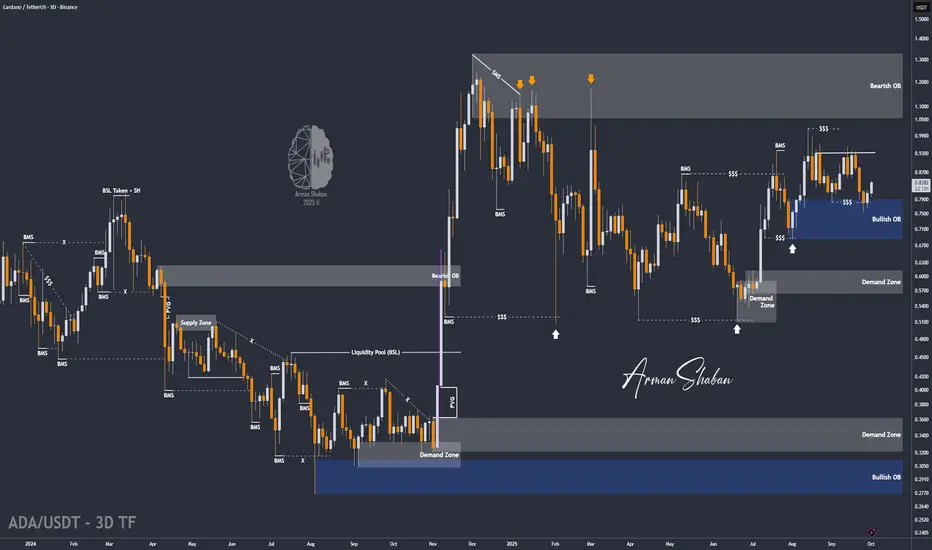
ADA/USDT | ADA Breakout Setup – More Upside AheadBy analyzing the Cardano (ADA) chart on the 3-day timeframe, we can see that the price has started to rise as expected and is now close to the first target at $0.85, giving us more than 11% gains from the previous analysis so far.
All other points from the last analysis remain valid. The next short-term targets are $0.95 and $1.00, while the mid-term targets are $1.05, $1.17, and $1.33.
Please support me with your likes and comments to motivate me to share more analysis with you and share your opinion about the possible trend of this chart with me !
Best Regards , Arman Shaban
#LTC/USDT analysis.Give me some energy !!!#LTC
The price is moving within a descending channel on the 1-hour frame, adhering well to it, and is heading for a strong breakout and retest.
We have a bearish trend on the RSI indicator that is about to be broken and retested, supporting the upside.
There is a major support area (marked in green) at 107.50, which represents a strong basis for the upside.
For inquiries, please leave a comment.
We are in a consolidation trend above the 100 moving average.
Entry price: 111.15
First target: 112.80
Second target: 114.70
Third target: 117
Don't forget a simple matter: capital management.
When you reach the first target, save some money and then change your stop-loss order to an entry order.
For inquiries, please leave a comment.
Thank you.

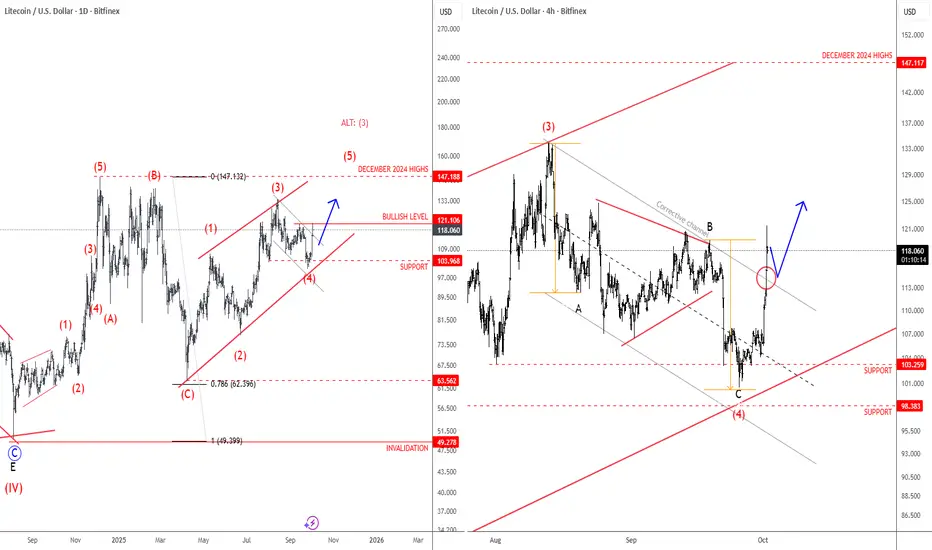
Litecoin Is Still Eyeing December 2024 HighsLitecoin turned lower recently, but we believe this is just another corrective retracement within a broader bullish trend, which has been showing higher swing lows since the rebound from the 78.6% Fibonacci level back in April. We expect that retracement down from the December highs will be fully retraced, meaning there’s room for a push up toward 147 as illustrated on a daily chart. It can be looking for wave (5) of a diagonal pattern, or alternatively, maybe even wave (3) if it extends decisively above upper diagonal line and goes for 200 area. In the 4-hour chart, we got a sharp rebound from projected support and back above channel resistance line after we noticed an ABC correction, so bulls are back, and we may easily see more gains toward December 2024 highs, just watch out for short-term pullbacks.
LTCUSD H4 | Bearish drop offLitecoin (LTC/USD) is reacting off the sell entry which is an overlap resistance that aligns with the 38.2% Fibonacci retracement and could reverse from this levle to he take profit.
Entry is at 107.36, which is an overlap resistance that aligns with the 38.2% Fibonacci retracement.
Stop loss is at 111.31, which is a pullback resistance that is slightly below the 61.8% Fibonacci retracement.
Take profit is at 101.34, which is a multi swing low support.
High Risk Investment Warning
Trading Forex/CFDs on margin carries a high level of risk and may not be suitable for all investors. Leverage can work against you.
Stratos Markets Limited (tradu.com ):
CFDs are complex instruments and come with a high risk of losing money rapidly due to leverage. 65% of retail investor accounts lose money when trading CFDs with this provider. You should consider whether you understand how CFDs work and whether you can afford to take the high risk of losing your money.
Stratos Europe Ltd (tradu.com ):
CFDs are complex instruments and come with a high risk of losing money rapidly due to leverage. 66% of retail investor accounts lose money when trading CFDs with this provider. You should consider whether you understand how CFDs work and whether you can afford to take the high risk of losing your money.
Stratos Global LLC (tradu.com ):
Losses can exceed deposits.
Please be advised that the information presented on TradingView is provided to Tradu (‘Company’, ‘we’) by a third-party provider (‘TFA Global Pte Ltd’). Please be reminded that you are solely responsible for the trading decisions on your account. There is a very high degree of risk involved in trading. Any information and/or content is intended entirely for research, educational and informational purposes only and does not constitute investment or consultation advice or investment strategy. The information is not tailored to the investment needs of any specific person and therefore does not involve a consideration of any of the investment objectives, financial situation or needs of any viewer that may receive it. Kindly also note that past performance is not a reliable indicator of future results. Actual results may differ materially from those anticipated in forward-looking or past performance statements. We assume no liability as to the accuracy or completeness of any of the information and/or content provided herein and the Company cannot be held responsible for any omission, mistake nor for any loss or damage including without limitation to any loss of profit which may arise from reliance on any information supplied by TFA Global Pte Ltd.
The speaker(s) is neither an employee, agent nor representative of Tradu and is therefore acting independently. The opinions given are their own, constitute general market commentary, and do not constitute the opinion or advice of Tradu or any form of personal or investment advice. Tradu neither endorses nor guarantees offerings of third-party speakers, nor is Tradu responsible for the content, veracity or opinions of third-party speakers, presenters or participants.

BTC/USDT | BTC Bounce After $111K Dip – Liquidity Gap in FocusBy analyzing the Bitcoin chart on the 4-hour timeframe, we can see that after a heavy correction down to $111,000, the price found demand again and is now trading around $113,600.
I expect Bitcoin to continue rising to fill the liquidity gap, with the first target at $114,150. Other targets and scenarios will be shared tomorrow!
Please support me with your likes and comments to motivate me to share more analysis with you and share your opinion about the possible trend of this chart with me !
Best Regards , Arman Shaban
LTC 4H Analysis - Key Triggers Ahead☃️ Welcome to the cryptos winter , I hope you’ve started your day well.
⏰ We’re analyzing LTC on the 4-Hour timeframe .
👀 After the sharp and deep drop that Litecoin experienced in 3 candles, it moved toward its key support in the $102 area and was well supported from this zone. Then it formed a higher low and higher high compared to its previous low and high, and it is now moving to break its resistance in the $107 area. With a 4-hour confirmation on this zone (the taker-seller and key resistance), it can move upward.
🧮 Two key zones are considered for the RSI oscillator: the 63 level, which is close to the 70 zone—if the volatility crosses this level, Litecoin can move toward overbought. The second zone is the entry threshold into oversold.
🕯 The size and volume of the candles in the recent drop, which can be considered a price correction, are really significant and large. Scattered sell orders are placed above the area we marked, which causes our green candles below this zone to appear a bit smaller. To break the specified taker-seller area, we need a large candle with relatively high volume that fully confirms (stabilizes) on this zone to shape our bullish and high-momentum trend.
💸 BINANCE:LTCBTC is bearish against the Bitcoin pair and has not turned bullish yet, but it is positioned a bit above its support floor. With a breakout of the taker-seller zone in the USDT pair, the Litecoin/Bitcoin pair might also turn bullish, which would increase the movement momentum and the size of the candles.
🧠 For a Litecoin long position, we have to wait until we confirm above this taker-seller area with a strong whale candle and then examine the available scenarios for the breakout.
↗️ Long position scenario: breaking the taker-seller area and key resistance at $107 along with whale candles, and then observing a multi–time frame indecision candle, which will also give us a smaller stop size.
📉 Short position scenario: if the market wants to give a heavy and strong correction, the $102 area can be a good zone for a floor break and a short position on this coin—but the important point for us is that Litecoin is about to start a good bullish trend.
❤️ Disclaimer : This analysis is purely based on my personal opinion and I only trade if the stated triggers are activated .

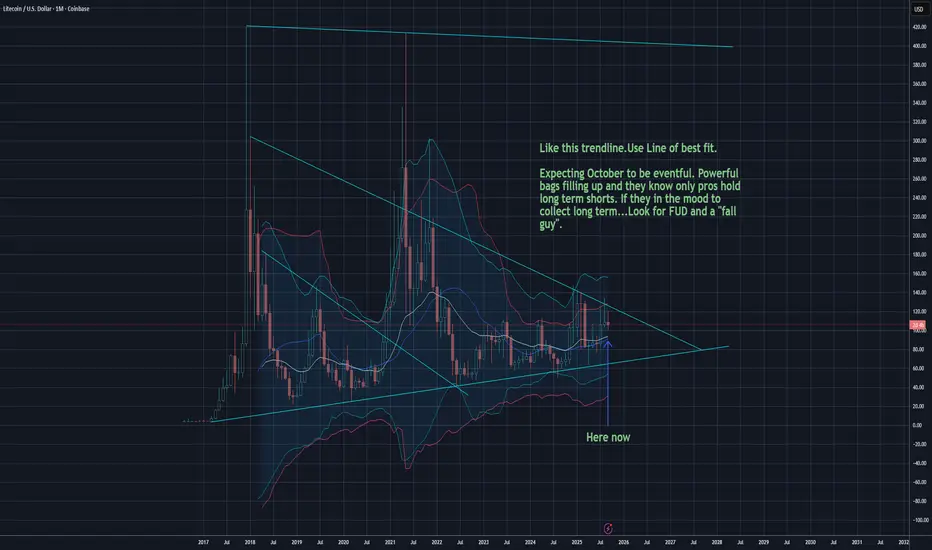
LTC - Litecoin closing monthly flat...what next?LTC spent September trading between $108 - $121. A tight range while everyone awaits the SEC ruling. Usage for payments is up and the network remains strong yet it trades in AMEX:USD and is now being bought up by the same greedy bankers that led Satoshi to create Bitcoin. These people play by different rules.
Expecting a RED October for markets. Possible some heavy market FUD with a "fall guy" to blame. I am not short and will view as a buying opportunity if happens. Long term bullish but next month.....BRACE
Not financial advice and never take advice from the internet. Happy Sunday
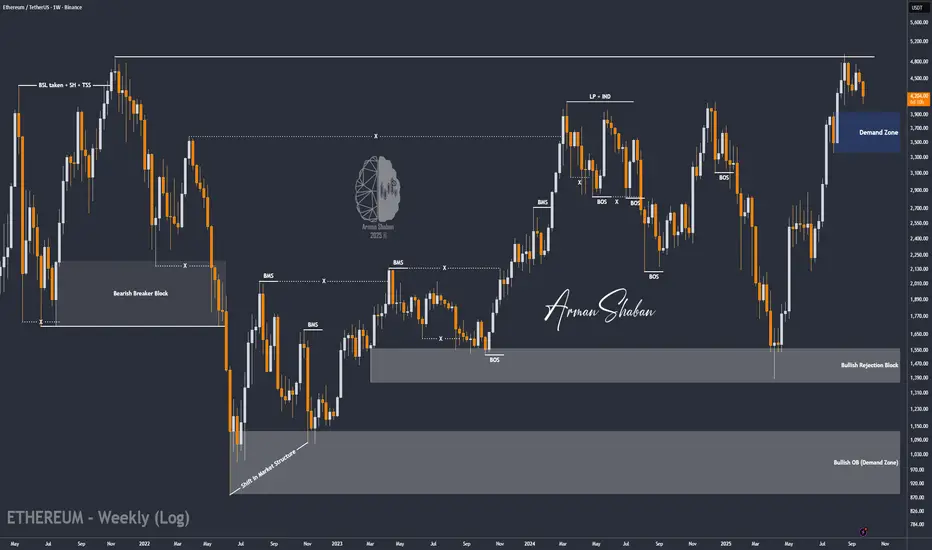
ETH/USDT | Correction Over? Big Rally Loading After Demand ZoneBy analyzing the Ethereum chart on the weekly timeframe, we can see that after Bitcoin’s heavy dump , ETH also corrected and is now trading around $4,200 .
Based on the previous analysis, the $3,300–$3,900 zone is still a key demand area. If the price enters this zone, I expect Ethereum to start its next bullish wave.
The possible upside targets for this rally are $5,100, $5,500, and $6,000.
Please support me with your likes and comments to motivate me to share more analysis with you and share your opinion about the possible trend of this chart with me !
Best Regards , Arman Shaban
LTC/USDT | Litecoin Consolidating – Can Bulls Smash $150 RSTNCE!By analyzing the Litecoin (LTC) chart on the weekly (logarithmic) timeframe, we can see that after our last analysis, the price successfully reached the targets at $92.5 and $115. Currently, it is trading around $115.
The price now faces a strong resistance zone between $120–$150. Litecoin is consolidating and building enough momentum to attempt a strong breakout of this zone. If it manages to break through, the next bullish targets will be $155, $200, and $268.
Please support me with your likes and comments to motivate me to share more analysis with you and share your opinion about the possible trend of this chart with me !
Best Regards , Arman Shaban

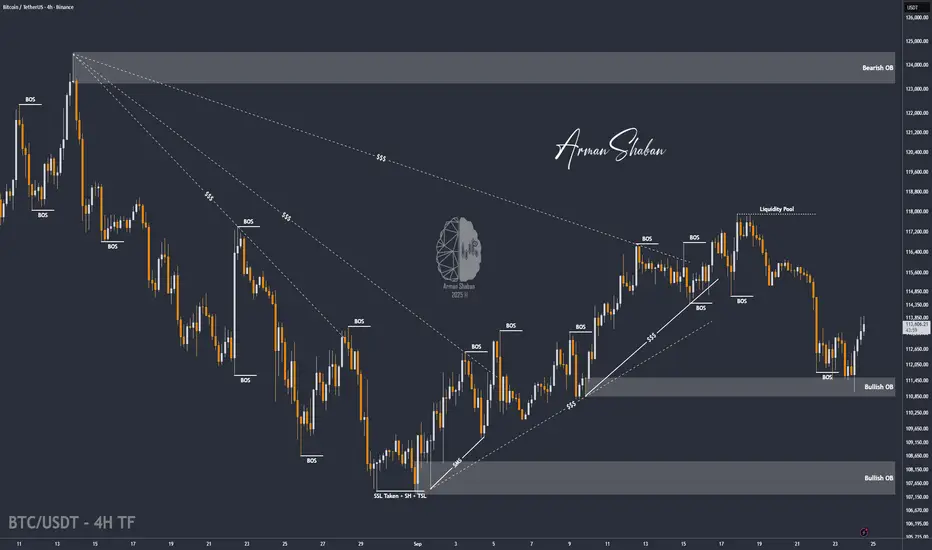
BTC/USDT | BTC Correction Done? Next Pump Loading…By analyzing the Bitcoin chart on the 4-hour timeframe, we can see that the price moved higher as expected, reaching around $118,000. After that, Bitcoin corrected down to the $115,000 demand zone. Once it touched this level, demand stepped in again and the price bounced back.
Currently, Bitcoin is trading around $116,000. If the price holds above the $114,400–$115,000 support zone, we can expect the start of another bullish wave.
Please support me with your likes and comments to motivate me to share more analysis with you and share your opinion about the possible trend of this chart with me !
Best Regards , Arman Shaban

LTCUSD H4 | Bullish momentum to extendLitecoin (LTC/USD) has bounced off the buy entry which is an overlap support and could potentially rise from this level to the upside.
Buy entry is at 114.09, which is an overlap support level.
Stop loss is at 109.77, which is a pullback support level.
Take profit is at 123.04, which is a swing high resistance.
High Risk Investment Warning
Trading Forex/CFDs on margin carries a high level of risk and may not be suitable for all investors. Leverage can work against you.
Stratos Markets Limited (tradu.com ):
CFDs are complex instruments and come with a high risk of losing money rapidly due to leverage. 65% of retail investor accounts lose money when trading CFDs with this provider. You should consider whether you understand how CFDs work and whether you can afford to take the high risk of losing your money.
Stratos Europe Ltd (tradu.com ):
CFDs are complex instruments and come with a high risk of losing money rapidly due to leverage. 66% of retail investor accounts lose money when trading CFDs with this provider. You should consider whether you understand how CFDs work and whether you can afford to take the high risk of losing your money.
Stratos Global LLC (tradu.com ):
Losses can exceed deposits.
Please be advised that the information presented on TradingView is provided to Tradu (‘Company’, ‘we’) by a third-party provider (‘TFA Global Pte Ltd’). Please be reminded that you are solely responsible for the trading decisions on your account. There is a very high degree of risk involved in trading. Any information and/or content is intended entirely for research, educational and informational purposes only and does not constitute investment or consultation advice or investment strategy. The information is not tailored to the investment needs of any specific person and therefore does not involve a consideration of any of the investment objectives, financial situation or needs of any viewer that may receive it. Kindly also note that past performance is not a reliable indicator of future results. Actual results may differ materially from those anticipated in forward-looking or past performance statements. We assume no liability as to the accuracy or completeness of any of the information and/or content provided herein and the Company cannot be held responsible for any omission, mistake nor for any loss or damage including without limitation to any loss of profit which may arise from reliance on any information supplied by TFA Global Pte Ltd.
The speaker(s) is neither an employee, agent nor representative of Tradu and is therefore acting independently. The opinions given are their own, constitute general market commentary, and do not constitute the opinion or advice of Tradu or any form of personal or investment advice. Tradu neither endorses nor guarantees offerings of third-party speakers, nor is Tradu responsible for the content, veracity or opinions of third-party speakers, presenters or participants.

LTCUSD H4 | Bearish drop aheadLTC/USD is rising towards the sell entry, which is an overlap resistanc,e and could drop from this level to the downside.
Sell entry is at 113.38, which is an overlap resistance.
Stop loss is at 118.49, which acts as a pullback resistance.
Take profit is at 107.19, whichis a multi swing low support.
High Risk Investment Warning
Trading Forex/CFDs on margin carries a high level of risk and may not be suitable for all investors. Leverage can work against you.
Stratos Markets Limited (tradu.com ):
CFDs are complex instruments and come with a high risk of losing money rapidly due to leverage. 65% of retail investor accounts lose money when trading CFDs with this provider. You should consider whether you understand how CFDs work and whether you can afford to take the high risk of losing your money.
Stratos Europe Ltd (tradu.com ):
CFDs are complex instruments and come with a high risk of losing money rapidly due to leverage. 66% of retail investor accounts lose money when trading CFDs with this provider. You should consider whether you understand how CFDs work and whether you can afford to take the high risk of losing your money.
Stratos Global LLC (tradu.com ):
Losses can exceed deposits.
Please be advised that the information presented on TradingView is provided to Tradu (‘Company’, ‘we’) by a third-party provider (‘TFA Global Pte Ltd’). Please be reminded that you are solely responsible for the trading decisions on your account. There is a very high degree of risk involved in trading. Any information and/or content is intended entirely for research, educational and informational purposes only and does not constitute investment or consultation advice or investment strategy. The information is not tailored to the investment needs of any specific person and therefore does not involve a consideration of any of the investment objectives, financial situation or needs of any viewer that may receive it. Kindly also note that past performance is not a reliable indicator of future results. Actual results may differ materially from those anticipated in forward-looking or past performance statements. We assume no liability as to the accuracy or completeness of any of the information and/or content provided herein and the Company cannot be held responsible for any omission, mistake nor for any loss or damage including without limitation to any loss of profit which may arise from reliance on any information supplied by TFA Global Pte Ltd.
The speaker(s) is neither an employee, agent nor representative of Tradu and is therefore acting independently. The opinions given are their own, constitute general market commentary, and do not constitute the opinion or advice of Tradu or any form of personal or investment advice. Tradu neither endorses nor guarantees offerings of third-party speakers, nor is Tradu responsible for the content, veracity or opinions of third-party speakers, presenters or participants.

LTCUSD 2D chartSleeping LTC working on the breakout. As btc.d is marking a higher low, we have no doubt ltc will make it back into the top 10 of the crypto market by market cap. solid fundamentals support this idea.

Join LTC/USDT’s Bull Run: MACD Confirms the Move!🚀 LTC/USDT "Litecoin vs Tether" Market Money Looting Plan
📌 Plan
🔹 Buyers enter on Simple Moving Average (SMA) pullback
🔹 Retest push adds momentum for confirmation
🔹 LSMA breakout confirms bullish continuation trend
🔹 MACD golden cross supports bullish strength and entry timing
🎯 Entry Plan
I’m applying a layered limit order strategy (multiple entries) to scale in smoothly instead of going all-in. My layers are:
116.00 💵
117.00 💵
118.00 💵
119.00 💵
120.00 💵
👉 You can always add or adjust based on your own style — layering is flexible.
🛡️ Risk Management
My protective Stop Loss (SL) is placed at 114.00 after breakout confirmation.
⚠️ Important: Risk management is personal. Adjust SL based on your own plan, style & tolerance.
🎯 Target / Exit Strategy
Upside police resistance 🚔 is waiting near 128.00 (strong resistance + overbought zone + possible liquidity trap). The smart play is to escape before getting caught — secure your profits and move! 💨
⚠️ Note: Exit levels are suggestions. You can adapt based on your own strategy.
🔗 Related Pairs to Watch
BINANCE:BTCUSDT → Leader of crypto moves, if Bitcoin pumps, LTC often follows.
BINANCE:ETHUSDT → Strong correlation with LTC, momentum shifts can echo.
BINANCE:BCHUSDT → Competes in similar use case narrative; price moves can align.
BINANCE:DOGEUSDT → Meme momentum sometimes drags mid-cap alts like LTC.
📊 Key Points Recap
✅ SMA Pullback + Retest push = Entry foundation
✅ LSMA breakout = Bullish confirmation
✅ MACD golden cross = Momentum backup
✅ Layered entries (116–120) for scaling in
✅ Exit around 128.00 before “trap zone”
✨ “If you find value in my analysis, a 👍 and 🚀 boost is much appreciated — it helps me share more setups with the community!”
#LTCUSDT #Litecoin #CryptoTrading #SwingTrade #DayTrade #TradingStrategy #TechnicalAnalysis #CryptoCommunity #Altcoins #ChartAnalysis
LTC SUPPORT AND RESISTACEHello friends
Due to the rise we had, the price is in a correction phase and now we have identified the support areas for you that can move to the set targets if they stabilize in these areas and the specified resistance is broken.
*Trade safely with us*

LTC CONFIRMATION $114 can get LTC to up $120LTC is at this moment at an important zone, and if it targets $114 with confirmation, it could break to up $120

Litecoin — Liquidity Hunt from $111 PainSergio Richi Premium ✅
CRYPTOCAP:LTC #Crypto #Litecoin — Liquidity Hunt from $111 Pain | Liquidity Zone: $1.2M long liquidation at $111 | September 06, 2025.
Price (Sept 6, 2025) : $111.68
Institutional Accumulation & Funds:
Key players stacking LTC as a treasury asset, tightening supply (77% long-term held, miner reserves ~2M, MWEB 183K+ locked):
• Luxxfolio Holdings: Filing $100M CAD (~$73M USD) prospectus to accumulate toward 1M LTC by 2026; views LTC as "hard currency." Backed by Charlie Lee, positions as first LTC treasury company.
• MEI Pharma: Holds 929,548 LTC in treasury.
• Grayscale Litecoin Trust: Enables institutional exposure; SEC delayed ETF rulings to Oct 2025. Coinbase holds 214K LTC.
💡 Entry & Exit:
Entry: $111.68 (spot long)
🎯 Take Profit: $130.00 (+16.41%)

LTCUSD H1 | Bearish Reversal off major resistanceBased on the H1 chart analysis, we can see that the price has rejected the sell entry which is a pullback resistance and could potentially drop from this level to the take profit.
Sell entry is at 115.05, which is a pullback resistance.
Stop loss is at 118.19, which is a pullback resistance.
Take profit is at 111.70, which is a pullback support.
High Risk Investment Warning
Trading Forex/CFDs on margin carries a high level of risk and may not be suitable for all investors. Leverage can work against you.
Stratos Markets Limited (tradu.com ):
CFDs are complex instruments and come with a high risk of losing money rapidly due to leverage. 65% of retail investor accounts lose money when trading CFDs with this provider. You should consider whether you understand how CFDs work and whether you can afford to take the high risk of losing your money.
Stratos Europe Ltd (tradu.com ):
CFDs are complex instruments and come with a high risk of losing money rapidly due to leverage. 66% of retail investor accounts lose money when trading CFDs with this provider. You should consider whether you understand how CFDs work and whether you can afford to take the high risk of losing your money.
Stratos Global LLC (tradu.com ):
Losses can exceed deposits.
Please be advised that the information presented on TradingView is provided to Tradu (‘Company’, ‘we’) by a third-party provider (‘TFA Global Pte Ltd’). Please be reminded that you are solely responsible for the trading decisions on your account. There is a very high degree of risk involved in trading. Any information and/or content is intended entirely for research, educational and informational purposes only and does not constitute investment or consultation advice or investment strategy. The information is not tailored to the investment needs of any specific person and therefore does not involve a consideration of any of the investment objectives, financial situation or needs of any viewer that may receive it. Kindly also note that past performance is not a reliable indicator of future results. Actual results may differ materially from those anticipated in forward-looking or past performance statements. We assume no liability as to the accuracy or completeness of any of the information and/or content provided herein and the Company cannot be held responsible for any omission, mistake nor for any loss or damage including without limitation to any loss of profit which may arise from reliance on any information supplied by TFA Global Pte Ltd.
The speaker(s) is neither an employee, agent nor representative of Tradu and is therefore acting independently. The opinions given are their own, constitute general market commentary, and do not constitute the opinion or advice of Tradu or any form of personal or investment advice. Tradu neither endorses nor guarantees offerings of third-party speakers, nor is Tradu responsible for the content, veracity or opinions of third-party speakers, presenters or participants.

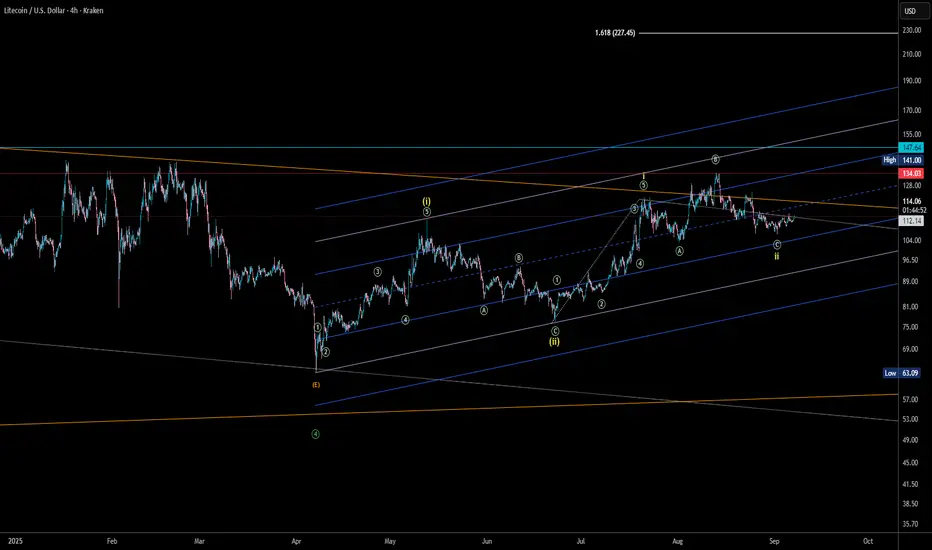
LTC 4H, 1-2 nestedLTC/USD pair seems to getting out of a running flat correction (the last ABC in light green), building a 1-2, 1-2 (nested 1-2). This structure shall give us some ripping candles to the upside very soon. The confirmation of the inner 1-2 is at the 1.6 = 227USD, if we don't build another 5 waves, 3 corrective to keep nesting.
Overall, if we pump, its a very bullish base to pump, if we make a 5 wave corrective and retrace, its just more bullish.
Historical tops where in November, just one time in May. Keep the eyes white open.
LTC reakout Loading? Targets $137 and Beyond After NFP Shock!Litecoin (LTC) continues to hold key support around $109 despite recent volatility, setting up for another upside push. With the Non-Farm Payrolls report coming in significantly weaker than expected, risk assets like crypto have gained a bullish backdrop as the Fed faces pressure to lean dovish. In this video, I break down LTC’s daily and 4-hour charts, highlighting the crucial demand and resistance levels that will shape the next move.
As long as LTC holds above $109, the structure remains constructive with targets toward $119.8, $123.4, and $137 in play. A breakout above those levels would open the path toward $168, aligning with the broader bullish setup across the crypto market. With Bitcoin showing resilience, Litecoin is well-positioned to continue its recovery in the sessions ahead.
LTCUSD H4 | Bearish Reversal at pullback resistanceLTC/USD is rising towards the sell entry which acts as a pullback resistance and could reverse from this level to the downside.
Sell entry is at 115.18, which is a pullback resistance.
Stop loss is at 123.05, which is a swing high resistance.
Take profit is at 103.51, which is a swing low support that aligns with the 78.6% Fibonacci projection.
High Risk Investment Warning
Trading Forex/CFDs on margin carries a high level of risk and may not be suitable for all investors. Leverage can work against you.
Stratos Markets Limited (tradu.com ):
CFDs are complex instruments and come with a high risk of losing money rapidly due to leverage. 65% of retail investor accounts lose money when trading CFDs with this provider. You should consider whether you understand how CFDs work and whether you can afford to take the high risk of losing your money.
Stratos Europe Ltd (tradu.com ):
CFDs are complex instruments and come with a high risk of losing money rapidly due to leverage. 66% of retail investor accounts lose money when trading CFDs with this provider. You should consider whether you understand how CFDs work and whether you can afford to take the high risk of losing your money.
Stratos Global LLC (tradu.com ):
Losses can exceed deposits.
Please be advised that the information presented on TradingView is provided to Tradu (‘Company’, ‘we’) by a third-party provider (‘TFA Global Pte Ltd’). Please be reminded that you are solely responsible for the trading decisions on your account. There is a very high degree of risk involved in trading. Any information and/or content is intended entirely for research, educational and informational purposes only and does not constitute investment or consultation advice or investment strategy. The information is not tailored to the investment needs of any specific person and therefore does not involve a consideration of any of the investment objectives, financial situation or needs of any viewer that may receive it. Kindly also note that past performance is not a reliable indicator of future results. Actual results may differ materially from those anticipated in forward-looking or past performance statements. We assume no liability as to the accuracy or completeness of any of the information and/or content provided herein and the Company cannot be held responsible for any omission, mistake nor for any loss or damage including without limitation to any loss of profit which may arise from reliance on any information supplied by TFA Global Pte Ltd.
The speaker(s) is neither an employee, agent nor representative of Tradu and is therefore acting independently. The opinions given are their own, constitute general market commentary, and do not constitute the opinion or advice of Tradu or any form of personal or investment advice. Tradu neither endorses nor guarantees offerings of third-party speakers, nor is Tradu responsible for the content, veracity or opinions of third-party speakers, presenters or participants.
