BTCUSD Buyers Defend Support — Market Targets $91,5K — $93K ZoneHello traders! Here’s my technical outlook on BTC/USD based on the current market structure. After a strong bullish recovery from the lower demand area near $83,500–$85,000, the price formed a steady impulsive move upward and entered a consolidation phase inside the marked range below the key $93,000 resistance level. Multiple breakout attempts from the range were followed by corrective pullbacks, showing active participation from both buyers and sellers. Once BTC broke above the range, the price initiated another bullish leg but quickly transitioned into a symmetrical triangle structure, defined by the descending Triangle Resistance Line and the rising Triangle Support Line. Currently, BTC is compressing inside this triangle while holding above the critical $89,500 Support Level, which is acting as the main short-term demand zone. Buyers continue to defend this area, keeping the bullish bias technically valid. The price is now approaching the upper triangle resistance again, hinting at a possible volatility expansion. As long as BTC remains above $89,500, the bullish scenario stays in play. I expect a breakout from the triangle toward TP1 at $91,500, followed by a potential continuation toward TP2 at $93,000, which is the major resistance zone. However, a breakdown below the triangle support would invalidate the setup and may trigger a deeper corrective move. For now, the market remains in a compression phase, preparing for its next directional impulse. Please share this idea with your friends and click Boost 🚀
Long!!

XAUUSD: Buying Pressure Aims for the $4,260 ResistanceHello everyone, here is my breakdown of the current Gold (XAUUSD) setup.
Market Analysis
Gold continues to trade within a broader bullish structure, with price action developing inside a well-defined ascending channel. After the previous impulse move higher, the market entered a consolidation phase below the $4,260 Resistance Zone, where sellers repeatedly defended the level. Earlier, XAUUSD produced a breakout from the upward channel structure and formed a temporary base above the mid-support area near $4,200, confirming that buyers still control the broader trend.
Currently, price is holding above the Triangle Support Line, showing that demand remains active on dips. The recent pullback into the $4,200–$4,190 support area looks corrective rather than impulsive, suggesting that bearish pressure remains limited for now. As long as price stays above this triangle support, the bullish market structure remains valid.
My Scenario & Strategy
My scenario is bullish while XAUUSD holds above the $4,200 Support Zone and respects the Triangle Support Line. I expect price to stabilize in this area and attempt a renewed push toward the $4,260 Resistance Zone, which is the key barrier for continuation.
Therefore, a clean breakout above $4,260 would confirm bullish continuation and open the door for further upside expansion toward higher historical levels. However, if price fails to hold the triangle support and breaks below $4,190–$4,180, this would weaken the bullish structure and could trigger a deeper corrective pullback toward the lower channel boundary. For now, the market maintains a long bias, with the main objective being a renewed test and potential breakout of the $4,260 resistance zone.
That’s the setup I’m tracking. Thank you for your attention, and always manage your risk.

BTCUSDT Long: Demand Line Holds — Path Toward 96,500 Opens UpHello, traders! BTCUSDT is respecting the Triangle Demand Line after completing a full bearish cycle inside the descending channel earlier. Sellers maintained control for an extended period, pushing price steadily lower until it reached the pivot point near 88,800, where buyers finally stepped in and broke the bearish structure. This pivot zone became the foundation for a new bullish sequence, with price forming higher lows along the Triangle Demand Line. After the breakout from the descending channel, BTCUSDT entered a consolidation Range, where multiple fake breakouts occurred on both sides. This range acted as a transition phase before buyers regained momentum. Following the range, price made another bullish attempt, but faced resistance near the 96,500 Supply Zone — an area where sellers have shown strong activity in the past.
Currently, BTCUSDT is moving toward the Triangle Demand Line once again, retesting it as support. As long as buyers defend this trendline and price remains above the Demand Zone at 88,800, the bullish structure stays intact.
My scenario: if the trendline holds, BTCUSDT may bounce and continue moving toward the 96,500 resistance, which remains the main upside target for the current bullish leg. A clean breakout above 96,500 would open the path for stronger continuation. However, if price fails to hold the demand line, a corrective pullback toward the lower demand region becomes possible. For now, the market structure remains bullish while price respects the Triangle Demand Line. Manage your risk!

AUDUSD Set to Rally as Dollar Softens Ahead of Fed Cut!Hey Traders, in today's trading session we are monitoring AUDUSD for a buying opportunity around the 0.66000 zone.
AUDUSD is trading in an uptrend and is currently in a correction phase in which it is approaching the 0.66000 support and resistance area.
On the fundamental side, the U.S. Dollar continues to weaken as markets front-run the expected Fed rate cut, and traders increasingly price in a more dovish policy stance going into the next FOMC meeting.
This broad Dollar softness supports upside momentum on AUDUSD, especially as risk sentiment improves.
Trade safe,
Joe.

EURUSD: Price Holds Channel Support, Aiming for 1.1680Hello everyone, here is my breakdown of the current EURUSD setup.
Market Analysis
EURUSD remains in a broader bullish structure, with recent price action developing inside a well-defined ascending channel. After a strong impulsive rally, the pair broke above the previous consolidation zone and confirmed the breakout with a successful retest of the 1.16100 support zone, which now acts as a key demand area. The market then continued higher, forming higher highs and higher lows along the channel structure.
Currently, price is consolidating below the 1.16800 resistance zone, which represents a major supply area and the upper boundary of the current bullish leg. Despite short-term consolidation, buyers continue to defend the support zone, keeping bullish pressure intact.
My Scenario & Strategy
My scenario remains bullish as long as EURUSD holds above the 1.16100–1.16200 support zone and respects the ascending channel structure. I expect the price to continue pressing toward the 1.16800 resistance, which is the next major target for buyers. A clean and sustained breakout above this resistance would open the way for further upside continuation and new highs.
However, if price fails to break the resistance and shows strong rejection, a short-term pullback toward the mid-channel or back into the support zone is possible. Still, the overall bullish structure remains valid as long as the lower channel boundary holds. For now, the market supports a long bias, with the main objective being a retest of the 1.16800 resistance zone.
That's the setup I'm tracking. Thank you for your attention, and always manage your risk.

XAUUSD Long: Demand Holds — Price Aiming for $4,260 RetestHello, traders! The current price action on GOLD (XAUUSD) is developing within a clearly defined ascending channel, showing that the broader bullish structure remains intact despite recent corrective movements. Earlier, the market formed a Double Top pattern near the upper Supply Zone around $4,260, which triggered a bearish reaction and a downside breakout from that distribution phase. After this rejection, price moved into a corrective decline, respecting the Triangle Supply and Demand lines, where multiple breakouts confirmed increasing volatility and active participation from both buyers and sellers. Following the corrective phase, Gold reached a key Pivot Point near the lower Triangle Demand Line, where strong buying interest appeared and initiated a bullish reversal. From this base, price broke back above resistance and entered the current Ascending Channel, forming higher highs and higher lows.
Currently, XAUUSD is consolidating near the $4,190–$4,200 Demand Zone, where buyers are actively defending the structure. The market is holding above channel support, suggesting that bullish momentum is stabilizing after the pullback.
My scenario remains bullish as long as price stays above the highlighted Demand Zone around $4,180–$4,190 and continues to respect the lower boundary of the ascending channel. I expect Gold to gradually build momentum and attempt another move toward the $4,260 Resistance level, which represents the next major target and the top of the recent supply area. A confident breakout above this zone would signal trend continuation and open the door for further upside. However, a failure to hold current demand could trigger a deeper correction back toward the lower channel area. For now, the structure favors buyers, with $4,260 as the main upside objective. Manage your risk!

EURUSD Rising Channel Intact as Price Targets 1.16800 ResistanceHello traders! Here’s my technical outlook on EUR/USD based on the current market structure. After an earlier breakout from the lower consolidation area, the price entered a steady ascending channel, forming a sequence of higher highs and higher lows while respecting the rising Support Line. The previous bullish impulse was followed by a corrective phase, where EURUSD consolidated inside the marked range, allowing the market to release pressure before continuing higher. After the range breakout, the pair resumed its upward movement and is now trading inside a new rising price channel. At the moment, price is holding above the 1.16400 support level, which is acting as a key demand area and the lower boundary of the current ascending structure. Buyers continue to defend this zone, keeping the short-term bullish bias intact. The market is now pressing toward the major 1.16800 resistance level, which aligns with the upper channel boundary and serves as the next critical obstacle for the bulls. As long as EURUSD remains above the 1.16400 support, the bullish scenario stays valid. I expect a continuation toward the TP1 target at 1.16800, where strong seller reaction is likely. A clean breakout above this resistance could open the door for further upside continuation. However, a failure to hold the current support may lead to a deeper pullback toward the lower channel area. For now, the structure favors buyers, with resistance at 1.16800–1.17000 as the main upside objective. Please share this idea with your friends and click Boost 🚀

XAUUSD Bullish Trend in Play — Path Open Toward 4,300 TargetHello traders! Here’s my technical outlook on XAU/USD (Gold) based on the current market structure. Gold remains in a broader bullish trend, supported by a clearly defined rising Trend Line that has guided price action since the beginning of the impulsive move. After the initial breakout from the Support Level, the market formed a well-structured range, followed by a corrective pullback and another consolidation phase, confirming healthy bullish rotation. Price is currently trading above the key Support Level near 4,140, while attempting to stabilize above the rising Support Line, which keeps buyers in control of the short-term structure. The recent breakout from the second range indicates renewed bullish momentum, with price now approaching the major Resistance Level around 4,260–4,270. As long as Gold holds above the support zone and respects the ascending trendline, the bullish scenario remains valid. The structure suggests continued pressure toward the upside, with TP1 positioned near 4,300, which aligns with the next key resistance area. A clean breakout above this level could open the door for further trend continuation and higher upside targets. However, a failure to hold the Support Line could lead to a deeper pullback toward the lower support zone. For now, the technical structure favors the buyers, with bulls aiming for a retest and breakout of the 4,260–4,300 resistance zone. Please share this idea with your friends and click Boost 🚀

GBPNZD: Bullish Forecast & Bullish Scenario
Balance of buyers and sellers on the GBPNZD pair, that is best felt when all the timeframes are analyzed properly is shifting in favor of the buyers, therefore is it only natural that we go long on the pair.
Disclosure: I am part of Trade Nation's Influencer program and receive a monthly fee for using their TradingView charts in my analysis.
❤️ Please, support our work with like & comment! ❤️

EURUSD My Opinion! BUY!
My dear followers,
I analysed this chart on EURUSD and concluded the following:
The market is trading on 1.1644 pivot level.
Bias - Bullish
Technical Indicators: Both Super Trend & Pivot HL indicate a highly probable Bullish continuation.
Target - 1.1658
About Used Indicators:
A super-trend indicator is plotted on either above or below the closing price to signal a buy or sell. The indicator changes color, based on whether or not you should be buying. If the super-trend indicator moves below the closing price, the indicator turns green, and it signals an entry point or points to buy.
Disclosure: I am part of Trade Nation's Influencer program and receive a monthly fee for using their TradingView charts in my analysis.
———————————
WISH YOU ALL LUCK

GBPUSD Set To Grow! BUY!
My dear friends,
My technical analysis for GBPUSD is below:
The market is trading on 1.3315 pivot level.
Bias - Bullish
Technical Indicators: Both Super Trend & Pivot HL indicate a highly probable Bullish continuation.
Target - 1.3332
Recommended Stop Loss - 1.3305
About Used Indicators:
A pivot point is a technical analysis indicator, or calculations, used to determine the overall trend of the market over different time frames.
Disclosure: I am part of Trade Nation's Influencer program and receive a monthly fee for using their TradingView charts in my analysis.
———————————
WISH YOU ALL LUCK

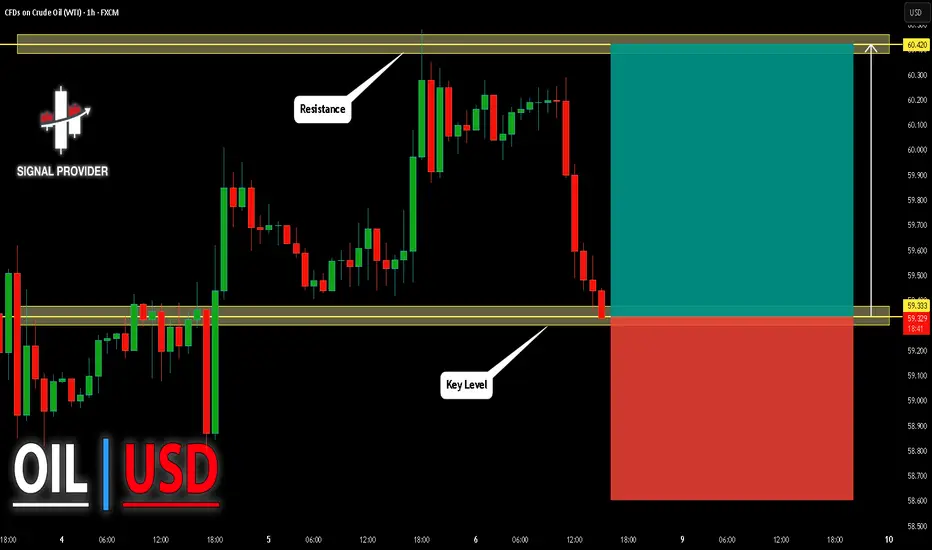
USOIL Will Go Up From Support! Buy!
Here is our detailed technical review for USOIL.
Time Frame: 1h
Current Trend: Bullish
Sentiment: Oversold (based on 7-period RSI)
Forecast: Bullish
The market is approaching a significant support area 59.333.
The underlined horizontal cluster clearly indicates a highly probable bullish movement with target 60.420 level.
P.S
Overbought describes a period of time where there has been a significant and consistent upward move in price over a period of time without much pullback.
Like and subscribe and comment my ideas if you enjoy them!
GBPCAD Will Explode! BUY!
My dear subscribers,
This is my opinion on the GBPCAD next move:
The instrument tests an important psychological level 1.8412
Bias - Bullish
Technical Indicators: Supper Trend gives a precise Bullish signal, while Pivot Point HL predicts price changes and potential reversals in the market.
Target - 1.8495
About Used Indicators:
On the subsequent day, trading above the pivot point is thought to indicate ongoing bullish sentiment, while trading below the pivot point indicates bearish sentiment.
Disclosure: I am part of Trade Nation's Influencer program and receive a monthly fee for using their TradingView charts in my analysis.
———————————
WISH YOU ALL LUCK

BTCUSD Pauses at Structure Top — Bulls Aim for 95,500 RetestHello traders! Here is my breakdown of the current BTCUSD setup. After a strong bearish phase, Bitcoin found support near the major Support Level around $89,100. Before reaching this zone, price was trading inside a broad descending channel, where both the Resistance Line and Support Line guided the downtrend. A fake breakout occurred near the lower boundary, showing early buyer interest, but overall momentum remained bearish until price reached the support. From there, BTC formed a clear sideways Range, signaling accumulation before a reversal attempt. Once buyers gained strength, price broke out of the range and shifted into a bullish structure. BTC began climbing within a rising wedge-like channel, respecting both the ascending Support Line and the diagonal Resistance Line. Along the way, the market formed multiple breakouts and fake breakouts, confirming active participation from both sides. However, buyers consistently defended the rising trendline, maintaining higher lows while approaching the key horizontal Resistance Level near $95,500. Currently, BTCUSD is pulling back slightly after touching the wedge resistance. As long as price holds above the ascending support and stays above $89,100, the bullish structure remains intact. My scenario suggests a potential continuation toward TP1 → $95,500 upon a successful rebound from the local support. If the market breaks below the rising structure, however, a deeper correction may unfold before any further upward attempt. For now, buyers are favored while the price remains inside the ascending channel. Please share this idea with your friends and click Boost 🚀

GBPAUD Will Go Higher From Support! Long!
Please, check our technical outlook for GBPAUD.
Time Frame: 4h
Current Trend: Bullish
Sentiment: Oversold (based on 7-period RSI)
Forecast: Bullish
The market is approaching a key horizontal level 2.007.
Considering the today's price action, probabilities will be high to see a movement to 2.020.
P.S
We determine oversold/overbought condition with RSI indicator.
When it drops below 30 - the market is considered to be oversold.
When it bounces above 70 - the market is considered to be overbought.
Like and subscribe and comment my ideas if you enjoy them!

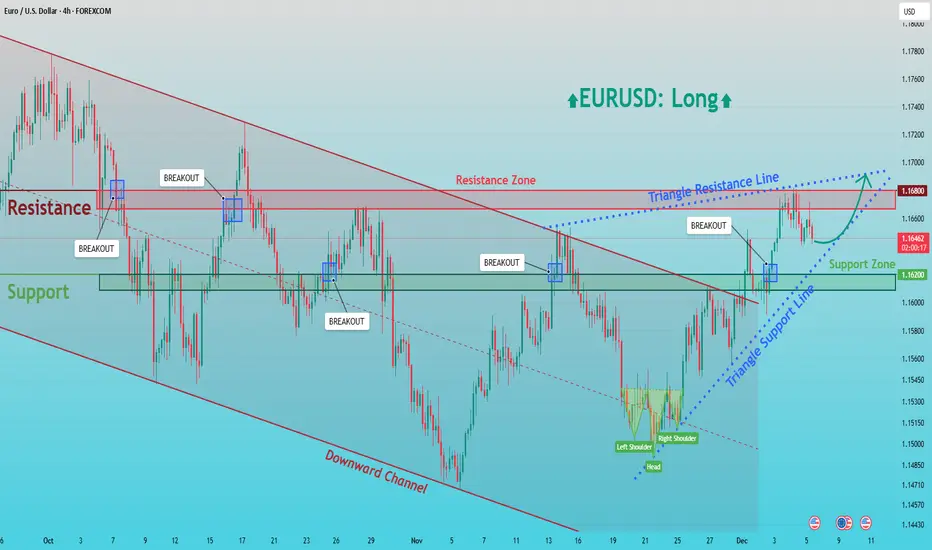
EURUSD: Buyers Push Toward the 1.1680 Triangle Resistance BreakHello everyone, here is my breakdown of the current EURUSD setup.
Market Analysis
EURUSD is transitioning out of a prolonged bearish phase that previously unfolded inside a well-defined downward channel. After forming a major swing low in early November, the pair initiated a recovery and gradually shifted into a corrective bullish structure. Price is now trading inside a developing triangle formation, defined by the ascending Triangle Support Line and the descending Triangle Resistance Line. During the decline, the market repeatedly respected the key Support Zone around 1.16200, which acted as a strong demand area and triggered bullish reactions on multiple occasions. Most recently, EURUSD completed a clear Head and Shoulders reversal pattern near the lower boundary, signaling exhaustion of sellers and the start of buyer control. Following this structure, price broke above the support zone and is now consolidating above it, confirming the zone as a valid demand base.
Currently, the pair is approaching the major Resistance Zone at 1.16800, which also aligns with the descending triangle resistance. This area remains the key upside barrier for buyers and represents a critical decision point for the market.
My Scenario & Strategy
My scenario is bullish, as long as price remains above the 1.16200 Support Zone and continues respecting the ascending Triangle Support Line. I expect EURUSD to maintain upward pressure and attempt a breakout toward the 1.16800 resistance, which is the next major supply area. A clean breakout above this zone would confirm bullish continuation and open the way for further upside toward higher targets.
However, if price reaches the resistance and shows strong rejection, a corrective pullback back toward the 1.16200 demand may occur. Still, the overall bullish structure remains valid as long as the support zone holds. For now, market conditions favor a long bias with focus on a breakout attempt toward the 1.16800 resistance zone.
That's the setup I'm tracking. Thank you for your attention, and always manage your risk.
GOLD The Target Is UP! BUY!
My dear subscribers,
GOLD looks like it will make a good move, and here are the details:
The market is trading on 4206.0 pivot level.
Bias - Bullish
My Stop Loss - 4196.6
Technical Indicators: Both Super Trend & Pivot HL indicate a highly probable Bullish continuation.
Target - 4221.3
About Used Indicators:
The average true range (ATR) plays an important role in 'Supertrend' as the indicator uses ATR to calculate its value. The ATR indicator signals the degree of price volatility.
Disclosure: I am part of Trade Nation's Influencer program and receive a monthly fee for using their TradingView charts in my analysis.
———————————
WISH YOU ALL LUCK

Dow Jones is approaching an important support! Hey Traders, in today's trading session we are monitoring US30 for a buying opportunity around 47,350 zone, Dow Jones is trading in an uptrend and currently is in a correction phase in which it is approaching the trend at 43.350 support and resistance area.
Trade safe, Joe.

GBPUSD Poised to Rally as USD Weakens Into December CutIn today's trading session we are monitoring GBPUSD for a buying opportunity around the 1.32900 zone.
GBPUSD remains in a clear uptrend, and is currently in a correction phase, approaching the 1.32900 support and resistance area, where buyers may step back in.
On the fundamental side, the US Dollar continues to weaken as the market increasingly prices in a December rate cut from the Federal Reserve. Recent US data has been softening, adding pressure on the Fed and reinforcing expectations for looser monetary policy.
A dovish Fed outlook = bearish USD, which naturally supports GBPUSD upside.
Trade safe,
Joe.

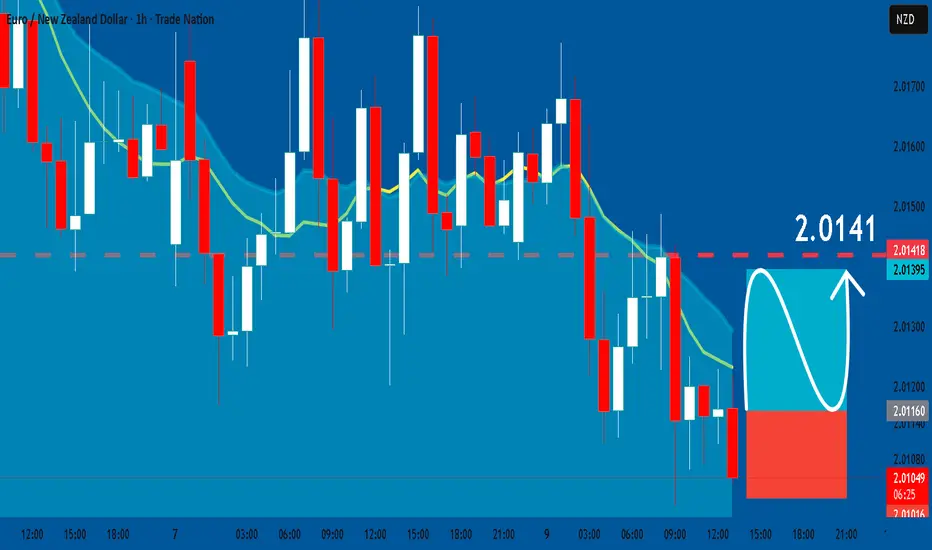
EURNZD: Long Signal Explained
EURNZD
- Classic bullish pattern
- Our team expects retracement
SUGGESTED TRADE:
Swing Trade
Buy EURNZD
Entry - 2.0115
Stop - 2.0101
Take - 2.0141
Our Risk - 1%
Start protection of your profits from lower levels
Disclosure: I am part of Trade Nation's Influencer program and receive a monthly fee for using their TradingView charts in my analysis.
❤️ Please, support our work with like & comment! ❤️
EURAUD What Next? BUY!
My dear subscribers,
This is my opinion on the EURAUD next move:
The instrument tests an important psychological level 1.7532
Bias - Bullish
Technical Indicators: Supper Trend gives a precise Bullish signal, while Pivot Point HL predicts price changes and potential reversals in the market.
Target - 1.7554
My Stop Loss - 1.7521
About Used Indicators:
On the subsequent day, trading above the pivot point is thought to indicate ongoing bullish sentiment, while trading below the pivot point indicates bearish sentiment.
Disclosure: I am part of Trade Nation's Influencer program and receive a monthly fee for using their TradingView charts in my analysis.
———————————
WISH YOU ALL LUCK

NZDCAD: Long Signal with Entry/SL/TP
NZDCAD
- Classic bullish formation
- Our team expects pullback
SUGGESTED TRADE:
Swing Trade
Long NZDCAD
Entry - 0.7976
Sl - 0.7963
Tp - 0.8000
Our Risk - 1%
Start protection of your profits from lower levels
Disclosure: I am part of Trade Nation's Influencer program and receive a monthly fee for using their TradingView charts in my analysis.
❤️ Please, support our work with like & comment! ❤️

AUDCAD: Bullish Continuation is Expected! Here is Why:
Balance of buyers and sellers on the AUDCAD pair, that is best felt when all the timeframes are analyzed properly is shifting in favor of the buyers, therefore is it only natural that we go long on the pair.
Disclosure: I am part of Trade Nation's Influencer program and receive a monthly fee for using their TradingView charts in my analysis.
❤️ Please, support our work with like & comment! ❤️
