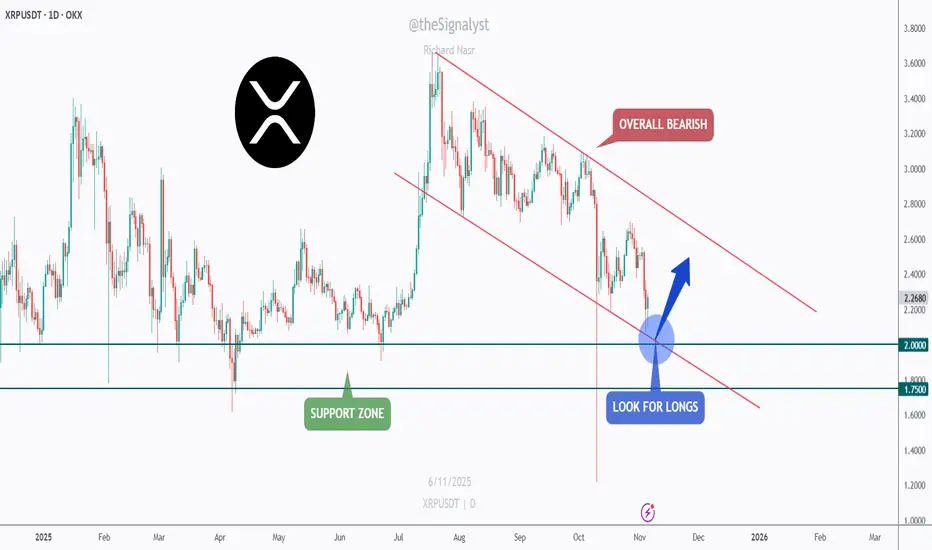
XRP - Watching the Confluence Zone for a Bullish Rebound!📉XRP has been in a clear bearish channel for months , forming consistent lower highs and lower lows.
However, the current structure is approaching a critical confluence zone, where the lower bound of the red channel meets the major green support area between $1.75 and $2.00.
⚔️As long as this intersection holds, I’ll be looking for potential long opportunities, anticipating a short-term bullish correction toward the upper boundary of the channel.
This setup offers a clean risk-to-reward opportunity if the bulls manage to defend the zone and regain momentum.
If the support gives way, further downside could follow, but for now, this area remains a key decision point for XRP’s next move.
⚠️ Disclaimer: This is not financial advice. Always do your own research and manage risk properly.
📊All Strategies Are Good; If Managed Properly!
~Richard Nasr
Long!!!!
EURUSD: Rebound Phase Developing From 1.1510 Support ZoneHello everyone, here is my breakdown of the current Euro setup.
Market Analysis
EURUSD has been forming a complex market structure, transitioning through several distinct phases. Initially, the pair traded within a Range Zone, showing indecision between buyers and sellers. A strong bullish breakout from the range led to the creation of an Upward Channel, where buyers maintained momentum until the price reached the 1.1660 Resistance Zone. This level acted as a significant supply area, resulting in multiple rejection points and eventually a bearish breakout from the channel.
Recently, EURUSD began consolidating in a Descending Triangle Pattern, with the Triangle Resistance Line serving as a dynamic barrier against bullish attempts and the Triangle Support Line acting as a demand zone. Currently, the pair is testing this support zone around 1.1500–1.1480, which has already provided several short-term rebounds. A clear break below this area could confirm a continuation of the bearish structure, potentially pushing price lower toward 1.1450 and even 1.1400. On the other hand, a rebound from the support line with strong bullish momentum could signal the beginning of a reversal move, targeting the resistance levels at 1.1530–1.1540.
My Scenario & Strategy
From my perspective, EURUSD sits at a pivotal technical point. If the Triangle Support Line continues to hold, I expect a bullish breakout attempt above the triangle’s resistance, confirming a possible trend reversal toward higher levels. Short-term traders could look for long entries near the 1.1500 support zone with tight stop-losses below 1.1480, aiming for a retest of 1.1530–1.1540. However, if the pair breaks and closes below 1.1480, it would invalidate the bullish scenario and likely trigger renewed selling pressure toward 1.1450–1.1400. For now, I remain cautiously bullish, expecting a potential rebound from the support base before a decisive move unfolds.
That's the setup I'm tracking. Thank you for your attention, and always manage your risk.

XAUUSD: Bulls Defend Channel Support, Eyeing $4,130 ReboundHello everyone, here is my breakdown of the current Gold setup.
Market Analysis
Gold (XAUUSD) continues to trade within a well-defined upward channel, showing a clear structure of higher highs and higher lows. After a series of breakouts and retests, the price recently tested the channel support and the key demand zone around $3,900–3,920, confirming buyers’ activity in that area.
Currently, previous fake breakout above the $4,130 resistance area led to a pullback, but the market is now stabilizing and showing early signs of bullish momentum. This zone aligns with both the lower boundary of the ascending channel and a horizontal support area — a technically strong confluence that often attracts long positions.
My Scenario & Strategy
The current setup suggests that as long as the $3,900 support holds, gold remains in a bullish structure. A confirmed bounce from the lower channel boundary would likely trigger a new impulsive move toward the $4,130 resistance zone, which is also the previous breakout area. If buyers manage to break and hold above that resistance, the next potential upside target is around $4,200–$4,250, aligning with the upper boundary of the channel.
My strategy here is to look for bullish confirmation signals (candlestick patterns or volume breakout) near the support zone and aim for long entries with targets toward $4,130 and higher. A daily close below $3,880 would invalidate this scenario and open the door for a deeper correction.
That's the setup I'm tracking. Thank you for your attention, and always manage your risk.

BTCUSD Rebounds from Support — Bulls Eye $106K Recovery MoveHello traders, I want to share with you my opinion about Bitcoin (BTCUSD). Bitcoin has been experiencing a prolonged corrective phase following a previous bullish rally. The market recently retested the Buyer Zone near $103,800–$104,200, where strong demand has once again emerged. This area has historically acted as a reliable support level, preventing deeper declines and triggering multiple rebounds. Currently, the structure is forming a descending wedge pattern, characterized by converging resistance and support lines. This technical formation often signals potential bullish reversals, especially when it appears near a key demand zone. The latest test of the lower wedge boundary coincided with the Support Level, resulting in a sharp reaction from buyers. From my perspective, as long as the price holds above the Buyer Zone, the probability of a bullish breakout increases. A confirmed breakout above the resistance line would likely validate a move toward the $106,000 TP1 level, which aligns with previous local highs and the upper boundary of the pattern. However, if BTC fails to break the resistance and falls back below $103,800, sellers could temporarily regain control, pushing the price lower before another accumulation phase develops. Overall, the current setup favors the bulls, with clear structural support and a tightening pattern suggesting that Bitcoin may soon attempt a rebound toward $106,000 and potentially higher levels. Please share this idea with your friends and click Boost 🚀

GBP/AUD BUYERS WILL DOMINATE THE MARKET|LONG
GBP/AUD SIGNAL
Trade Direction: long
Entry Level: 2.006
Target Level: 2.031
Stop Loss: 1.989
RISK PROFILE
Risk level: medium
Suggested risk: 1%
Timeframe: 1D
Disclosure: I am part of Trade Nation's Influencer program and receive a monthly fee for using their TradingView charts in my analysis.
✅LIKE AND COMMENT MY IDEAS✅

GBP/CHF BULLISH BIAS RIGHT NOW| LONG
Hello, Friends!
GBP/CHF pair is in the downtrend because previous week’s candle is red, while the price is clearly falling on the 1D timeframe. And after the retest of the support line below I believe we will see a move up towards the target above at 1.075 because the pair oversold due to its proximity to the lower BB band and a bullish correction is likely.
Disclosure: I am part of Trade Nation's Influencer program and receive a monthly fee for using their TradingView charts in my analysis.
✅LIKE AND COMMENT MY IDEAS✅

Bitcoin TA and ALT coin TAHi guys,
I hope you enjoyed the video! Its going to be a very existing next 3 months!

Exide india in breaout? As per my analsyzi exide india i string support , finishes its retracement. 223 is my analsis tArget

JPN225 Long• Trend context: This setup aligns with the H4 uptrend, supported by a strong upward impulse.
• Momentum: M15, M30, and H1 are oversold, suggesting a potential rebound from current levels.
• Structure: A clear double bottom has formed on both M15 and M30, with RSI divergence of 9 points confirming bullish momentum.
• Support zone: Price is holding above strong support at the previous week’s high, a key level that continues to attract buyers.
• Pattern signal: A bullish shark pattern is forming, indicating strong reversal potential.
• Risk management: Stop loss placed below 50,700 to protect capital.
• Target: First target when M15 turns overbought or when price retests 52,600 highs.

NZDJPY: Bullish Continuation is Highly Probable! Here is Why:
The recent price action on the NZDJPY pair was keeping me on the fence, however, my bias is slowly but surely changing into the bullish one and I think we will see the price go up.
Disclosure: I am part of Trade Nation's Influencer program and receive a monthly fee for using their TradingView charts in my analysis.
❤️ Please, support our work with like & comment! ❤️

EURCHF: Bullish Continuation & Long Trade
EURCHF
- Classic bullish pattern
- Our team expects retracement
SUGGESTED TRADE:
Swing Trade
Buy EURCHF
Entry - 0.9292
Stop - 0.9285
Take - 0.9306
Our Risk - 1%
Start protection of your profits from lower levels
Disclosure: I am part of Trade Nation's Influencer program and receive a monthly fee for using their TradingView charts in my analysis.
❤️ Please, support our work with like & comment! ❤️

USOIL BULLS ARE STRONG HERE|LONG
USOIL SIGNAL
Trade Direction: long
Entry Level: 60.06
Target Level: 60.65
Stop Loss: 59.67
RISK PROFILE
Risk level: medium
Suggested risk: 1%
Timeframe: 2h
Disclosure: I am part of Trade Nation's Influencer program and receive a monthly fee for using their TradingView charts in my analysis.
✅LIKE AND COMMENT MY IDEAS✅

EUR/CAD SENDS CLEAR BULLISH SIGNALS|LONG
Hello, Friends!
We are now examining the EUR/CAD pair and we can see that the pair is going down locally while also being in a downtrend on the 1W TF. But there is also a powerful signal from the BB lower band being nearby indicating that the pair is oversold so we can go long from the support line below and a target at 1.637 level.
Disclosure: I am part of Trade Nation's Influencer program and receive a monthly fee for using their TradingView charts in my analysis.
✅LIKE AND COMMENT MY IDEAS✅

BTCUSD Long: Buyers Defend Demand Zone, Targeting $110,400 MoveHello traders! Bitcoin (BTCUSD) is currently trading within a key structural zone, showing signs of balance between demand and supply after a volatile move. Following the previous sell-off from the $116,000 Supply Area, the price found strong buying pressure near the $106,500 Demand Zone, which coincides with the ascending Demand Line that has been acting as dynamic support for several weeks.
After multiple rejections from the Supply Line, BTC has recently formed a fresh pivot low at the Demand Line — an area that has historically triggered bullish reactions. This reaction zone is particularly significant because it aligns with a confluence of horizontal and diagonal support, increasing the probability of a bounce scenario.
In the short term, I’m watching for a potential bullish rebound from the $106,500–$107,000 zone. A confirmed bounce with strong bullish candles could trigger a move toward the next pivot resistance around $110,400, which sits near the descending Supply Line. This would be the first major target for any short-term long positions.However, if buyers fail to sustain above the Demand Line, a breakdown below $106,000 would invalidate the bullish setup and potentially open the path for a deeper correction toward the next support levels. For now, the most probable scenario suggests a technical rebound toward $110,400, as long as the Demand Line continues to hold. I’ll be watching for confirmation signals such as higher lows or bullish breakouts to enter a long position. Manage your risk!

SILVER Will Go Higher! Long!
Take a look at our analysis for SILVER.
Time Frame: 1D
Current Trend: Bullish
Sentiment: Oversold (based on 7-period RSI)
Forecast: Bullish
The market is approaching a key horizontal level 4,796.6.
Considering the today's price action, probabilities will be high to see a movement to 5,274.4.
P.S
Overbought describes a period of time where there has been a significant and consistent upward move in price over a period of time without much pullback.
Like and subscribe and comment my ideas if you enjoy them!

AUDUSD Will Go Up! Buy!
Please, check our technical outlook for AUDUSD.
Time Frame: 3h
Current Trend: Bullish
Sentiment: Oversold (based on 7-period RSI)
Forecast: Bullish
The market is approaching a significant support area 0.650.
The underlined horizontal cluster clearly indicates a highly probable bullish movement with target 0.654 level.
P.S
Please, note that an oversold/overbought condition can last for a long time, and therefore being oversold/overbought doesn't mean a price rally will come soon, or at all.
Like and subscribe and comment my ideas if you enjoy them!

GBPCHF Is Bullish! Long!
Take a look at our analysis for GBPCHF.
Time Frame: 3h
Current Trend: Bullish
Sentiment: Oversold (based on 7-period RSI)
Forecast: Bullish
The price is testing a key support 1.056.
Current market trend & oversold RSI makes me think that buyers will push the price. I will anticipate a bullish movement at least to 1.059 level.
P.S
We determine oversold/overbought condition with RSI indicator.
When it drops below 30 - the market is considered to be oversold.
When it bounces above 70 - the market is considered to be overbought.
Like and subscribe and comment my ideas if you enjoy them!

Gold Nears Resistance — Buyers Target $4,130 BreakoutHello traders, here’s my current outlook on Gold (XAUUSD). The market structure shows that Gold has recently shifted from a sharp bearish phase into a short-term recovery pattern, finding solid demand near the $3,940–$3,950 Buyer Zone. After the last strong drop from the $4,130 Resistance Level, price stabilized within this accumulation area and began forming an ascending structure supported by a clear Support Line. Currently, Gold is trading inside a rising wedge pattern — a signal of a tightening market where buyers are gradually gaining ground. The Resistance Line near $4,050 represents a short-term barrier, and a confirmed breakout above this level could open the way for a move toward the $4,130 Resistance Zone (TP1), which aligns with the previous Seller Zone. From my perspective, as long as the price remains above the $3,940–$3,950 Support Zone, the bullish bias remains valid. A successful breakout above $4,050 would likely confirm the continuation of the current upward momentum, targeting $4,130. However, if the price fails to break above resistance and falls below the ascending support line, a short-term pullback toward the Buyer Zone could occur before any new bullish wave develops. In my opinion, the market structure currently favors buyers, with strong support underpinning the move. Therefore, I’m expecting a potential bullish continuation toward $4,130 as the next key target.

BITCOIN – LONG - 105K SWEEP BEFORE WE LEAPTraders,
In my latest analysis I said that Bitcoin will reach 117.000-117.500 before a bigger dump. Price didn't reach those levels yet, and dumped instantly instead.
However, the main thesis still stands: price is likely to reach that zone (117.000-117.500) before a larger reversal down. But before that, I expect a short squeeze beginning at $105.000.
Why I Expect a Squeeze
During the Asia session, new leveraged short exposure was built. Open Interest (OI) increased while Net Shorts rose, showing that traders were adding fresh short positions.
Around 107,000–107,500, both Spot CVD and Coin-Margined CVD are showing bullish divergence. Sellers are active, but price is holding, which indicates absorption.
Stablecoin-Margined CVD in the same range shows exhaustion, suggesting selling pressure is fading.
At New York open, OI continued to rise together with Net Longs, meaning aggressive longs are now fading into the short exposure created during Asia.
What This Means
Historically, the London and New York sessions tend to sweep Asia’s positioning. When Asia builds short exposure, the later sessions often push price higher to liquidate those shorts. This often results in a short squeeze, which aligns with what we may be seeing now.
Determining the Next Move Down
Before deciding if price extends lower first, we must identify the variables of probability (VOP) — the “magnets” that increase the likelihood of a lower sweep.
1. Weak Thursday Low
There is a weak low that has not been properly tested. In TPO (Time Price Opportunity) terms, a weak low forms when price finds temporary support without strong buying response. Such levels often get revisited.
2. Unswept Sunday 19 Oct Low
There is also an unswept Sunday low from 19 October. Sunday lows are often swept because weekend liquidity is thin and order books are shallow. When liquidity returns during the week, those inefficient areas tend to get filled.
Imbalances and Volume Gaps Below
Next we look for gaps, imbalances, or LVNs (Low Volume Nodes) — areas where trading activity was limited or one-sided. These zones often attract price because markets seek balance.
Many traders identify “fair value gaps” by looking at candles, but that only shows part of the picture. To locate the real inefficiency, we need to look inside the candles using order flow or a Fixed Range Volume Profile (FRVP) to find the exact levels of bid-ask imbalance.
Volume Profile and Fibonacci Confluence
Drawing the Fixed Range Volume Profile from the impulse move below the Sunday 19 Oct low shows a clear imbalance at 105,070.
Checking confluences:
The 0.786 Fibonacci retracement (low to high) aligns exactly with 105,070
The 0.886 retracement (higher low to high) also aligns exactly with 105,070
Fibonacci extensions (1.113 and 1.272) both target around 105,000
The 0.618 extension also lands near 105,000
Thesis Summary
Based on all data and confluence:
Price likely dips to sweep the weak 30 Oct low and the 19 Oct Sunday low
Target zone: LVN / imbalance near 105,000
Expect a liquidity grab that traps late shorts and shakes out weak longs
After that, expect a reversal toward 117,000–117,500, where the next major liquidity pool lies
Why a Lower Sweep Is Expected
The Asia session built significant short exposure
There is an inefficiency and low-volume magnet around 105k
Weak lows provide clear liquidity targets
Once those areas are cleared, market structure favors a strong reversal upward
In summary:
Bitcoin is likely to make one more sweep toward the 105,000 zone to clear liquidity before expanding upward into the 117,000–117,500 area, where a larger reversal setup is likely to form. Of course, price can always move up or down without perfectly respecting these levels — the market does not owe us precision. These levels simply represent the highest-probability areas based on current data and confluence.

AUDUSD My Opinion! BUY!
My dear followers,
I analysed this chart on AUDUSD and concluded the following:
The market is trading on 0.6526 pivot level.
Bias - Bullish
Technical Indicators: Both Super Trend & Pivot HL indicate a highly probable Bullish continuation.
Target - 0.6565
About Used Indicators:
A super-trend indicator is plotted on either above or below the closing price to signal a buy or sell. The indicator changes color, based on whether or not you should be buying. If the super-trend indicator moves below the closing price, the indicator turns green, and it signals an entry point or points to buy.
Disclosure: I am part of Trade Nation's Influencer program and receive a monthly fee for using their TradingView charts in my analysis.
———————————
WISH YOU ALL LUCK

AUDJPY Set To Grow! BUY!
My dear followers,
This is my opinion on the AUDJPY next move:
The asset is approaching an important pivot point 100.66
Bias - Bullish
Safe Stop Loss - 100.57
Technical Indicators: Supper Trend generates a clear long signal while Pivot Point HL is currently determining the overall Bullish trend of the market.
Goal - 100.83
About Used Indicators:
For more efficient signals, super-trend is used in combination with other indicators like Pivot Points.
Disclosure: I am part of Trade Nation's Influencer program and receive a monthly fee for using their TradingView charts in my analysis.
———————————
WISH YOU ALL LUCK

USOIL Is Very Bullish! Buy!
Please, check our technical outlook for USOIL.
Time Frame: 6h
Current Trend: Bullish
Sentiment: Oversold (based on 7-period RSI)
Forecast: Bullish
The market is trading around a solid horizontal structure 60.808.
The above observations make me that the market will inevitably achieve 62.277 level.
P.S
Overbought describes a period of time where there has been a significant and consistent upward move in price over a period of time without much pullback.
Like and subscribe and comment my ideas if you enjoy them!

GBPCAD Will Grow! Long!
Take a look at our analysis for GBPCAD.
Time Frame: 1D
Current Trend: Bullish
Sentiment: Oversold (based on 7-period RSI)
Forecast: Bullish
The market is approaching a key horizontal level 1.844.
Considering the today's price action, probabilities will be high to see a movement to 1.869.
P.S
The term oversold refers to a condition where an asset has traded lower in price and has the potential for a price bounce.
Overbought refers to market scenarios where the instrument is traded considerably higher than its fair value. Overvaluation is caused by market sentiments when there is positive news.
Like and subscribe and comment my ideas if you enjoy them!
