XAUUSD: Rally can Reach new ATH - $4520 pointsHello everyone, here is my breakdown of the current Gold setup.
Market Analysis
Gold has been in a very strong and complex uptrend. We saw the price break out of an initial range and then establish a major Trend Line that has guided it higher, breaking through key levels like Support 2 at 3670 and Support 1 at 4020.
Currently, the most significant event is that the price has broken out above its main Trend Line. After this powerful move, the market has entered a natural corrective phase and is pulling back towards this broken line for a classic retest. This is a critical area to watch.
My Scenario & Strategy
I'm looking for the price to complete its correction down to this main ascending trend line. The key signal for me would be a confirmed and strong bounce from this dynamic support, which would tell me the pullback is over and the primary trend is ready to accelerate.
Therefore, the strategy is to watch for this bounce. A successful defense of the trend line would validate the long scenario. My new target for the next impulsive wave higher is 4520, which would represent a new ATH.
That's the setup I'm tracking. Thank you for your attention, and always manage your risk.
Long!!!!

BTCUSD: Pivot from Support level and Rally to $116KHello everyone, here is my breakdown of the current Bitcoin setup.
Market Analysis
From a broader perspective, after a powerful rally to a new All-Time High around 126000, the market for Bitcoin has entered a significant and complex corrective phase. This entire correction has been developing within the confines of a large triangle pattern, with price coiling between major support and resistance.
Currently, the price has rotated down and is now at a critical inflection point, testing the ascending support line of this multi-week triangle. This area also aligns with the major horizontal Support around the 110500 level, creating a strong confluence of support.
My Scenario & Strategy
I see this test of the Triangle Support Line as a logical point for buyers to step in and defend the structure, just as they have done at previous lows within this pattern.
I'm looking for the price to make one final small corrective dip into this support area. The key signal for me would be a confirmed and strong bounce from this level, which would indicate that the selling pressure is exhausted and a new rotation to the upside is beginning.
The primary target for this rotational move is 116000, a key level of prior price action inside the triangle.
That's the setup I'm tracking. Thank you for your attention, and always manage your risk.

EURGBP Will Explode! BUY!
My dear friends,
EURGBP looks like it will make a good move, and here are the details:
The market is trading on 0.8689 pivot level.
Bias - Bullish
Technical Indicators: Supper Trend generates a clear Bullish signal while Pivot Point HL is currently determining the overall Bullish trend of the market.
Goal - 0.8699
About Used Indicators:
Pivot points are a great way to identify areas of support and resistance, but they work best when combined with other kinds of technical analysis
Disclosure: I am part of Trade Nation's Influencer program and receive a monthly fee for using their TradingView charts in my analysis.
———————————
WISH YOU ALL LUCK

AUDUSD The Target Is UP! BUY!
My dear friends,
Please, find my technical outlook for AUDUSD below:
The instrument tests an important psychological level 0.6487
Bias - Bullish
Technical Indicators: Supper Trend gives a precise Bullish signal, while Pivot Point HL predicts price changes and potential reversals in the market.
Target - 0.6498
Recommended Stop Loss - 0.6481
About Used Indicators:
Super-trend indicator is more useful in trending markets where there are clear uptrends and downtrends in price.
Disclosure: I am part of Trade Nation's Influencer program and receive a monthly fee for using their TradingView charts in my analysis.
———————————
WISH YOU ALL LUCK

BTCUSD Long: Reversal from the Bottom of the ChannelHello, traders! The price auction for BTCUSD has been controlled by a well-defined descending channel. This bearish structure has guided the price lower, with sellers showing strength by breaking below key levels, including the prior support at 111000. The auction has seen multiple tests of both the channel's supply and demand lines.
Currently, the auction is at a critical inflection point. After recently touching the lower demand line of the channel, a pivot point low has been established, and the price is now attempting to initiate a bullish reversal from these lows, showing early signs of buyer interest.
My scenario for the development of events is a bullish reversal from this channel support. I expect the price may make a brief corrective retest of the recent low to confirm buyer initiative. In my opinion, a successful hold will trigger a rally strong enough to reclaim the broken 111000 level, which is now resistance. The take-profit is therefore set at 112200, targeting the area just above this key structural point. Manage your risk!

GBPUSD Is Going Up! Long!
Here is our detailed technical review for GBPUSD.
Time Frame: 1D
Current Trend: Bullish
Sentiment: Oversold (based on 7-period RSI)
Forecast: Bullish
The market is testing a major horizontal structure 1.343.
Taking into consideration the structure & trend analysis, I believe that the market will reach 1.365 level soon.
P.S
Please, note that an oversold/overbought condition can last for a long time, and therefore being oversold/overbought doesn't mean a price rally will come soon, or at all.
Like and subscribe and comment my ideas if you enjoy them!

More down before 150k. Buy zone targeted! COINBASE:BTCUSD If Bitcoin continues previous trends. The last 2 large rallies were preceded by 11-13% drops. We are only at 4% now. If this holds true, 100-98k is where we reverse to 150k.

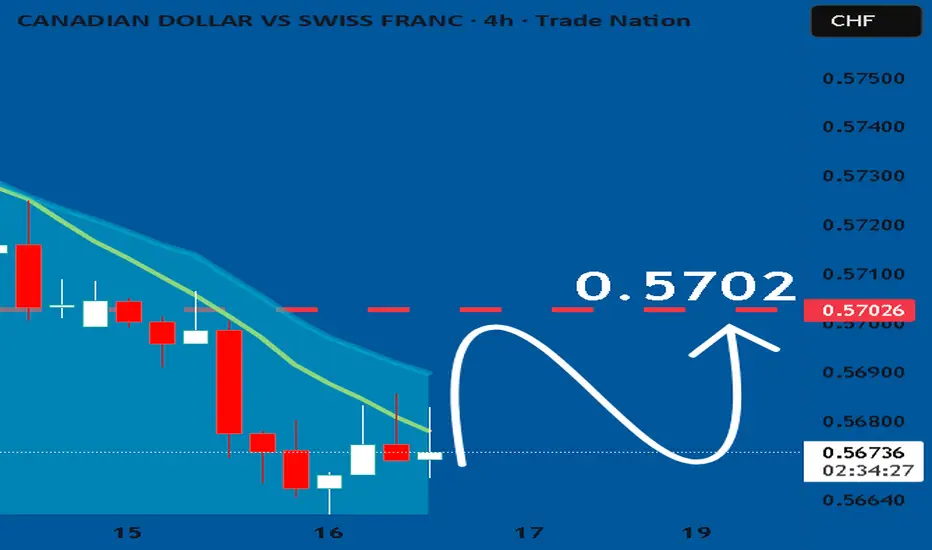
CADCHF: Bulls Will Push Higher
Looking at the chart of CADCHF right now we are seeing some interesting price action on the lower timeframes. Thus a local move up seems to be quite likely.
Disclosure: I am part of Trade Nation's Influencer program and receive a monthly fee for using their TradingView charts in my analysis.
❤️ Please, support our work with like & comment! ❤️
Bitcoin can Reverse Sharply After this CorrectionHello traders, I want share with you my opinion about Bitcoin. The market structure for Bitcoin has turned decidedly bearish in the short term, following a significant breakdown from its recent triangle consolidation pattern. This corrective phase began after a failed rally to a new all-time high near 126000, which led to a prolonged and volatile period of price action, including a sharp drop to 102000. Currently, following the resolution of the recent triangle to the downside, the price of BTC is in a clear downward movement. In my mind, this final decline is a capitulation move that is heading towards a major area of historical support. I expect that the price will fall into the main buyer zone. I think that a strong and confirmed reversal from this zone will signal that the entire corrective phase is complete and that buyers are ready to re-take control for the next major trend. This would present a significant long opportunity. Therefore, I have placed my TP for this reversal scenario at the 116000 level, targeting a key area of prior price action and a logical first objective for a new rally. Please share this idea with your friends and click Boost 🚀
Disclaimer: As part of ThinkMarkets’ Influencer Program, I am sponsored to share and publish their charts in my analysis.

XAUUSD Long: Path to 4280 After Successful RetestHello, traders! The price auction for XAUUSD has been in a powerful and sustained bullish phase, with the market structure being clearly defined by a major ascending trend line. This uptrend has demonstrated significant strength, breaking through multiple key resistance levels such as 3820 and 4055, confirming that buyers are in full control of the market.
Currently, the auction has entered an acceleration phase. The price has broken out above its long-term ascending trend line, a significant event that suggests the bullish momentum is increasing. The market is now in a clear expansion phase, trading in new high territory after leaving the prior structure behind.
My scenario for the development of events is a classic breakout and retest of this major trend line. I believe the price will make a corrective pullback to test the broken trend line from above, confirming it as new support. In my opinion, a successful bounce from this line would validate the acceleration and trigger the next impulsive wave higher. The take-profit is therefore set at 4280. Manage your risk!

NZDCAD Will Move Higher! Buy!
Please, check our technical outlook for NZDCAD.
Time Frame: 4h
Current Trend: Bullish
Sentiment: Oversold
Forecast: Bullish
The market is trading around a solid horizontal structure 0.805.
The above observations make me that the market will inevitably achieve 0.808 level.
P.S
The term oversold refers to a condition where an asset has traded lower in price and has the potential for a price bounce.
Overbought refers to market scenarios where the instrument is traded considerably higher than its fair value. Overvaluation is caused by market sentiments when there is positive news.
Like and subscribe and comment my ideas if you enjoy them!

Copper Long 5/6 Special.Fundamental: 5 | Technical: 6 StacksCAPITALCOM:COPPER COPPER We trade with the odds stacked in our favour. That's confluence. Fundamental: 5 | Technical: 6 Stacks. That was we like to call the perfect trade. No such thing however when the stars align we pull the trigger. Copper supported by infrastructure demand and tight supply; technicals show sustained strength near
$4.90.

#033: Long Investment Opportunity on AUD/CAD
The Australian dollar/Canadian dollar exchange rate has been consolidating for several sessions, establishing a clean base just above a key demand area. Hello, I'm Forex Trader Andrea Russo, an independent trader and prop trader with $200,000 in capital under management. Thank you in advance for your time.
It's not just the support itself that's interesting, but also the way the price has reacted each time it's tested: strong rejections, increasing volume, and clear signs of institutional traders absorbing the market.
On higher timeframes, the bearish pressure is showing signs of exhaustion. The latest candles have pronounced lower wicks, a sign that buyers are returning to activity while the sellers' pressure is slowing. The price continues to move within a descending channel, but the structure is starting to show the first signs of a possible reversal.
Volumes also tell the same story: each test of the low zone has been accompanied by an increase in activity, typical of an accumulation phase. The main moving averages are flattening, confirming a loss of strength in the previous trend.
From a macro perspective, the Australian dollar continues to benefit from the stability of the commodity market and a relatively neutral monetary policy, while the Canadian dollar is suffering from the recent weakening of oil prices. This intermarket divergence often heralds a corrective or impulsive move in favor of the AUD.
In summary, the technical and fundamental context suggests a possible resumption of bullish momentum. However, it will be crucial to wait for a decisive close above the short-term resistance zone to confirm the entry of directional momentum.

AUDCHF: Bullish Continuation & Long Trade
AUDCHF
- Classic bullish formation
- Our team expects growth
SUGGESTED TRADE:
Swing Trade
Buy AUDCHF
Entry Level - 0.5184
Sl - 0.5177
Tp - 0.5200
Our Risk - 1%
Start protection of your profits from lower levels
Disclosure: I am part of Trade Nation's Influencer program and receive a monthly fee for using their TradingView charts in my analysis.
❤️ Please, support our work with like & comment! ❤️

AUDUSD Eyes 0.64500 Support as Bullish Structure Holds FirmHey Traders,
In today’s session, we’re closely monitoring AUDUSD for a potential buying opportunity around the 0.64500 zone. The pair continues to trade within a broader uptrend, and the current pullback appears to be a healthy correction toward a key support and resistance confluence near 0.64500.
A sustained reaction from this level could reaffirm the bullish structure, opening the door for a continuation toward recent highs if momentum aligns with a weaker USD backdrop.
Trade safe,
Joe.

Gold Eyes 4,200 as Pullback Near 4,070 Sets Stage for Next BreakHey Traders,
In today’s session, we’re monitoring XAUUSD for a buying opportunity around the 4,070 zone. Gold remains in a strong uptrend, and after setting a fresh all-time high, price is now pulling back toward key trend support.
This area has been acting as a critical demand zone, and a bullish reaction here could trigger the next leg higher — potentially toward the 4,200 mark.
With safe-haven demand still elevated and DXY under pressure, the broader context continues to favor further upside in Gold.
Trade safe,
Joe.

USDCHF Sellers In Panic! BUY!
My dear friends,
My technical analysis for USDCHF is below:
The market is trading on 0.7991 pivot level.
Bias - Bullish
Technical Indicators: Both Super Trend & Pivot HL indicate a highly probable Bullish continuation.
Target - 0.8026
About Used Indicators:
A pivot point is a technical analysis indicator, or calculations, used to determine the overall trend of the market over different time frames.
Disclosure: I am part of Trade Nation's Influencer program and receive a monthly fee for using their TradingView charts in my analysis.
———————————
WISH YOU ALL LUCK

USDCHF Is Going Up! Long!
Please, check our technical outlook for USDCHF.
Time Frame: 9h
Current Trend: Bullish
Sentiment: Oversold (based on 7-period RSI)
Forecast: Bullish
The market is approaching a significant support area 0.800.
The underlined horizontal cluster clearly indicates a highly probable bullish movement with target 0.809 level.
P.S
Please, note that an oversold/overbought condition can last for a long time, and therefore being oversold/overbought doesn't mean a price rally will come soon, or at all.
Like and subscribe and comment my ideas if you enjoy them!

EURGBP Will Grow! Buy!
Here is our detailed technical review for EURGBP.
Time Frame: 1h
Current Trend: Bullish
Sentiment: Oversold (based on 7-period RSI)
Forecast: Bullish
The market is on a crucial zone of demand 0.870.
The oversold market condition in a combination with key structure gives us a relatively strong bullish signal with goal 0.871 level.
P.S
The term oversold refers to a condition where an asset has traded lower in price and has the potential for a price bounce.
Overbought refers to market scenarios where the instrument is traded considerably higher than its fair value. Overvaluation is caused by market sentiments when there is positive news.
Like and subscribe and comment my ideas if you enjoy them!

GOLD Will Move Higher! Buy!
Please, check our technical outlook for GOLD.
Time Frame: 8h
Current Trend: Bullish
Sentiment: Oversold (based on 7-period RSI)
Forecast: Bullish
The market is approaching a significant support area 4,069.35.
The underlined horizontal cluster clearly indicates a highly probable bullish movement with target 4,202.88 level.
P.S
We determine oversold/overbought condition with RSI indicator.
When it drops below 30 - the market is considered to be oversold.
When it bounces above 70 - the market is considered to be overbought.
Like and subscribe and comment my ideas if you enjoy them!

GBPUSD Will Go Up From Support! Long!
Please, check our technical outlook for GBPUSD.
Time Frame: 4h
Current Trend: Bullish
Sentiment: Oversold (based on 7-period RSI)
Forecast: Bullish
The market is trading around a solid horizontal structure 1.327.
The above observations make me that the market will inevitably achieve 1.334 level.
P.S
Overbought describes a period of time where there has been a significant and consistent upward move in price over a period of time without much pullback.
Like and subscribe and comment my ideas if you enjoy them!

NZD/USD BULLISH BIAS RIGHT NOW| LONG
NZD/USD SIGNAL
Trade Direction: long
Entry Level: 0.572
Target Level: 0.596
Stop Loss: 0.555
RISK PROFILE
Risk level: medium
Suggested risk: 1%
Timeframe: 1D
Disclosure: I am part of Trade Nation's Influencer program and receive a monthly fee for using their TradingView charts in my analysis.
✅LIKE AND COMMENT MY IDEAS✅

EUR/GBP - Multi time frame Analysis🔥 EUR/GBP — Fun but Deeper MTF Plan 🔥
Bias
Bullish across HTFs. Weekly + Daily demand stacked (0.8680–0.8700 riding on top of 0.8580–0.8620). Liquidity trendline above = magnet 🎯
Technical Breakdown
Weekly : Rising wedge grind, BOS history intact. As long as 0.8580 holds, topside liquidity at 0.8780–0.8800 is the draw.
Daily : Fresh reaction from 0.8680–0.8700 demand; higher-low structure pointing to 0.8750–0.8770 first stop.
1H : Sweep → MSS over 50EMA. Grey 1H POI 0.8690–0.8705 = sweet dip zone. If deeper, last defensive line is 0.8680 (daily base).
Execution (Scenarios)
A) Quick tag & go (primary):
Buy 0.8690–0.8705 → TP1 0.8745, TP2 0.8758, TP3 0.8775–0.8785 (liquidity sweep).
SL: 0.8672 (clean under daily base). R:R ≈ 1:2–1:3.
B) Deeper discount (secondary):
If we flush the POI, watch 0.8680–0.8688 for a wick + reclaim → same targets.
SL: 0.8665.
Risk Management
Risk 0.5–1% per idea. Scale out 30/40/30 at TP1/TP2/TP3.
If 1H closes below 0.8680, step aside—bull script broken short-term.
No chasing above 0.8750; wait for a pullback or a clean breakout-retest.
Trader Checklist ✅
HTF bias aligns? ✔️
Price into 1H POI or daily base? ✔️
M5/M15 shift back to bullish on entry? ✔️
Spread/news clean? ✔️
Then send it 🚀
