GBP/JPY BUYERS WILL DOMINATE THE MARKET|LONG
Hello, Friends!
Bullish trend on GBP/JPY, defined by the green colour of the last week candle combined with the fact the pair is oversold based on the BB lower band proximity, makes me expect a bullish rebound from the support line below and a retest of the local target above at 202.880.
Disclosure: I am part of Trade Nation's Influencer program and receive a monthly fee for using their TradingView charts in my analysis.
✅LIKE AND COMMENT MY IDEAS✅
Long!!!!

#032: LONG GBP/USD Investment Opportunity
After a period of consolidation, the pair is showing the first signs of strength near a key demand area. Hello, I'm Forex Trader Andrea Russo, an independent trader and prop trader with $200,000 in capital under management. Thank you in advance for your time.
The recent price structure suggests that the bearish pressure is gradually losing steam, while the market appears to be preparing for a possible directional recovery to the upside.
From a technical perspective, the sequence of lower highs and lower lows appears to be slowing. The latest pullback highlighted the absorption of selling pressure and the solid defense of a significant area of liquidity, tested several times in the past—a behavior that often precedes a structural reversal.
At the macroeconomic level, the most recent dynamics point to a temporary equilibrium between the two currencies. Dollar flow remains strong overall, but in the short term, the pound appears capable of recovering some of its lost ground. This scenario opens up room for corrective or technical rebound movements in favor of the British pound.
Market sentiment also still appears strongly biased toward the opposite side, reinforcing a contrarian view. When the majority of traders are positioned in one direction, liquidity tends to move in the opposite direction—and that's often where the best opportunities arise.
In summary, my decision is based on three converging factors: technical stabilization in an area of significant demand, the gradual exhaustion of bearish pressure, and a context of contrarian sentiment. If momentum holds, the subsequent move could unfold with favorable momentum and limited upside resistance.

USDCAD Technical Analysis! BUY!
My dear subscribers,
This is my opinion on the USDCAD next move:
The instrument tests an important psychological level 1.3986
Bias - Bullish
Technical Indicators: Supper Trend gives a precise Bullish signal, while Pivot Point HL predicts price changes and potential reversals in the market.
Target - 1.4010
My Stop Loss - 1.3973
About Used Indicators:
On the subsequent day, trading above the pivot point is thought to indicate ongoing bullish sentiment, while trading below the pivot point indicates bearish sentiment.
Disclosure: I am part of Trade Nation's Influencer program and receive a monthly fee for using their TradingView charts in my analysis.
———————————
WISH YOU ALL LUCK

GBPUSD Massive Long! BUY!
My dear friends,
My technical analysis for GBPUSD is below:
The market is trading on 1.3273 pivot level.
Bias - Bullish
Technical Indicators: Both Super Trend & Pivot HL indicate a highly probable Bullish continuation.
Target - 1.3337
About Used Indicators:
A pivot point is a technical analysis indicator, or calculations, used to determine the overall trend of the market over different time frames.
Disclosure: I am part of Trade Nation's Influencer program and receive a monthly fee for using their TradingView charts in my analysis.
———————————
WISH YOU ALL LUCK

EURUSD Is Bullish! Long!
Here is our detailed technical review for EURUSD.
Time Frame: 9h
Current Trend: Bullish
Sentiment: Oversold (based on 7-period RSI)
Forecast: Bullish
The market is on a crucial zone of demand 1.160.
The oversold market condition in a combination with key structure gives us a relatively strong bullish signal with goal 1.169 level.
P.S
Overbought describes a period of time where there has been a significant and consistent upward move in price over a period of time without much pullback.
Like and subscribe and comment my ideas if you enjoy them!

EURUSD possible ideaEURUSD is been overall bullish. It had recently made a deep retracement back into a demand it left behind during expansion. It has currently taken out all internal liquidity preceded by a rejection off the demand, giving an internal shift of structure to show the beginning of a potential bullish move to target the latest weak swing high.

GBPUSD possible ideaGBPUSD has been overall bullish with some very deep retracements. It has currently made a retracement back into a demand zone it left behind when it shifted structure internally. With the aid of liquidity it just swept, it could be making its final preparations to use the demand zone it's currently on to push even higher, targeting the latest weak swing high.

#031: EUR/GBP Long Investment Opportunity
In recent movements on EUR/GBP, the price has shown a corrective trend: it attempted to rebound towards medium resistance levels, but encountered significant obstacles. Hello, I'm Forex Trader Andrea Russo, an independent trader and prop trader with $200,000 in capital under management, and I thank you in advance for your time.
There is a narrative in which the market could breathe (correct) before attempting a new attack on the main resistance level. In this scenario, rather than immediately entering "at the current price," I preferred to place a BUY LIMIT in an already identified technical support zone, waiting for the market to decline there and "requalify" the zone as a starting point.
The market has shown weakness in the short term: it has retraced from high levels, but it is not yet clear whether buyers have taken over.
I only want to buy if the price shows that the zone has held. This happens if it drops to the level, hits the BUY LIMIT, and then reverses.
The retail position is now in a "COUNTERVAILING" pattern and therefore in my favor. I'll update you if there are any changes to the ongoing trade.

GOLD Is Bullish! Buy!
Please, check our technical outlook for GOLD.
Time Frame: 4h
Current Trend: Bullish
Sentiment: Oversold (based on 7-period RSI)
Forecast: Bullish
The market is trading around a solid horizontal structure 3,973.70.
The above observations make me that the market will inevitably achieve 4,051.75 level.
P.S
Overbought describes a period of time where there has been a significant and consistent upward move in price over a period of time without much pullback.
Like and subscribe and comment my ideas if you enjoy them!

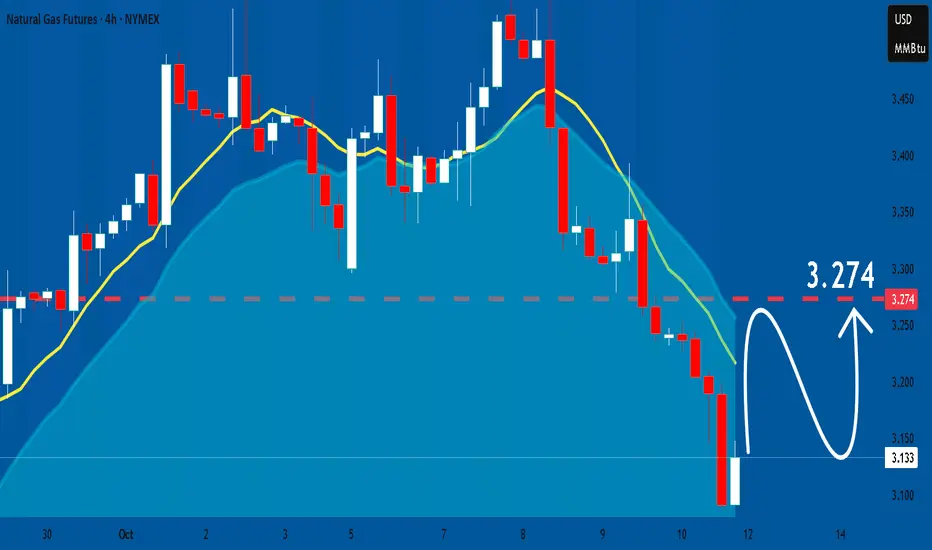
NATGAS: Market of Buyers
The charts are full of distraction, disturbance and are a graveyard of fear and greed which shall not cloud our judgement on the current state of affairs in the NATGAS pair price action which suggests a high likelihood of a coming move up.
Disclosure: I am part of Trade Nation's Influencer program and receive a monthly fee for using their TradingView charts in my analysis.
❤️ Please, support our work with like & comment! ❤️
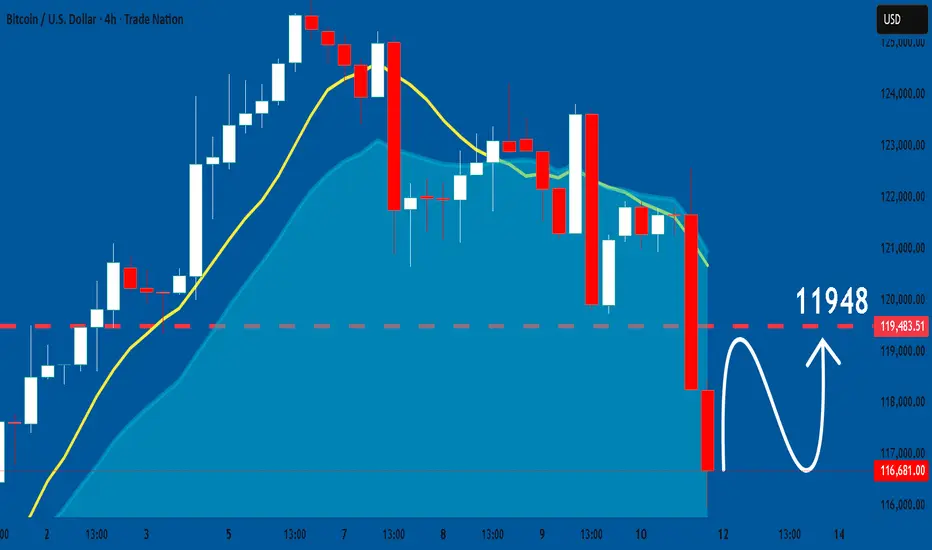
BTCUSD: Forecast & Trading Plan
The recent price action on the BTCUSD pair was keeping me on the fence, however, my bias is slowly but surely changing into the bullish one and I think we will see the price go up.
Disclosure: I am part of Trade Nation's Influencer program and receive a monthly fee for using their TradingView charts in my analysis.
❤️ Please, support our work with like & comment! ❤️
SPY: Bullish Continuation & Long Trade
SPY
- Classic bullish formation
- Our team expects growth
SUGGESTED TRADE:
Swing Trade
Buy SPY
Entry Level - 653.12
Sl - 649.92
Tp - 659.88
Our Risk - 1%
Start protection of your profits from lower levels
Disclosure: I am part of Trade Nation's Influencer program and receive a monthly fee for using their TradingView charts in my analysis.
❤️ Please, support our work with like & comment! ❤️

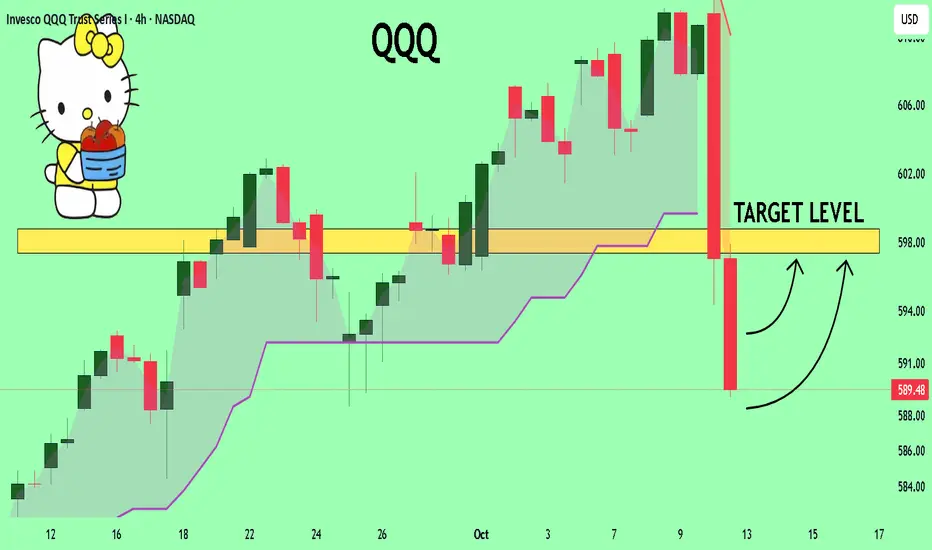
QQQ Set To Grow! BUY
My dear friends,
QQQ looks like it will make a good move, and here are the details:
The market is trading on 569.48 pivot level.
Bias - Bullish
Technical Indicators: Supper Trend generates a clear long signal while Pivot Point HL is currently determining the overall Bullish trend of the market.
Goal - 597.36
About Used Indicators:
Pivot points are a great way to identify areas of support and resistance, but they work best when combined with other kinds of technical analysis
Disclosure: I am part of Trade Nation's Influencer program and receive a monthly fee for using their TradingView charts in my analysis.
———————————
WISH YOU ALL LUCK
AUDUSD Eyes 0.64800 Support as Bullish Structure Holds FirmHey Traders,
In today’s session, we’re closely monitoring AUDUSD for a potential buying opportunity around the 0.64800 zone. The pair continues to trade within a broader uptrend, and the current pullback appears to be a healthy correction toward a key support and resistance confluence near 0.64800.
A sustained reaction from this level could reaffirm the bullish structure, opening the door for a continuation toward recent highs if momentum aligns with a weaker USD backdrop.
Trade safe,
Joe.

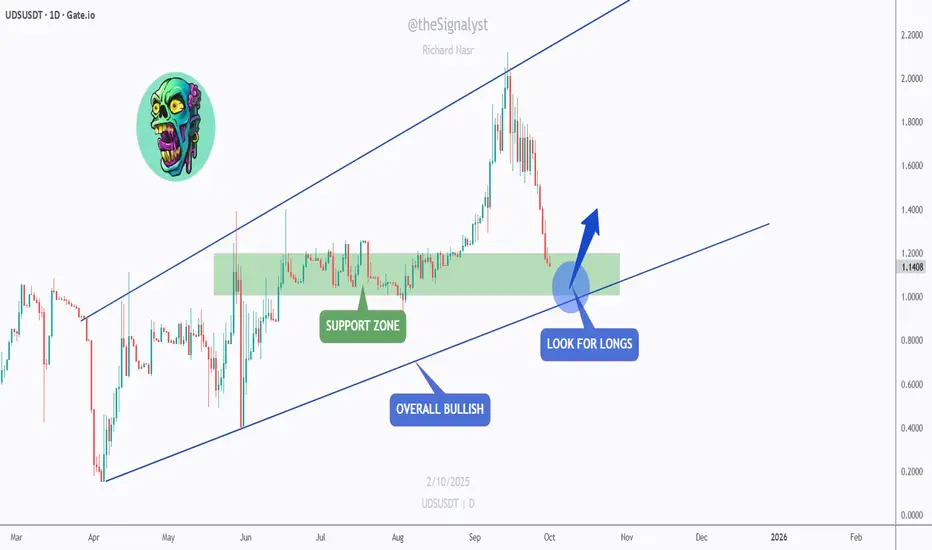
UDS - Confluence Reload Zone at Prior Base!UDS is still overall bullish inside a rising channel.
After a sharp markup, price pulled back into the previous consolidation base (green zone), which now overlaps with the channel’s lower boundary — a classic confluence area.
Key levels
Support: 1.05–1.15 (prior base / channel low)
Resistance: 1.30 → 1.45 (recent swing supply)
Why it matters
- Structure remains up while higher-timeframe channel holds.
- Pullback into old range highs + trendline = a spot where bulls often reload.
Scenarios
- Bullish 📈 Hold the green zone and print a higher low → continuation toward 1.30, then 1.45 if momentum persists.
- Bearish 📉 Daily close below the channel low → deeper correction before buyers try again.
⚠️ Disclaimer: This is not financial advice. Always do your own research and manage risk properly.
📚 Stick to your trading plan regarding entries, risk, and management.
Good luck! 🍀
All Strategies Are Good; If Managed Properly!
~Richard Nasr
What's up with Solana?As we can see, Solana is currently sitting at a resistance level and has managed to hold up well there. In addition, the uptrend has not been broken, since the candle closed back above the potential trend break.
The long wicks we’ve seen across several cryptocurrencies occurred because many trading algorithms on crypto exchanges were not designed to handle such situations properly. These algorithms often compare prices, demand, and supply across different exchanges to determine fair pricing.
For example, if $1 billion were to flow into Solana in a single day, it would have a much larger price impact than $100 million per day over ten days. That’s why traders should always wait for candle closures before making decisions.
The recent crash was triggered by an announcement from Donald Trump, which wasn’t directly related to cryptocurrencies themselves. The broader uptrend remains intact and continues.
Given the current uncertainty, prices are moving sideways. I would consider buying Solana around the $180 level or below, as that still represents a good entry price for this asset. If we soon see rate cuts and the U.S. dollar weakens further under Trump, more investors are likely to move into alternative assets such as cryptocurrencies and Solana remains one of the leading projects in that space.

Is Apple still a buy?If we take a closer look, we can see that we could still enter around the $240–245 range and take profits at around $260. From a fundamental perspective, the numbers also look solid for the coming quarters. Although the fair value is estimated to be around $230 per share, we have to keep in mind that we’re talking about Apple — a company with high liquidity and strong cash flow.
Therefore, a difference of around +$15 (at $245) is not a major concern. The recent drop was mainly caused by the announcement of new tariffs, which pushed the price down artificially. We expect the stock to reach around $260 within the next two weeks. There is also strong support in the lower box area.

Bitcoin may Rally Back Towards the 118000 ResistanceHello traders, I want share with you my opinion about Bitcoin. The market for Bitcoin has experienced extreme volatility recently, with a powerful rally to a new all-time high near 126000 being completely erased by a sharp, news-driven decline down to 101000. This dramatic price swing has reset the market structure. Since that low, however, the price of BTC has staged a significant recovery, breaking back above the major 109500 support level and showing strong signs of a bullish reversal. Currently, the asset is in a minor corrective phase after this initial powerful rebound. In my mind, the strong reversal from the lows indicates that the sell-off was overdone and buyers are now re-engaging. I expect that the price will make a small corrective movement down to retest the major support level around 109500. I think a successful defense of this level, which also aligns with the buyer zone, will confirm the recovery is sustainable and will trigger the next major rally. Therefore, I have placed my TP at the 118000 resistance level, targeting the top of the prior consolidation range. Please share this idea with your friends and click Boost 🚀
Disclaimer: As part of ThinkMarkets’ Influencer Program, I am sponsored to share and publish their charts in my analysis.

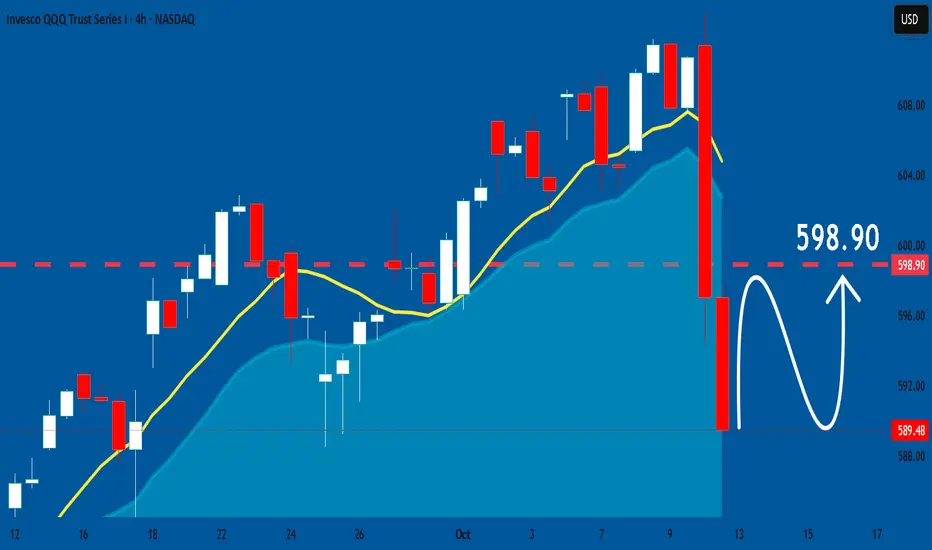
QQQ: Growth & Bullish Continuation
It is essential that we apply multitimeframe technical analysis and there is no better example of why that is the case than the current QQQ chart which, if analyzed properly, clearly points in the upward direction.
Disclosure: I am part of Trade Nation's Influencer program and receive a monthly fee for using their TradingView charts in my analysis.
❤️ Please, support our work with like & comment! ❤️
BTCUSD Will Explode! BUY!
My dear subscribers,
This is my opinion on the BTCUSD next move:
The instrument tests an important psychological level 11668
Bias - Bullish
Technical Indicators: Supper Trend gives a precise Bullish signal, while Pivot Point HL predicts price changes and potential reversals in the market.
Target - 12007
About Used Indicators:
On the subsequent day, trading above the pivot point is thought to indicate ongoing bullish sentiment, while trading below the pivot point indicates bearish sentiment.
Disclosure: I am part of Trade Nation's Influencer program and receive a monthly fee for using their TradingView charts in my analysis.
———————————
WISH YOU ALL LUCK

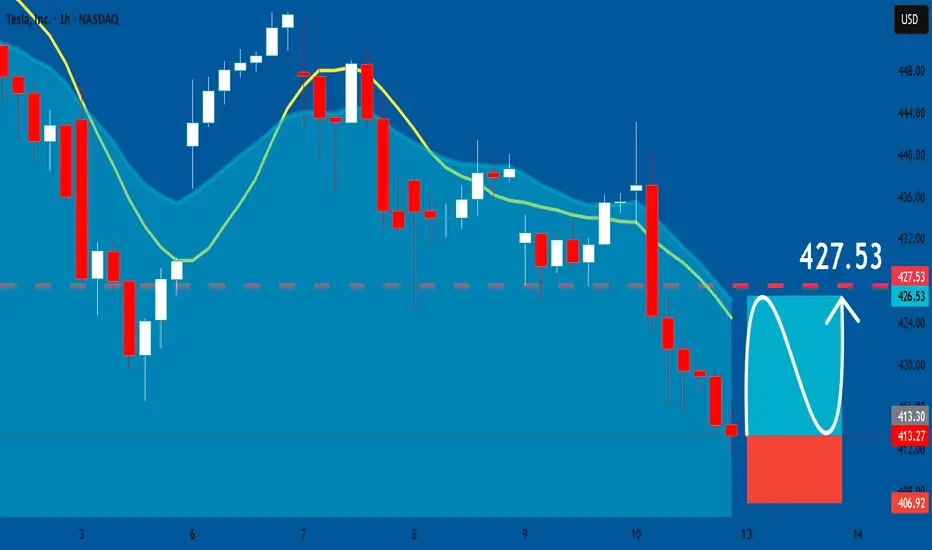
TESLA: Long Signal Explained
TESLA
- Classic bullish formation
- Our team expects pullback
SUGGESTED TRADE:
Swing Trade
Long TESLA
Entry - 413.27
Sl - 406.92
Tp - 427.53
Our Risk - 1%
Start protection of your profits from lower levels
Disclosure: I am part of Trade Nation's Influencer program and receive a monthly fee for using their TradingView charts in my analysis.
❤️ Please, support our work with like & comment! ❤️
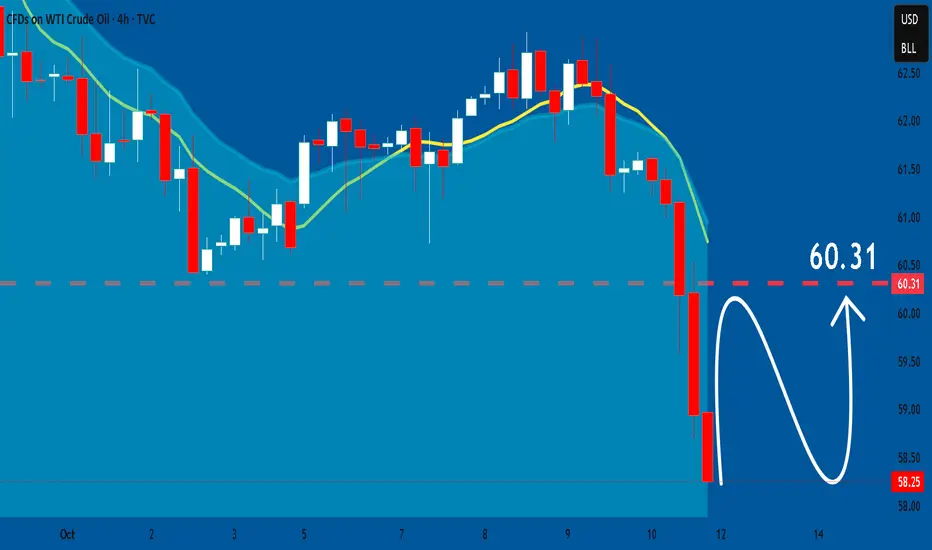
USOIL: Bullish Forecast & Outlook
The analysis of the USOIL chart clearly shows us that the pair is finally about to go up due to the rising pressure from the buyers.
❤️ Please, support our work with like & comment! ❤️
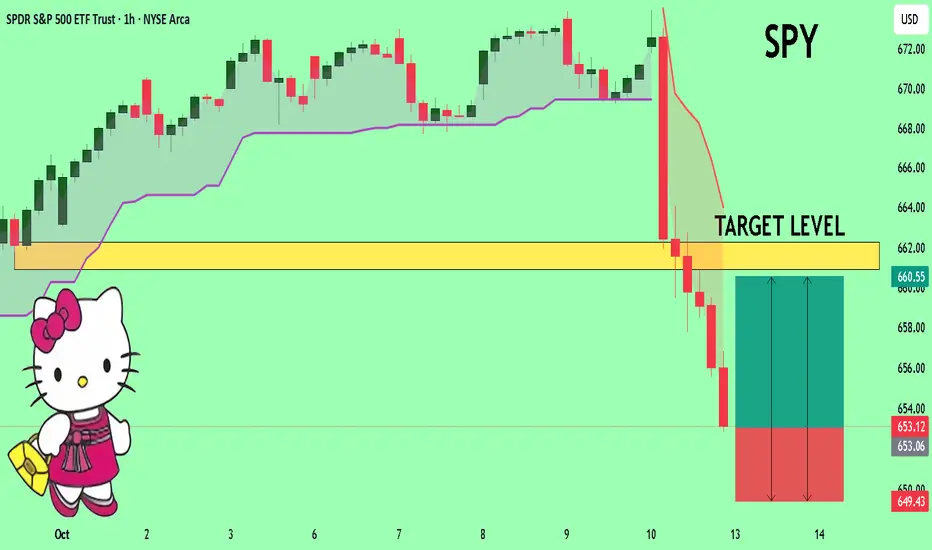
SPY The Target Is UP! BUY!
My dear followers,
I analysed this chart on SPY and concluded the following:
The market is trading on 653.12 pivot level.
Bias - Bullish
Technical Indicators: Both Super Trend & Pivot HL indicate a highly probable Bullish continuation.
Target - 660.90
Safe Stop Loss - 649.43
About Used Indicators:
A super-trend indicator is plotted on either above or below the closing price to signal a buy or sell. The indicator changes color, based on whether or not you should be buying. If the super-trend indicator moves below the closing price, the indicator turns green, and it signals an entry point or points to buy.
Disclosure: I am part of Trade Nation's Influencer program and receive a monthly fee for using their TradingView charts in my analysis.
———————————
WISH YOU ALL LUCK