USDCAD Will Go Higher! Buy!
Here is our detailed technical review for USDCAD.
Time Frame: 1h
Current Trend: Bullish
Sentiment: Oversold (based on 7-period RSI)
Forecast: Bullish
The market is approaching a key horizontal level 1.394.
Considering the today's price action, probabilities will be high to see a movement to 1.399.
P.S
Please, note that an oversold/overbought condition can last for a long time, and therefore being oversold/overbought doesn't mean a price rally will come soon, or at all.
Like and subscribe and comment my ideas if you enjoy them!
Long!!!!

Gold (XAUUSD) – Eyeing a Sweep Toward 4273–4281Gold continues to show intraday strength after holding above recent higher-low structure.
The current bullish leg appears corrective in nature, with price aiming toward the
4273–4281 supply zone highlighted on the chart.
From a fundamental perspective, demand for gold remains supported as markets weigh
the possibility of softer U.S. economic data and expectations of future Fed easing in 2026.
Risk-off flows have also kept buyers active on dips. As long as price holds its internal
bullish structure, a push into the overhead imbalance remains likely.
I’ll be watching how price reacts once it reaches the 4273–4281 zone — this area could
offer a reaction or potential short-term reversal depending on order flow.

Gold Potential UpsidesHey Traders, in today's trading session we are monitoring XAUUSD for a buying opportunity around 4,185 zone, Gold is trading in an uptrend and currently is in a correction phase in which it is approaching the trend at 4,185 support and resistance area.
Trade safe, Joe.

EURUSD Potential UpsidesHey Traders, in today's trading session we are monitoring EURUSD for a buying opportunity around 1.15800 zone, EURUSD is trading in an uptrend and currently is in a correction phase in which it is approaching the trend at 1.15800 support and resistance area.
Trade safe, Joe.

BTCUSD Long: Volatility Rising — Retest of 90,000 ExpectedHello, traders! The price auction for BTCUSD has been in a corrective phase, forming a broad descending structure guided by the major Trend Line. This bearish pattern has been defined by a sequence of lower highs and lower lows, with price repeatedly getting rejected from the Supply Zone and consolidating inside the highlighted range. The market has respected both the descending supply line and the rising Demand Line, creating a well-defined compression of price action.
Currently, the auction is at a critical inflection point, with BTC retesting the Demand Line near the 85,600 demand level. After a series of volatile moves inside the range, the price is attempting to stabilize at this structural support while gradually approaching the descending trendline once again. This tightening of volatility between supply and demand suggests that a significant directional move is likely to occur soon.
My scenario for the development of events is a bullish rebound from the Demand Line, followed by a test of the descending supply line. I expect the price to attempt an impulsive breakout toward the major Supply Zone. In my opinion, a successful breakout above this zone may carry BTC toward the 92,300 resistance target marked on the chart. Manage your risk!

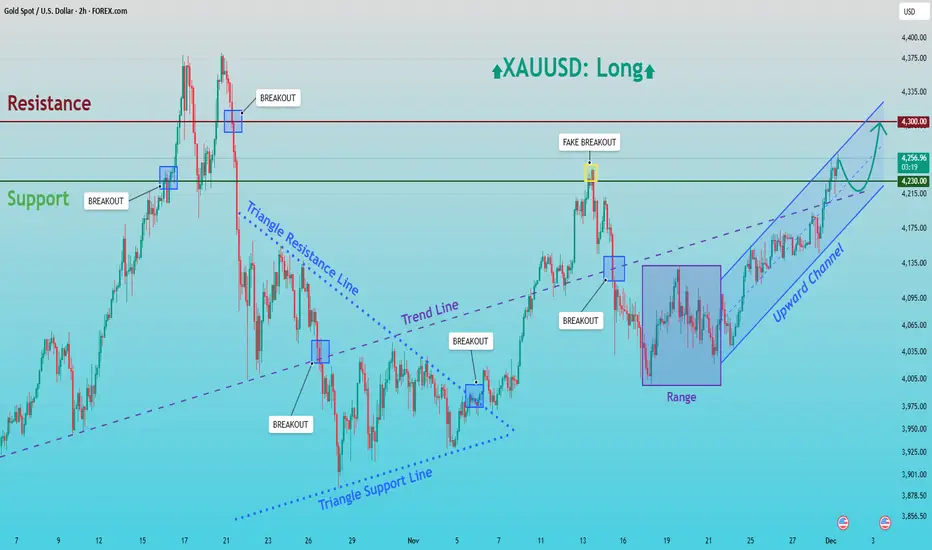
XAUUSD: Buyers Eye Retest of the $4,300 Resistance ZoneHello everyone, here is my breakdown of the current XAUUSD setup.
Market Analysis
Gold continues to trade within a well-structured bullish environment following a strong recovery from the lower Triangle Support Line earlier in the month. After a prolonged corrective phase inside a symmetrical triangle, price eventually broke above the Triangle Resistance Line, shifting the market structure from consolidation into bullish continuation. This breakout created a clear trend shift, supported by a steady sequence of higher highs and higher lows. After the breakout, XAUUSD entered a temporary Range phase, suggesting accumulation from buyers before the next impulsive move. Once price broke out of that range to the upside, the market formed a clean Upward Channel, showing sustained bullish pressure. A notable fake breakout above the Resistance Zone around 4,260 occurred recently, indicating strong seller activity at the top of the zone, but buyers quickly regained control and continued to push price upward within the channel.
Currently, gold is trading near the mid-upper area of the Upward Channel, approaching the 4,300 key Resistance Zone. The broader technical picture shows clear bullish market structure, with trendline support and channel dynamics favoring further upside as long as the channel remains intact.
My Scenario & Strategy
My scenario is bullish, supported by the strong rebound within the Upward Channel and the consistent higher-low structure. As long as price remains above the 4,215–4,230 Support Zone and respects the channel’s lower boundary, buyers hold a clear advantage. My expectation is that XAUUSD may make a minor pullback toward the mid-channel zone near 4,230 to gather liquidity before continuing the upward movement.
Therefore, the primary bullish target remains the 4,300 Resistance Zone, where a retest is highly probable. A clean breakout above 4,300 would open the door for a stronger rally and signal continuation of the broader bullish cycle. However, if gold fails to break the resistance and forms a deeper correction, the Upward Channel support and the prior breakout zone at 4,215 will be key levels to watch. The bullish bias remains valid as long as these supports hold. For now, the structure favors a long scenario with attention on the move toward 4,300 and potential bullish continuation beyond that level.
That's the setup I'm tracking. Thank you for your attention, and always manage your risk.
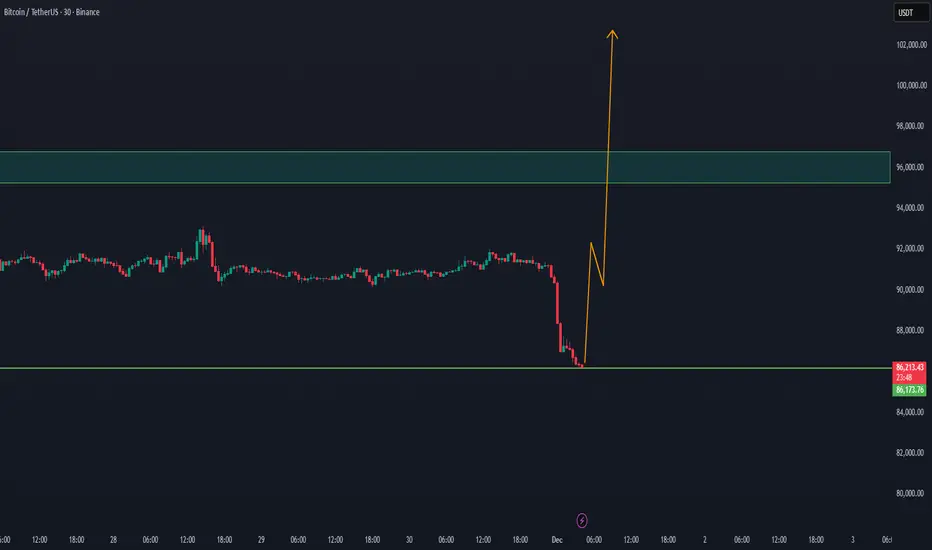
BTCUSD Short-Term Setup: Buyers Defend Support, TP1 at $89,200Hello traders! Here’s my technical outlook on BTC/USD based on the current market structure. After reaching the Seller Zone near $92,000, the price once again faced strong rejection, forming a clear reversal right under the descending Trend Line. This confirms that sellers continue to defend this area and keep Bitcoin within a broader corrective structure. From there, BTC pulled back toward the Buyer Zone around $86,000–$85,500, which has acted as a reliable support multiple times in the recent sessions. The market is now forming a potential short-term recovery after a fake breakout below this zone, highlighting attempts from buyers to regain control. However, as long as the price trades below the Seller Zone and the descending Trend Line, bearish pressure still dominates the chart. The structure suggests that Bitcoin may attempt a move toward TP1 at $89,200, where the market previously consolidated and faced resistance. A clean rejection from the Trend Line could send the price back toward support for another test, while a confirmed breakout above $92,000 would shift short-term sentiment and open the way for stronger bullish continuation. On the other hand, a breakdown below $85,500 could expose BTC to deeper declines toward lower support lines. Please share this idea with your friends and click Boost 🚀

USDCHF Will Go Up! Long!
Take a look at our analysis for USDCHF.
Time Frame: 4h
Current Trend: Bullish
Sentiment: Oversold (based on 7-period RSI)
Forecast: Bullish
The market is approaching a significant support area 0.801.
The underlined horizontal cluster clearly indicates a highly probable bullish movement with target 0.805 level.
P.S
The term oversold refers to a condition where an asset has traded lower in price and has the potential for a price bounce.
Overbought refers to market scenarios where the instrument is traded considerably higher than its fair value. Overvaluation is caused by market sentiments when there is positive news.
Like and subscribe and comment my ideas if you enjoy them!

AUD/JPY SENDS CLEAR BULLISH SIGNALS|LONG
AUD/JPY SIGNAL
Trade Direction: long
Entry Level: 101.576
Target Level: 101.889
Stop Loss: 101.369
RISK PROFILE
Risk level: medium
Suggested risk: 1%
Timeframe: 1h
Disclosure: I am part of Trade Nation's Influencer program and receive a monthly fee for using their TradingView charts in my analysis.
✅LIKE AND COMMENT MY IDEAS✅

SILVER BEST PLACE TO BUY FROM|LONG
SILVER SIGNAL
Trade Direction: long
Entry Level: 5,701.3
Target Level: 5,814.5
Stop Loss: 5,626.2
RISK PROFILE
Risk level: medium
Suggested risk: 1%
Timeframe: 1h
Disclosure: I am part of Trade Nation's Influencer program and receive a monthly fee for using their TradingView charts in my analysis.
✅LIKE AND COMMENT MY IDEAS✅

GBP/USD BULLISH BIAS RIGHT NOW| LONG
Hello, Friends!
Bullish trend on GBP/USD, defined by the green colour of the last week candle combined with the fact the pair is oversold based on the BB lower band proximity, makes me expect a bullish rebound from the support line below and a retest of the local target above at 1.324.
Disclosure: I am part of Trade Nation's Influencer program and receive a monthly fee for using their TradingView charts in my analysis.
✅LIKE AND COMMENT MY IDEAS✅

EURAUD: Long Signal with Entry/SL/TP
EURAUD
- Classic bullish formation
- Our team expects growth
SUGGESTED TRADE:
Swing Trade
Buy EURAUD
Entry Level - 1.7713
Sl - 1.7703
Tp - 1.7731
Our Risk - 1%
Start protection of your profits from lower levels
Disclosure: I am part of Trade Nation's Influencer program and receive a monthly fee for using their TradingView charts in my analysis.
❤️ Please, support our work with like & comment! ❤️

EURJPY What Next? BUY!
My dear followers,
I analysed this chart on EURJPY and concluded the following:
The market is trading on 180.19 pivot level.
Bias - Bullish
Technical Indicators: Both Super Trend & Pivot HL indicate a highly probable Bullish continuation.
Target - 180.71
About Used Indicators:
A super-trend indicator is plotted on either above or below the closing price to signal a buy or sell. The indicator changes color, based on whether or not you should be buying. If the super-trend indicator moves below the closing price, the indicator turns green, and it signals an entry point or points to buy.
Disclosure: I am part of Trade Nation's Influencer program and receive a monthly fee for using their TradingView charts in my analysis.
———————————
WISH YOU ALL LUCK

GOLD Trading Opportunity! BUY!
My dear friends,
My technical analysis for GOLD is below:
The market is trading on 4192.2 pivot level.
Bias - Bullish
Technical Indicators: Both Super Trend & Pivot HL indicate a highly probable Bullish continuation.
Target - 4210.4
Recommended Stop Loss - 4182.6
About Used Indicators:
A pivot point is a technical analysis indicator, or calculations, used to determine the overall trend of the market over different time frames.
Disclosure: I am part of Trade Nation's Influencer program and receive a monthly fee for using their TradingView charts in my analysis.
———————————
WISH YOU ALL LUCK

EURUSD Uptrend Intact: Price Approaches Major 1.1650 ResistanceHello traders! Here’s my technical outlook on EUR/USD based on the current market structure. After breaking out of the Buyer Zone near 1.1600–1.1610, the price pushed higher and re-entered the ascending channel, continuing to form higher highs and higher lows along the channel’s Support Line. Buyers managed to defend the zone after a fake breakout, confirming strong demand within this area. Currently, EUR/USD is approaching the 1.1650–1.1660 Resistance Level, where the previous rejection occurred. As the pair moves within the rising channel, bullish momentum remains intact, but the structure also suggests that the market may slow down as it nears this overhead resistance. As long as the price holds above the Buyer Zone and continues respecting the channel’s Support Line, the bullish scenario remains valid. A short pullback toward the channel’s midline is possible before buyers attempt another push upward. A continuation of this upward movement may drive EUR/USD toward the TP1 target at 1.1650–1.1660, aligning with the major Resistance Level. A clean breakout above this level would open the door for further bullish expansion. However, a breakdown below the Support Line or a return into the Buyer Zone could weaken the current bullish structure and expose the pair to deeper corrective movement. Please share this idea with your friends and click Boost 🚀

The Market Doesn’t Lie — But It Always Tests Your Nerve📈 NZD/USD TECHNICAL OUTLOOK — BUY FROM SUPPORT, TARGET THE BREAKOUT
1. Market Structure Overview
NZD/USD is currently correcting inside a descending pullback after a strong bullish impulse.
The structure is forming:
- A higher–low sequence, showing buyers are still in control
- A clear Support Zone where price previously reacted strongly
- A Resistance Zone above acting as the obstacle before a bullish breakout
Current price action is simply a retracement phase, not a bearish reversal.
2. Key Zone to Watch — LOOK FOR LONG
Your chart correctly marks the Entry Zone at the Support Zone.
Here’s why it’s high probability:
✓ Confluence for BUY
- Previous demand reacted sharply
- Market is forming a potential double-bottom or liquidity sweep
- Price is approaching the end of its corrective wave
- Momentum loss on the bearish leg
This area is where institutions typically accumulate long orders.
3. Main Scenario (High Probability)
[/b ]BUY FROM SUPPORT → BREAKOUT → FULL BULLISH CONTINUATION
When price taps the Support Zone:
-Look for rejection
- Look for a higher low
- Enter LONG on confirmation
- Stop loss below structure (as marked)
Take-Profit Levels:
- TP1: Mid-range / mini resistance
- TP2: Major Resistance Zone
- TP3: Full extension (your highest TP zone)
This matches your drawn black path:
Dip → higher low → breakout → strong bullish continuation.
4. Secondary Scenario (Lower Probability)
Price consolidates at Support but does not break higher immediately.
Even if so — this still favors accumulation, not selling.
As long as price stays above the Support Zone → the bias remains bullish.
5. Intraday Bias: BULLISH
- Structure: Uptrend
- Current move: Healthy pullback
- Key reaction zone: Support
- Best trade: BUY on rejection
- Risk management: SL below the liquidity sweep zone
This is a clean, textbook continuation setup.

GBPNZD Is Going Up! Long!
Please, check our technical outlook for GBPNZD.
Time Frame: 4h
Current Trend: Bullish
Sentiment: Oversold (based on 7-period RSI)
Forecast: Bullish
The market is trading around a solid horizontal structure 2.305.
The above observations make me that the market will inevitably achieve 2.320 level.
P.S
The term oversold refers to a condition where an asset has traded lower in price and has the potential for a price bounce.
Overbought refers to market scenarios where the instrument is traded considerably higher than its fair value. Overvaluation is caused by market sentiments when there is positive news.
Like and subscribe and comment my ideas if you enjoy them!

GBPJPY: Forecast & Technical Analysis
The recent price action on the GBPJPY pair was keeping me on the fence, however, my bias is slowly but surely changing into the bullish one and I think we will see the price go up.
Disclosure: I am part of Trade Nation's Influencer program and receive a monthly fee for using their TradingView charts in my analysis.
❤️ Please, support our work with like & comment! ❤️

AFTER THE EXPECTED CORRECTION BTC ON WAY TO 100k+WE did expect with the last BTC update that a correction could happen at Bitcoin.
With the new study update, there is a good chance BTC will return step by step to the 100k level
Since the price action, new whale volume can enter BTC.
our previous update with the expectation of BTC fall
EURUSD Long: Channel Support Intact, Path Open Toward 1.1625Hello, traders! EURUSD is trading within a developing ascending channel, where price action continues to respect both the higher lows and the upper boundary of the structure. This upward movement formed after buyers defended the Demand Zone around 1.1550, which acted as a strong pivot area and triggered a bullish reversal via a clear inverse Head and Shoulders pattern. This pattern gave buyers the momentum needed to break back above the mid-range structure.
Currently, after reclaiming this level, EURUSD made a steady climb inside the ascending channel. However, price is now approaching the 1.16250 Supply Zone, which has previously acted as a strong reaction area where multiple breakouts and fake breakouts occurred. This remains the key short-term barrier that buyers need to overcome for further upward continuation.
My scenario: if buyers maintain structure above the Demand Zone at 1.15900 and hold the ascending channel’s support, EURUSD may continue pushing toward the 1.16250 level. This zone, aligned with the channel’s upper boundary, is the main target for the current bullish leg. A clean breakout above this resistance could open the door for a stronger bullish extension. However, if price reaches the Supply Zone and shows weakness or rejection, a corrective pullback toward the channel’s lower boundary is possible while still preserving the bullish structure. As long as EURUSD holds above the Demand Zone and respects the channel, the bullish scenario remains valid. Manage your risk!

BTCUSD: Channel Momentum Points Toward $93,700 TargetHello everyone, here is my breakdown of the current Bitcoin setup.
Market Analysis
BTCUSD has shifted from a prolonged bearish phase into a clear bullish recovery after breaking out of the major downward channel. The price confirmed the end of the bearish structure once it broke above the descending trendline and reclaimed the Support Zone around $89,800–$90,200, which previously acted as a strong demand area during the selloff. After the breakout, Bitcoin established a new upward channel, forming higher highs and higher lows, indicating that buyers are currently in control. The price is now moving steadily along the channel's Support Line, respecting its structure and maintaining bullish momentum. Recent price action also includes several breakout confirmations, showing that buyers successfully defended the Support Zone and turned it into a base for further growth.
Currently, BTCUSD is approaching the $93,000–$93,700 Resistance Zone, which remains the main obstacle for buyers. This level acted as strong resistance earlier and aligns with the mid-upper region of the ascending channel, making it a key reaction area where sellers may attempt to slow down the bullish trend.
My Scenario & Strategy
My scenario remains bullish as long as Bitcoin stays above the $90,200 support zone and continues to trade within the upward channel. The structure suggests that buyers may attempt another push toward the $93,700 resistance, where the next major reaction is expected.
Therefore, a clean breakout above $93,700 would confirm further bullish continuation and open the path toward higher targets, potentially extending the uptrend to the upper channel boundary. However, if BTC reaches the resistance and shows signs of rejection or weakening momentum, we may see a pullback toward the channel’s Support Line — yet the broader bullish structure will remain valid as long as the zone around $90,200 holds. For now, the market supports a long bias, with the primary objective being a retest of the $93,700 resistance zone, which stands as the key level buyers are aiming for.
That’s the setup I’m tracking. Thank you for your attention, and always manage your risk.

GBPAUD: Bullish Continuation is Highly Probable! Here is Why:
It is essential that we apply multitimeframe technical analysis and there is no better example of why that is the case than the current GBPAUD chart which, if analyzed properly, clearly points in the upward direction.
Disclosure: I am part of Trade Nation's Influencer program and receive a monthly fee for using their TradingView charts in my analysis.
❤️ Please, support our work with like & comment! ❤️

BTC Buyers Hold Control — Targeting $95,700 Resistance RetestHello traders! Here’s my technical outlook on BTC/USD based on the current market structure. After breaking out of the Buyer Zone near $86,400–$88,000, the price entered a sustained upward channel, forming higher highs and higher lows along the Support Line. However, BTC recently approached the Resistance Line inside the channel and showed signs of exhaustion, indicating that buyers are losing momentum as the price nears the local Seller Zone around $94,000–$95,700. The chart currently shows the market trading within a rising corrective structure, with bulls trying to hold the Support Line to maintain the short-term uptrend. As long as the price stays above the Buyer Zone and respects the channel’s Support Line, the bullish scenario remains valid. The structure suggests a potential pullback from Resistance toward the mid-channel area before buyers attempt another move upward. A continuation of this trend may push BTC/USD toward the TP1 target at $95,700, where the previous rejection occurred. A clean breakout above this level would open the door for stronger bullish expansion. However, a breakdown below the Support Line or a drop back into the Buyer Zone could weaken the trend and expose the price to deeper declines. Please share this idea with your friends and click Boost 🚀
