EURGBP Will Go Up From Support! Long!
Take a look at our analysis for EURGBP.
Time Frame: 6h
Current Trend: Bullish
Sentiment: Oversold (based on 7-period RSI)
Forecast: Bullish
The market is approaching a key horizontal level 0.870.
Considering the today's price action, probabilities will be high to see a movement to 0.875.
P.S
Overbought describes a period of time where there has been a significant and consistent upward move in price over a period of time without much pullback.
Like and subscribe and comment my ideas if you enjoy them!
Long!!!!

XAUUSD LONG 15 TF @3871price moving upward, we had clean break out from asian High.We can expect another retest before touching 3900

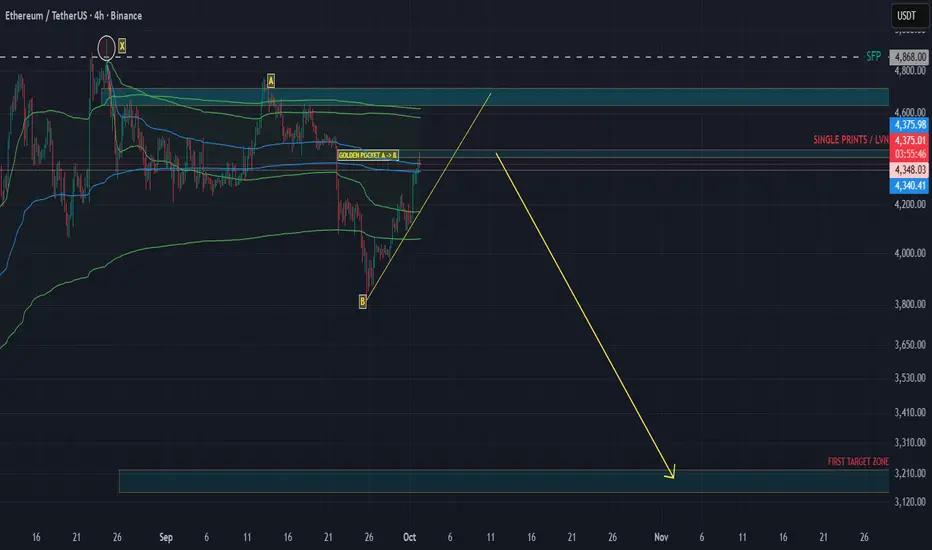
ETHEREUM - THE TRAP IS UNFOLDING – EXPECT A BLOODBATH!As I mentioned in my latest Bitcoin and ChainLink analysis , I believe the crypto market is setting up for a huge long squeeze. Let’s break down why this move looks fragile and why you should be cautious.
What do we need for a healthy rally?
Spot demand – Real buyers (spot market) need to step in and absorb supply. Without this, rallies are built on leverage and tend to collapse quickly.
Controlled leverage – A healthy move isn’t fueled by overleveraged longs. If open interest keeps spiking while spot demand is flat or negative, that’s a recipe for a squeeze.
Auction structure support – Price should build strong bases (value areas, balanced profiles) instead of just ripping up through inefficiencies.
Right now? We don’t have these ingredients.
Step 1: Look at CRYPTOCAP:TOTAL3
For those unfamiliar, CRYPTOCAP:TOTAL3 is the crypto market cap excluding BTC and ETH. It’s a great index to measure the “altcoin market” and often shows where broader crypto is heading.
Now let’s apply some tools:
Anchored VWAP (AVWAP): Tracks the average position of buyers/sellers from a specific swing (like a cost-basis anchor).
Fixed Range Volume Profile (FRVP): Shows where most trading occurred (value area, POC, low/high volume nodes).
What CRYPTOCAP:TOTAL3 shows:
The upper AVWAP band from the swing low (A) is at 1.12T.
The upper AVWAP band from the swing high (B) is also at 1.12T.
Price is retracing into the Value Area High (VAH). This lines up with:
An ascending trendline retest and a Fib retrace (0.75–0.786 zone).
When AVWAP bands from opposite swings collide like this, it’s a double-sided supply zone.
Longs from the low see this area as “expensive” → they reduce risk.
Shorts from the top defend their break-even.
This creates a congestion zone where strong reversals often happen unless fresh spot demand breaks through.
Example: Imagine two teams pushing on opposite sides of a door at the same time. Unless one side gets backup (spot demand), the door doesn’t move — it slams shut.
Step 2: Apply This to CRYPTOCAP:ETH
Now, let’s clear one thing up: CRYPTOCAP:TOTAL3 excludes both Bitcoin and Ethereum. It’s basically the “altcoin index,” showing how the rest of the market behaves without the two giants.
But here’s why it still matters for ETH:
ETH often moves in strong correlation with altcoins, especially during risk-on or risk-off events.
When CRYPTOCAP:TOTAL3 is at a critical resistance or AVWAP collision zone, it usually signals that risk appetite across alts is stretched.
And since ETH trades like a “bridge asset” between BTC and alts, it tends to get caught in the same flows.
So while ETH isn’t included in CRYPTOCAP:TOTAL3 , the technical structure of CRYPTOCAP:TOTAL3 gives us strong hints about where ETH and the altcoin market could be heading.
Step 3: Check USDT Dominance (USDT.D)
Yes, you can chart USDT dominance, and it’s often a leading indicator. Why?
If USDT.D goes up → money flows into stablecoins → crypto selling pressure.
If USDT.D goes down → money flows into crypto → bullish risk-on move.
Right now:
USDT.D broke out of a descending trendline and is retesting the breakout region.
It’s also printing a harmonic pattern that suggests upside continuation.
Step 4: Order Flow – who’s really buying ETH?
This is where the story gets clear:
Aggregated Spot CVD = trending down heavily.
Price goes up while spot CVD goes down = spot is selling into strength → no real demand.
Futures CVD (stablecoin-margined) = trending up heavily.
This means perps are pushing price higher with leverage.
Futures CVD (coin-margined) = trending down.
Another divergence → no strong confirmation from that side either.
Stablecoin OI:
First impulse up = OI dropped → shorts closing, not buyers entering.
Since Oct 1, OI rising → new longs piling in.
ByBit Order Flow: heavy leveraged longs entering, but looks like absorption.
For those that don't understand it:The rally is built on FOMO leverage longs, not real buyers. That’s fragile.
Conclusion
All the ingredients are here for a mega squeeze:
CRYPTOCAP:TOTAL3 at double AVWAP + VAH + Fib confluence,
ETH backfilling inefficiencies into double AVWAP supply,
USDT dominance signaling risk-off,
Order flow showing no spot demand, only leveraged perp longs.
When this unwinds, it won’t just be ETH. Expect broad crypto to follow.
The trap is unfolding. Don’t get caught on the wrong side.
AUDUSD Pullback Toward 0.65300 Within Ongoing UptrendHey Traders, in today's trading session we are monitoring AUDUSD for a buying opportunity around the 0.65300 zone. The pair is trading in an uptrend, with price currently correcting toward this key support/resistance level.
Structure: The broader bias remains bullish, but price is retracing after recent highs.
Key level in focus: 0.65300 — an area where buyers may look to step in and resume the upward move.
Fundamentals: Commodity-linked currencies remain supported by risk-on sentiment and a softer USD backdrop, which could help AUDUSD hold its bullish structure.
Trade safe,
Joe.

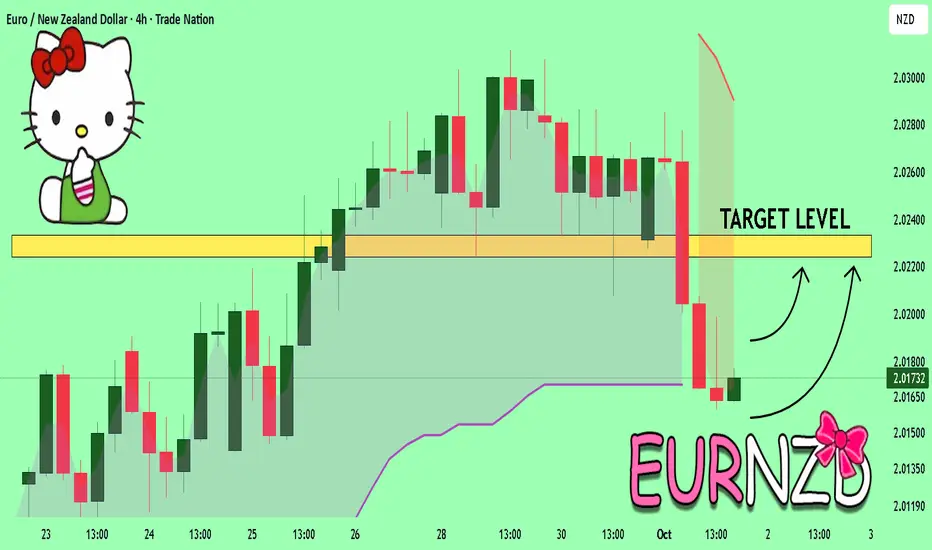
EURNZD The Target Is UP! BUY!
My dear subscribers,
EURNZD looks like it will make a good move, and here are the details:
The market is trading on 2.0172 pivot level.
Bias - Bullish
Technical Indicators: Both Super Trend & Pivot HL indicate a highly probable Bullish continuation.
Target - 2.0224
About Used Indicators:
The average true range (ATR) plays an important role in 'Supertrend' as the indicator uses ATR to calculate its value. The ATR indicator signals the degree of price volatility.
Disclosure: I am part of Trade Nation's Influencer program and receive a monthly fee for using their TradingView charts in my analysis.
———————————
WISH YOU ALL LUCK
GBPNZD Sellers In Panic! BUY!
My dear friends,
GBPNZD looks like it will make a good move, and here are the details:
The market is trading on 2.3177 pivot level.
Bias - Bullish
Technical Indicators: Supper Trend generates a clear long signal while Pivot Point HL is currently determining the overall Bullish trend of the market.
Goal - 2.3199
Recommended Stop Loss - 2.3165
About Used Indicators:
Pivot points are a great way to identify areas of support and resistance, but they work best when combined with other kinds of technical analysis
Disclosure: I am part of Trade Nation's Influencer program and receive a monthly fee for using their TradingView charts in my analysis.
———————————
WISH YOU ALL LUCK

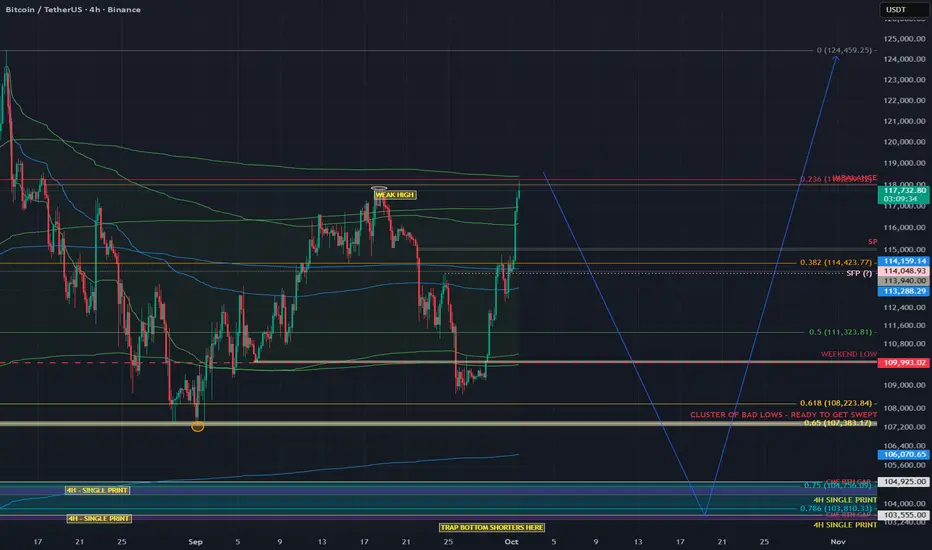
BITCOIN’S PUMP BEFORE THE DUMP — CRYPTO ABOUT TO CRASHTRADERS, WE ARE STARING RIGHT INTO THE EYE OF THE STORM. BITCOIN’S “TOO GOOD TO BE TRUE” RALLY IS BEING PROPPED UP BY LEVERAGED PERPS, NOT REAL SPOT BUYING. THE CHART IS SCREAMING EXHAUSTION: AVWAP BANDS COLLIDING, ORDER FLOW MAXED OUT WITH AGGRESSIVE LONGS, AND A DANGEROUS IMBALANCE AROUND 118K. THIS IS THE PERFECT BREEDING GROUND FOR A MEGA LONG SQUEEZE THAT WILL NOT ONLY RIP THROUGH BITCOIN BUT DRAG THE ENTIRE CRYPTO MARKET DOWN WITH IT. THE PUMP IS THE TRAP. THE DUMP IS LOADING
TLDR;
This leg looks futures-driven, not spot-backed. We’re pushing into AVWAP outer-band confluence with imbalances near 118k while leveraged longs pile in. Base case: sweep the mid-Sept Weak High, fail, rotate down toward 104k (and maybe 98.5k). I’ll flip only if spot CVD takes the lead and price accepts above the AVWAP band cluster.
Why I think the “mega long squeeze” is loading
1) Who’s actually buying? (Spot CVD vs Futures CVD)
Spot CVD: still negative/underwhelming across the push → real buyers (spot) aren’t lifting.
Futures CVD (stablecoin-margined): rising with Open Interest → perps are doing the heavy lifting.
Translation: Leverage is pushing price, not genuine spot accumulation. These moves are fragile and unwind hard when OI compresses.
2) AVWAP confluence (the auction math)
I’m tagging anchored VWAPs from opposing pivots (swing low→high and swing high→low).
The outer bands from these anchors are overlapping in the same zone → both bottom-anchored longs see it as expensive (profit-taking), and top-anchored shorts defend their break-even.
That overlap = double-sided supply. Historically, these reject unless fresh spot demand blows through (which we don’t have… yet).
Still have bad September lows that are likely to be swept at 107k~
3) 118k imbalance
There’s an inefficient push / imbalance around 118k. Thin structure often gets tapped/swept, then mean-reverts if the follow-through is purely leveraged.
4) Order flow is too aggressive (late longs)
OI up + positive delta into resistance = new longs chasing.
On footprint, you can see buy-side aggression meeting absorption near the top of the move. That’s classic trap fuel if we print an SFP.
Trade idea (conceptual, not financial advice)
Base case path (bearish):
✅ Sweep the Weak High (mid-Sept) into 117.8–118.8k (imbalance + AVWAP band confluence).
✅ Print a Swing-Fail Pattern (SFP) / rejection wick on 5–15m with:
Spot CVD NOT confirming (stays flat/negative),
OI spikes while delta stalls (late longs absorbed).
Short after the reclaim/failure back below the swept high; stop above the SFP high.
Targets / magnets:
113.2–114.1k (0.382 zone / local AVWAP midlines)
111.3k (0.5 retrace / prior balance edge)
109.9–109.3k (weekend low / prior node)
106.0–104.9k (SP + LVN cluster, high-prob test area)
Stretch: 103.5k (4H single print) → 98.5k if liquidation cascade extends.
validation / flip criteria:
Acceptance above the AVWAP outer-band cluster and 118.8k with:
Spot CVD turning positive and making higher highs,
OI stable or down on further upside (less leverage dependence).
If that happens, I stand down on the short idea and reassess for continuation
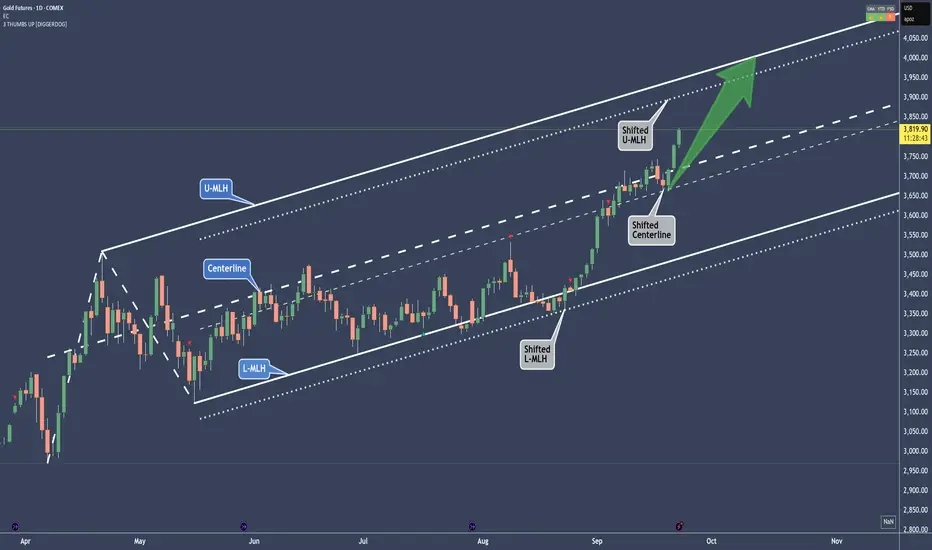
Gold - A shifted move in play and up to 4K🔱 Here’s a shifted move in play 🔱
What exactly is a shifted move?
You see the parallel lines next to the white fork?
Those are the shifted lines.
Now, if you observe how price behaved at the white fork, you’ll notice it was a bit sloppy at the L-MLH, and again at the Centerline after reaching it.
But when we add the dotted parallel lines to the chart and measure the distance from the overshoot at the L-MLH, we find a beautiful support at the Shifted Centerline.
The usual target would be the U-MLH.
So, could the target also be shifted?
And what does that tell us?
Well, if you’re long on Gold, you might want to take some profit at the Shifted U-MLH and let the rest ride up toward 4K—if there’s enough gas in the goose.
For me, a re-entry long would be a pullback to the Centerline—either the original or the shifted one—with a small stop just below some structure.
Let me know what you think ho far Gold will go in the comments.
😊 Thanks for boosting, thanks for following 🙏
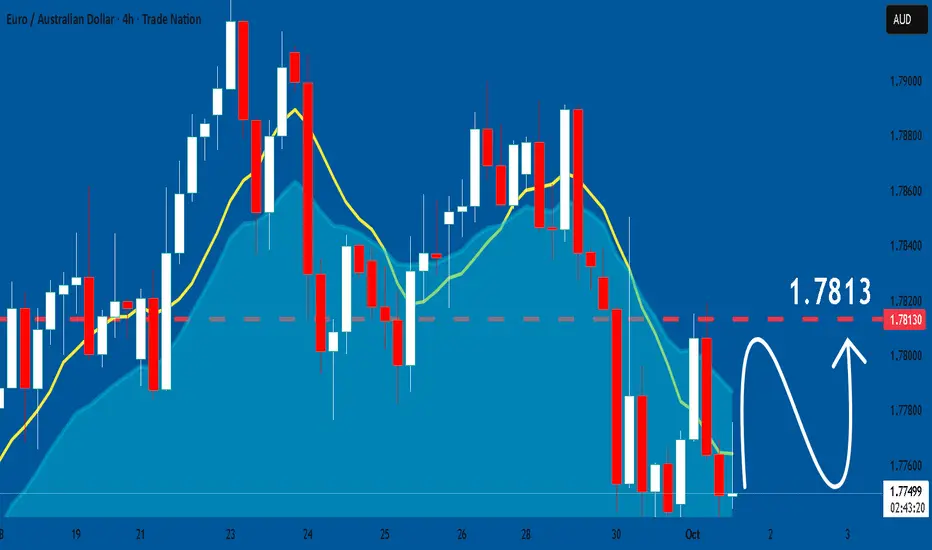
EURAUD: Bullish Continuation is Expected! Here is Why:
Remember that we can not, and should not impose our will on the market but rather listen to its whims and make profit by following it. And thus shall be done today on the EURAUD pair which is likely to be pushed up by the bulls so we will buy!
Disclosure: I am part of Trade Nation's Influencer program and receive a monthly fee for using their TradingView charts in my analysis.
❤️ Please, support our work with like & comment! ❤️
GOLD Massive Long! BUY!
My dear subscribers,
This is my opinion on the GOLD next move:
The instrument tests an important psychological level 3874.0
Bias - Bullish
Technical Indicators: Supper Trend gives a precise Bullish signal, while Pivot Point HL predicts price changes and potential reversals in the market.
Target - 3886.6
My Stop Loss - 3866.8
About Used Indicators:
On the subsequent day, trading above the pivot point is thought to indicate ongoing bullish sentiment, while trading below the pivot point indicates bearish sentiment.
Disclosure: I am part of Trade Nation's Influencer program and receive a monthly fee for using their TradingView charts in my analysis.
———————————
WISH YOU ALL LUCK

EURUSD: Rally to the 1.1805 Zone from Support LineHello everyone, here is my breakdown of the current Euro setup.
Market Analysis
From a broader perspective, the price of EURUSD has been consolidating and building value within a large upward wedge. This pattern is defined by a series of higher lows, forming an ascending support line, which shows that buyers are consistently stepping in at higher prices.
Currently, the price is in a corrective pullback phase. After testing the upper part of the wedge, it is now heading towards the ascending support line for what I see as a critical test of the bullish structure.
My Scenario & Strategy
My scenario is built on the idea that this upward wedge pattern will hold. This pullback to the support line is a classic 'buy the dip' opportunity within the established trend, and a logical place for the correction to end.
I'm looking for the price to complete its correction to the ascending support line. A confirmed bounce from this dynamic support would be the key signal that buyers have absorbed the selling pressure and are ready to initiate the next move higher.
Therefore, the strategy is to watch for this bounce. A successful rebound would validate the long scenario and should lead to a rally that breaks the 1.1780 Resistance. The primary target is the 1.1805 Resistance Zone.
That's the setup I'm tracking. Thank you for your attention, and always manage your risk.

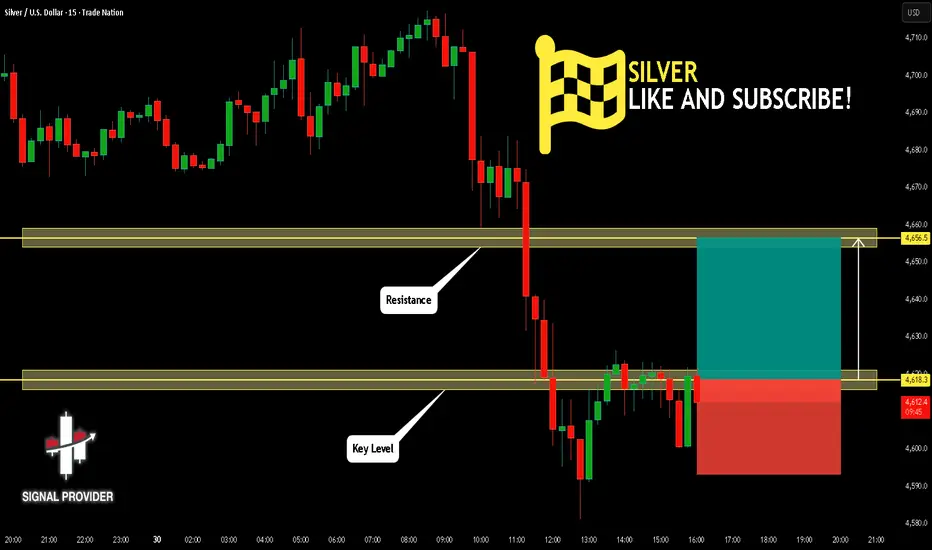
SILVER Is Very Bullish! Buy!
Here is our detailed technical review for SILVER.
Time Frame: 15m
Current Trend: Bullish
Sentiment: Oversold (based on 7-period RSI)
Forecast: Bullish
The market is testing a major horizontal structure 4,618.3.
Taking into consideration the structure & trend analysis, I believe that the market will reach 4,656.5 level soon.
P.S
Please, note that an oversold/overbought condition can last for a long time, and therefore being oversold/overbought doesn't mean a price rally will come soon, or at all.
Like and subscribe and comment my ideas if you enjoy them!
Long EUR/USD on USD Weakness Amid Government ShutdownShort-term trade idea:
Entry: 1.1740–1.1750
Target: 1.1820
Time Horizon: 1–3 days
The ongoing U.S. government shutdown adds downside risk to the dollar, particularly amid softening data and weakening labor market sentiment. Delays in key releases like jobless claims and nonfarm payrolls reduce policy visibility for the Fed and support market expectations for rate cuts in the coming months. Broader risk-off sentiment and pressure on U.S. equities also weigh on the dollar.
Meanwhile, the ECB's decision to keep rates on hold confirms a "wait-and-see" approach, which was already priced in. More importantly, there was no dovish surprise. The ECB is not signaling imminent cuts. With eurozone inflation expected to remain firm, rate cut expectations should stay contained, helping to keep the euro supported. This opens the door for EUR/USD to grind higher, with 1.1800–1.1820 as a short-term target.
Risks:
Rapid resolution of the U.S. government shutdown
Strong upside surprise in U.S. ISM or ADP data
Hawkish Fed rhetoric pushing back against market dovishness

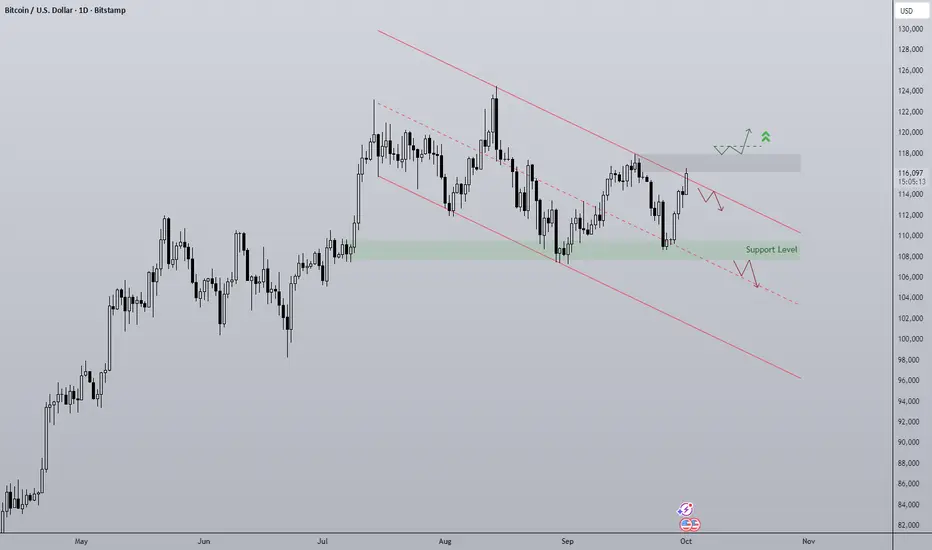
Bitcoin in Q4 As "Uptober" begins the layout for Bitcoin is as follows:
- Downtrend on the daily officially since 18th September but really it began after the SFP of ATH on August 14th.
- The origin of the rally to ATH has served as support twice since at $108,000
- Diagonal trendline resistance being tested as Q4 begins, seasonality shows October is very strong for returns, 21.89% average since 2019.
- Compression of the range inevitably leads to a breakout in either direction.
Bullish scenario is reclaim of $117,500 to push towards ATH.
Bearish scenario is a loss of $108,000
Eur/Usd - Accumulation at Support, Targeting Resistance Price is currently ranging between a defined support zone (purple box) and a resistance zone (green box). After a CHoCH (Change of Character) and a Break of Structure (BOS) earlier, the market is showing signs of accumulating near the support level.
Current Setup:
Price is respecting the support zone (1.17250–1.17300) and attempting to form a bullish structure.
A potential rally could follow from this zone, targeting the resistance zone (1.17500–1.17650), marked as a weak high – suggesting it’s likely to be taken out.
Bullish Scenario:
Entry Zone: Within or just above the support
Target: Resistance zone / Weak high area
Invalidation: Clear breakdown below the support zone
Bias: Bullish while support holds
Key Zones:
Support: 1.17250–1.17300
Resistance (Target): 1.17500–1.17650
This setup favors buying the dip with confirmation signals (e.g., bullish engulfing, reversal patterns).

Cannabis stocks are looking bullish!Loving this setup with an ABC correction and a double bottom on TCNNF. The whole cannabis industry is very undervalued and should see a huge run with a big-picture reversal.
As always, stay profitable.
- Dalin Anderson

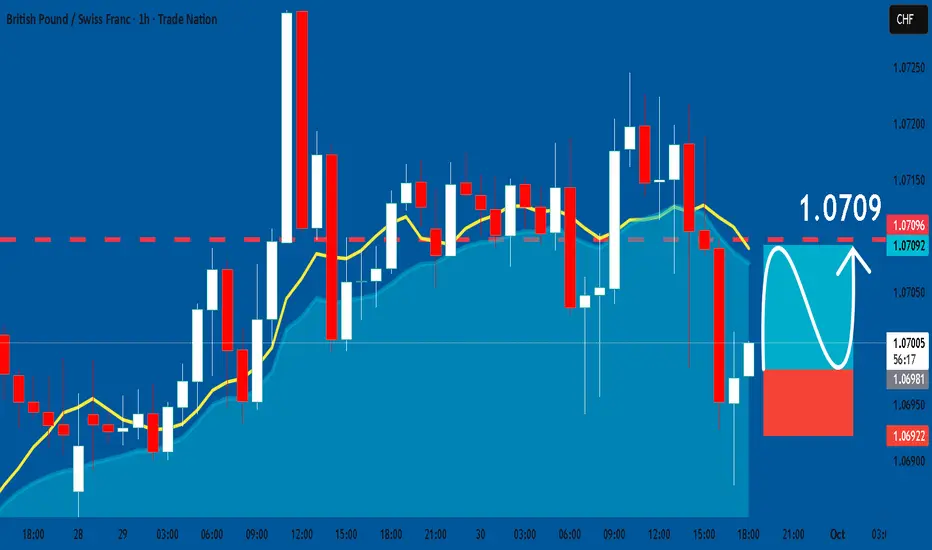
GBPCHF: Free Trading Signal
GBPCHF
- Classic bullish formation
- Our team expects pullback
SUGGESTED TRADE:
Swing Trade
Long GBPCHF
Entry - 1.0698
Sl - 1.0692
Tp - 1.0709
Our Risk - 1%
Start protection of your profits from lower levels
Disclosure: I am part of Trade Nation's Influencer program and receive a monthly fee for using their TradingView charts in my analysis.
❤️ Please, support our work with like & comment! ❤️
EURJPY Technical Analysis! BUY!
My dear friends,
Please, find my technical outlook for EURJPY below:
The instrument tests an important psychological level 173.68
Bias - Bullish
Technical Indicators: Supper Trend gives a precise Bullish signal, while Pivot Point HL predicts price changes and potential reversals in the market.
Target - 174.10
About Used Indicators:
Super-trend indicator is more useful in trending markets where there are clear uptrends and downtrends in price.
Disclosure: I am part of Trade Nation's Influencer program and receive a monthly fee for using their TradingView charts in my analysis.
———————————
WISH YOU ALL LUCK

Gold Watching 3,780 as Fed Drama & Geopolitics Boost DemandHey Traders, in today's session we are watching XAUUSD closely as price pulls back toward the 3,780 support zone. The broader trend remains bullish, and this retracement could offer a potential buying opportunity if buyers defend this level.
Market Structure: Gold has been steadily climbing, and the current correction is bringing price back to an important technical area where demand has stepped in before.
Level to Watch: 3,780 — if this zone holds, it may trigger the next leg higher in the ongoing uptrend.
Macro Drivers:
Political Noise in the U.S.: Market chatter picked up after Trump jokingly posted a meme about firing Fed Chair Powell. While tongue-in-cheek, it adds uncertainty about the Fed’s independence — a factor that often supports safe-haven flows into Gold.
Global Tensions: Heightened geopolitical risks, particularly with Russia, are driving demand for protective assets, which strengthens the bullish outlook for Gold.
We’ll be watching how price reacts around 3,780 to gauge whether bulls are ready to take back control.
Trade safe,
Joe.

GOLD: Bullish Continuation & Long Trade
GOLD
- Classic bullish pattern
- Our team expects retracement
SUGGESTED TRADE:
Swing Trade
Buy GOLD
Entry - 3815.7
Stop - 3806.3
Take - 3835.2
Our Risk - 1%
Start protection of your profits from lower levels
Disclosure: I am part of Trade Nation's Influencer program and receive a monthly fee for using their TradingView charts in my analysis.
❤️ Please, support our work with like & comment! ❤️

USDJPY Technical Analysis! BUY!
My dear subscribers,
My technical analysis for USDJPY is below:
The price is coiling around a solid key level - 147.98
Bias - Bullish
Technical Indicators: Pivot Points Low anticipates a potential price reversal.
Super trend shows a clear buy, giving a perfect indicators' convergence.
Goal - 148.78
About Used Indicators:
By the very nature of the supertrend indicator, it offers firm support and resistance levels for traders to enter and exit trades. Additionally, it also provides signals for setting stop losses
Disclosure: I am part of Trade Nation's Influencer program and receive a monthly fee for using their TradingView charts in my analysis.
———————————
WISH YOU ALL LUCK

EURUSD Is Going Up! Long!
Take a look at our analysis for EURUSD.
Time Frame: 6h
Current Trend: Bullish
Sentiment: Oversold (based on 7-period RSI)
Forecast: Bullish
The market is approaching a key horizontal level 1.173.
Considering the today's price action, probabilities will be high to see a movement to 1.181.
P.S
The term oversold refers to a condition where an asset has traded lower in price and has the potential for a price bounce.
Overbought refers to market scenarios where the instrument is traded considerably higher than its fair value. Overvaluation is caused by market sentiments when there is positive news.
Like and subscribe and comment my ideas if you enjoy them!

NZDUSD Will Grow! Buy!
Please, check our technical outlook for NZDUSD.
Time Frame: 1D
Current Trend: Bullish
Sentiment: Oversold (based on 7-period RSI)
Forecast: Bullish
The market is approaching a significant support area 0.579.
The underlined horizontal cluster clearly indicates a highly probable bullish movement with target 0.591 level.
P.S
We determine oversold/overbought condition with RSI indicator.
When it drops below 30 - the market is considered to be oversold.
When it bounces above 70 - the market is considered to be overbought.
Like and subscribe and comment my ideas if you enjoy them!
