GBPAUD Will Go Higher! Buy!
Here is our detailed technical review for GBPAUD.
Time Frame: 4h
Current Trend: Bullish
Sentiment: Oversold (based on 7-period RSI)
Forecast: Bullish
The market is on a crucial zone of demand 2.018.
The oversold market condition in a combination with key structure gives us a relatively strong bullish signal with goal 2.034 level.
P.S
The term oversold refers to a condition where an asset has traded lower in price and has the potential for a price bounce.
Overbought refers to market scenarios where the instrument is traded considerably higher than its fair value. Overvaluation is caused by market sentiments when there is positive news.
Like and subscribe and comment my ideas if you enjoy them!
Long!!!!

USD/JPY BUYERS WILL DOMINATE THE MARKET|LONG
Hello, Friends!
We are going long on the USD/JPY with the target of 155.896 level, because the pair is oversold and will soon hit the support line below. We deduced the oversold condition from the price being near to the lower BB band. However, we should use low risk here because the 1W TF is red and gives us a counter-signal.
Disclosure: I am part of Trade Nation's Influencer program and receive a monthly fee for using their TradingView charts in my analysis.
✅LIKE AND COMMENT MY IDEAS✅

GOLD LONG FROM SUPPORT
GOLD SIGNAL
Trade Direction: long
Entry Level: 4,043.86
Target Level: 4,189.14
Stop Loss: 3,946.77
RISK PROFILE
Risk level: medium
Suggested risk: 1%
Timeframe: 9h
Disclosure: I am part of Trade Nation's Influencer program and receive a monthly fee for using their TradingView charts in my analysis.
✅LIKE AND COMMENT MY IDEAS✅

USDCHF: Bullish Continuation & Long Signal
USDCHF
- Classic bullish formation
- Our team expects pullback
SUGGESTED TRADE:
Swing Trade
Long USDCHF
Entry - 0.8041
Sl - 0.8032
Tp - 0.8058
Our Risk - 1%
Start protection of your profits from lower levels
Disclosure: I am part of Trade Nation's Influencer program and receive a monthly fee for using their TradingView charts in my analysis.
❤️ Please, support our work with like & comment! ❤️


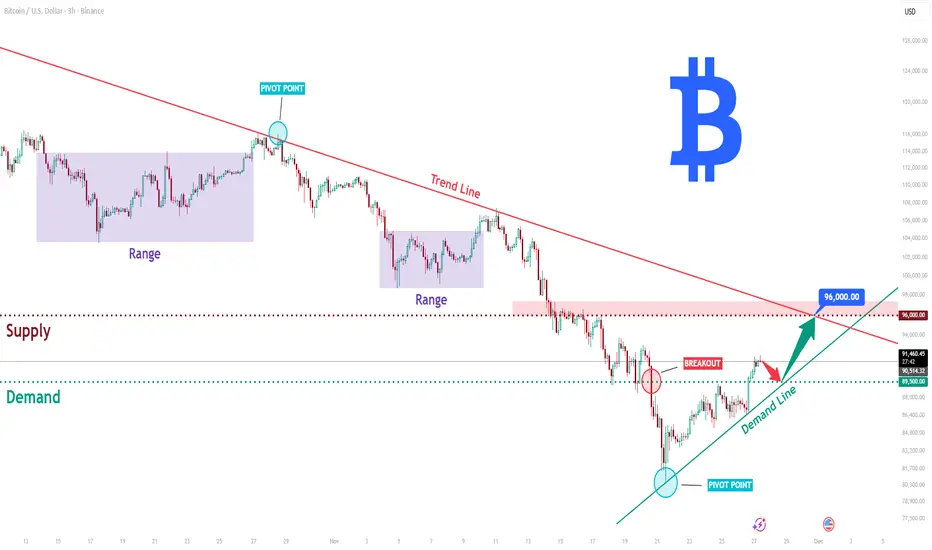
BTCUSD Long: Compression Near Trend Line, Possible Move to $96KHello, traders! BTCUSD continues to move within a broader descending structure, where the price has consistently respected the major downward trend line. Each approach to this trend line has resulted in a new lower high, confirming seller control in the medium-term outlook.
Currently, after the decline, Bitcoin tested the Demand Zone around $89,500, where buyers formed an important pivot point, triggering a noticeable upward impulse. This reaction confirmed strong demand and pushed the price toward the key compression area between the Demand Line and the main descending Trend Line.
My scenario, if buyers maintain pressure and break above the descending trend line, BTCUSD may extend its bullish correction toward the $96,000 supply zone. However, if the demand level fails to hold, this scenario becomes invalid, opening the path toward deeper support levels. Manage your risk!
XAUUSD: Channel Push Points to $4,220 as Next TargetHello everyone, here is my breakdown of the current Gold setup.
Market Analysis
Gold remains in a broader bullish structure, but the recent price action is developing inside a well-defined ascending channel, where price is currently moving from the lower boundary toward the upper one. After a sharp correction, XAUUSD found strong support at the $4,040 level, which aligns with the bottom of the channel and produced a fake breakout, signaling lack of bearish continuation.
Currently, price has started a new upward swing, respecting both the channel structure and the mid-line trend dynamics. However, despite the recovery, XAUUSD is still trading below the major $4,220 resistance, which previously acted as a strong reaction zone and remains the key obstacle for buyers.
My Scenario & Strategy
My scenario is bullish, as long as price stays above the support zone around $4,040 and maintains structure inside the ascending channel. I expect Gold to continue climbing toward the $4,220 resistance, where the upper channel boundary also converges, forming a strong confluence area.
Therefore, a clean breakout above $4,220 would open the way for higher targets and continuation of the broader trend. However, if price reaches this zone and shows strong rejection or weakness, we may see a pullback into the channel — but the bullish structure remains intact as long as the lower boundary holds. For now, the market supports a long bias, with the key objective being a retest of the $4,220 resistance zone, which is the next major level buyers are aiming for.
That's the setup I'm tracking. Thank you for your attention, and always manage your risk.

SILVER Will Move Higher! Long!
Please, check our technical outlook for SILVER.
Time Frame: 1D
Current Trend: Bullish
Sentiment: Oversold (based on 7-period RSI)
Forecast: Bullish
The market is trading around a solid horizontal structure 5,642.3.
The above observations make me that the market will inevitably achieve 6,175.7 level.
P.S
Overbought describes a period of time where there has been a significant and consistent upward move in price over a period of time without much pullback.
Like and subscribe and comment my ideas if you enjoy them!

AUDUSD Is Bullish! Buy!
Here is our detailed technical review for AUDUSD.
Time Frame: 9h
Current Trend: Bullish
Sentiment: Oversold (based on 7-period RSI)
Forecast: Bullish
The market is testing a major horizontal structure 0.654.
Taking into consideration the structure & trend analysis, I believe that the market will reach 0.658 level soon.
P.S
Please, note that an oversold/overbought condition can last for a long time, and therefore being oversold/overbought doesn't mean a price rally will come soon, or at all.
Like and subscribe and comment my ideas if you enjoy them!

Bitcoin - $250K Target by 2030 is Feasible - Why I'm Still LongSince I established this account on Tradingview in 2017, I have consistently shared positive sentiment regarding Bitcoin. Also, I have been monitoring crypto and blockchain technology since 2011. My optimism about Bitcoin's potential has been longstanding, particularly with the arrival of RSK, Bitcoin subnets, Ivy, the Lightning Network, and Bitcoin Oracles. Furthermore, Bitcoin has gained significant acceptance among institutional investors, as evidenced by the increasing prevalence of Bitcoin ETFs, Index Funds, and BTC being included in more retirement portfolios or mutual funds. Although I have maintained a bullish stance and invested in crypto for an extended period, the technology still faces considerable challenges in terms of scalability and achieving mass adoption. Additionally, I have previously suggested a new Proof of Work (PoW) mechanism for BTC mining; however, HashCash appears to be the preferred choice among Bitcoin Maximalists and the BTC Dev Team. A price of $250K by 2030 is a realistic possibility. As always, none of this is investment or financial advice. Please do your own due diligence and research.

BITCOIN Is Very Bullish! Long!
Take a look at our analysis for BITCOIN.
Time Frame: 9h
Current Trend: Bullish
Sentiment: Oversold (based on 7-period RSI)
Forecast: Bullish
The market is approaching a key horizontal level 91,203.52.
Considering the today's price action, probabilities will be high to see a movement to 99,126.26.
P.S
The term oversold refers to a condition where an asset has traded lower in price and has the potential for a price bounce.
Overbought refers to market scenarios where the instrument is traded considerably higher than its fair value. Overvaluation is caused by market sentiments when there is positive news.
Like and subscribe and comment my ideas if you enjoy them!

GBPJPY Will Grow! Buy!
Here is our detailed technical review for GBPJPY.
Time Frame: 4h
Current Trend: Bullish
Sentiment: Oversold (based on 7-period RSI)
Forecast: Bullish
The market is on a crucial zone of demand 206.674.
The oversold market condition in a combination with key structure gives us a relatively strong bullish signal with goal 208.028 level.
P.S
Overbought describes a period of time where there has been a significant and consistent upward move in price over a period of time without much pullback.
Like and subscribe and comment my ideas if you enjoy them!

Gold: Safe-Haven Demand Surges After Venezuela TensionsHey Traders,
In the coming week we are monitoring XAUUSD for a potential buying opportunity around the 4,195 zone. Gold remains in a clear uptrend, and the current correction is guiding price back toward a major support-and-trendline confluence, where buyers have consistently defended the structure.
On the fundamental side, safe-haven flows are heating up again.
Following Trump’s announcement that a land operation against Venezuela is expected to begin soon, markets quickly shifted into risk-off mode. Geopolitical uncertainty has historically driven capital toward traditional havens — and Gold often reacts first.
If tensions continue to escalate, the 4,195 zone could become the launchpad for the next bullish extension, with sentiment strongly supporting upside.
Trade safe,
Joe

AUDUSD Breakout and Potential RetraceHey Traders, in the coming week we are monitoring AUDUSD for a buying opportunity around 0.65400 zone, AUDUSD was trading in a downtrend and successfully managed to break it out. Currently is in a correction phase in which it is approaching the retrace area at 0.65400 support and resistance area.
Trade safe, Joe.

USDCAD: Bullish Forecast & Bullish Scenario
The analysis of the USDCAD chart clearly shows us that the pair is finally about to go up due to the rising pressure from the buyers.
❤️ Please, support our work with like & comment! ❤️

NZDCAD: Long Trading Opportunity
NZDCAD
- Classic bullish pattern
- Our team expects retracement
SUGGESTED TRADE:
Swing Trade
Buy NZDCAD
Entry - 0.8008
Stop - 0.8000
Take - 0.8021
Our Risk - 1%
Start protection of your profits from lower levels
Disclosure: I am part of Trade Nation's Influencer program and receive a monthly fee for using their TradingView charts in my analysis.
❤️ Please, support our work with like & comment! ❤️

GBPCAD Will Explode! BUY!
My dear followers,
This is my opinion on the GBPCAD next move:
The asset is approaching an important pivot point 1.8488
Bias - Bullish
Technical Indicators: Supper Trend generates a clear long signal while Pivot Point HL is currently determining the overall Bullish trend of the market.
Goal - 1.8551
About Used Indicators:
For more efficient signals, super-trend is used in combination with other indicators like Pivot Points.
Disclosure: I am part of Trade Nation's Influencer program and receive a monthly fee for using their TradingView charts in my analysis.
———————————
WISH YOU ALL LUCK

BTC not over yet.BTC is not over yet, As you can see on the chart there are still 2 major trends remaining as BTC is having a reaction of the 85k level. As long as we can remain this area, there are still possibilities fo a push to a new ath.

EURCAD: Bullish Continuation is Expected! Here is Why:
Looking at the chart of EURCAD right now we are seeing some interesting price action on the lower timeframes. Thus a local move up seems to be quite likely.
Disclosure: I am part of Trade Nation's Influencer program and receive a monthly fee for using their TradingView charts in my analysis.
❤️ Please, support our work with like & comment! ❤️

EURUSD: Long Trade Explained
EURUSD
- Classic bullish setup
- Our team expects bullish continuation
SUGGESTED TRADE:
Swing Trade
Long EURUSD
Entry Point - 1.1557
Stop Loss - 1.1547
Take Profit - 1.1577
Our Risk - 1%
Start protection of your profits from lower levels
Disclosure: I am part of Trade Nation's Influencer program and receive a monthly fee for using their TradingView charts in my analysis.
❤️ Please, support our work with like & comment! ❤️

GOLD Sellers In Panic! BUY!
My dear friends,
Please, find my technical outlook for GOLD below:
The price is coiling around a solid key level - 4164.3
Bias - Bullish
Technical Indicators: Pivot Points Low anticipates a potential price reversal.
Super trend shows a clear buy, giving a perfect indicators' convergence.
Goal - 4176.6
Safe Stop Loss - 4157.5
About Used Indicators:
The pivot point itself is simply the average of the high, low and closing prices from the previous trading day.
Disclosure: I am part of Trade Nation's Influencer program and receive a monthly fee for using their TradingView charts in my analysis.
———————————
WISH YOU ALL LUCK

Gold Eyes 4,110 — USD Weakness Could Fuel the Next Leg Up!!Hey Traders,
In today's trading session we are monitoring GOLD (XAUUSD) for a potential buying opportunity around the 4,110 zone. Gold continues to trade firmly within an established uptrend, and the current pullback is bringing price right into a key support + trend confluence at 4,110 — a zone where buyers have consistently stepped in.
Macro context supports this setup:
The US Dollar has been losing momentum, pressured by rising expectations of a December FED rate cut and increasingly soft economic data. Weak labor market signals, cooler inflation trends, and shifting rate expectations have collectively weighed on the DXY.
A softening USD typically acts as a tailwind for gold, especially in environments where monetary policy is turning more accommodative.
If the Dollar continues to slide, it could provide the catalyst needed for Gold to resume its bullish leg off the 4,110 support zone.
Trade safe,
Joe

Gold Buyers Regain Momentum — Aiming for 4,240 RetestHello traders! Let’s break down the current XAUUSD structure. Gold is trading within a broad ascending structure after forming a strong local bottom around the Support Line, where buyers entered the market and started to push the price higher. This upward movement follows a long corrective phase, during which the price respected the diagonal Support Line multiple times — confirming the presence of a stable bullish trend. Earlier, XAUUSD broke out of the Buyer Zone (4,110–4,120), retested it, and successfully held above it. This zone now acts as a key demand area and the primary level where buyers continue defending the trend. A previous bearish attempt failed here, forming a fake breakout and leading to a new bullish impulse. The price is now approaching the descending Resistance Line, which has repeatedly pushed gold lower during the recent correction. A clean breakout above this trendline may open the way for the price to move toward the major Resistance Level at 4,240.00, which also aligns with the first take-profit area (TP1). This Resistance Level has acted as a strong reaction zone multiple times, causing sharp pullbacks and marking the boundaries of the Seller Zone. Buyers will likely face significant opposition here once again. If gold respects the Buyer Zone and maintains trading above 4,110, the bullish scenario remains intact, and the price may push toward TP1 → 4,240. A confirmed breakout above this level would signal continuation toward higher targets within the broader bullish structure. However, if XAUUSD fails to hold the Buyer Zone and breaks below 4,110, the bullish outlook becomes invalid. In this case, the price may revisit the lower trendline or enter a deeper correction toward previous support areas. For now, the structure remains moderately bullish, with buyers dominating as long as the price stays above demand and respects the ascending Support Line. Please share this idea with your friends and click "Boost" 🚀
